If you have a site, it’s pretty easy to choose the analytics system. The situation with mobile applications is quite diferent, since there are dozens of systems which compete for the leadership in the analytics area. How to choose the most appropriate one for your mobile application? I’ll try to organize data on trackers and analytics systems, so that you can find the best one for you.
1. Amplitude
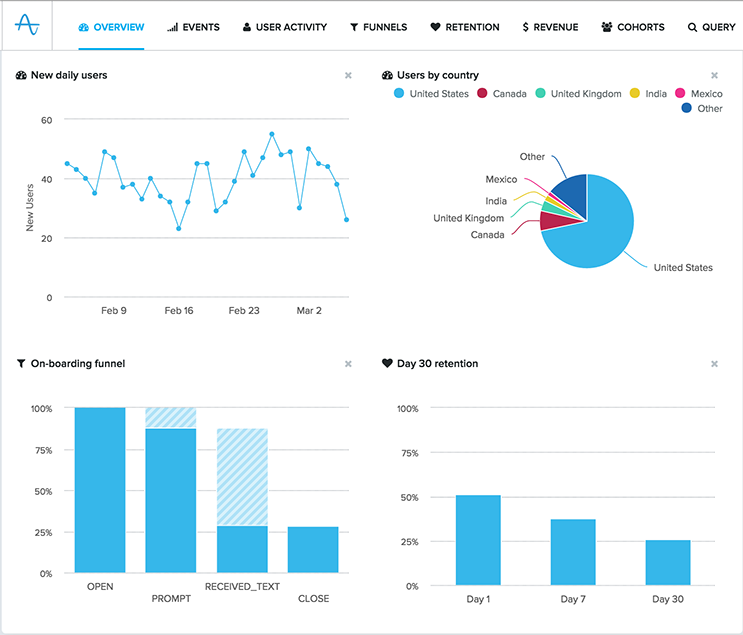
This is the analytics system, not a tracker, since this tool doesn’t attribute installation due to a definite traffic channel/source. I dare say, this is the only drawback of this tool. But it depends: Amplitude may be easily integrated with a good tracker (Adjust, AppsFlyer, Branch Metrics), which will allow you to identify a source/channel of installation.
Amplitude peculiarities
1. Viewing events in real-time mode with a-few-seconds delay. So, when updating your app, you may understand the way the users interact with it at once. You don’t have to wait until the required data are collected.
2. Building funnels. What are they for? Before making a purchase, a user has to follow some steps like viewing a product, adding it to the shopping cart, filling in an order, etc. The user may leave at any stage of making a purchase. So these funnels allow you to figure out the percentage of users, who leave at every stage of making a purchase. One more advantage — you may apply the users segment to every event from the funnel. Segment creation is not limited.
3. Using the advantages of the cross-device tracking function. You can track the user’s path on different devices which led to the app installation.
4. Connecting external APIs, so that you can get User ID for a definite identifier of Device ID, and consequently make more precise cross-device tracking. Installation may be properly attributed only within 24-hour period. If a user installs an app beyond this period, the chain will be broken. You may send various events and statistics data older than 30 days to the Amplitude server. The system usually stores data selection for the last 30 days and deletes older ones to avoid the server overload. This function is useful both for developers and advertisers: they have to keep data on all indicators to analyze the dynamics and to optimize an app.
5. Calculating Retention, Rolling Retention and Retention with a definite time frame: you may set the first, second-fifth and sixth-twelfth day. What’s the difference between classic Retention and Rolling Retention? Classic Retention is calculated as a share of users who reopened an app in a definite day.
6. Distinguishing cohorts followed by their segmentation without limiting the number of conditions applied.
7. Analyzing the indexes of purchases made. Amplitude has one more benefit — the purchase validation. The tool checks all data on purchases made and cuts off fake purchases. You’ll see only the relevant data.
8. Easily integrating it with A/B tests tools, push notifications, data visualization.
Pricing
The tool is available for Android and iOS for free if you transfer up to 10 millions events per month. «Free» plan doesn’t include SQL Access. «Enterprise» plan cost depends on the number of transferred requests and starts with $2 000 per month.
2. Branch Metrics
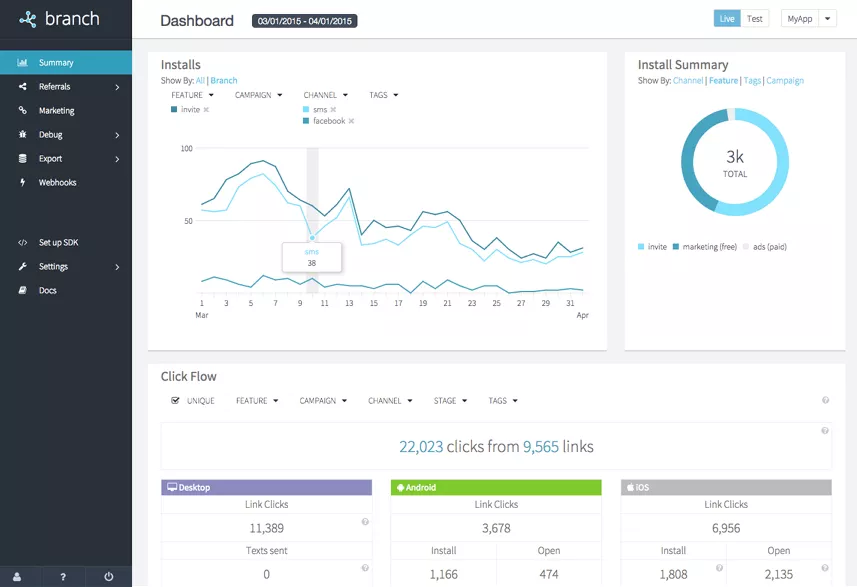
Unlike Amplitude, Branch Metrics is a tracker, not the analytics system. So it can track the channel/source of installation. But it doesn’t show how users interact with an app. The tool may be integrated with the analytics systems.
Branch Metrics peculiarities
1. Creating «deep links», i.e. when installing an app, a user will get not to the welcome screen, but to a definite category or section. Such function is relevant for ecommerce applications and advertisers who are aimed at increasing user involvement.
2. Tracking custom events: purchases in apps, their number and income. But this tool doesn’t have purchase validation function, so the statistics may include fake purchases. The tool has built-in reports, which include data on number of clicks, installations, percentage of clicks, number of app openings, event revenue. These data help to identify effective and and ineffective campaigns/traffic channels.
3. Using User Value Attribution to perform cross-device tracking function. This means that every User ID is assigned to every user as well as Device ID is assigned to every device. The system compares data and correlates the user and his devices.
4. Viewing data in real-time mode.
5. Integrating Branch Metrics with email newsletters tools.
Pricing
The tool is available for Android, iOS, Unity, and the pricing depends on the amount of the traffic you want to drive to your app, i.e. pay per click payment ($0,02 per click). The tool has demo version, just leave a request on the site to get it.
3. Kochava
![]()
This tools includes both tracker instruments and mobile analytics system.
Kochava peculiarities
1. Deep Linking.
2. Cross-device tracking.
3. Viewing data in real-time mode (available only in Premium plan).
4. Integrating with more than 2800 partner networks: Admob, Facebook, AdSync, InMobi, Inmoji, JumpTap, etc. This means, the platform attributes clicks from more than 2800 traffic sources. This is an advantage for advertisers and developers who haven’t chosen the channels to advertise their application yet.
5. Protecting from the fraud and empty installations. What are fraud and empty installations? They stand for a low-quality traffic launched by robots to let the partner network get more profit. However, it’s a waste of money for an advertiser, since bots make no profit and distort the traffic statistics.
6. Customizing attribution window — 30 days by default.
7. Creating and tracking events and goals. The tool is able to calculate users LTV, cost per installation, Media Cost & ROI, etc.
8. Correlating installations attribution to TV advertising.
9. Providing a great variety of standard reports on sex, age, devices, events, DAU/MAU/WAU, Retention, Revenue. This allows to distinguish segments and to build funnels on their basis as well as to create custom reports.
10. Using single SDK to avoid the application code overload.
Pricing
Kochava is available both for Android and iOS. Demo version is available. Pricing depends on the number of installations (from $0,03 per installation) and the set of the functions required.
4. Localytics
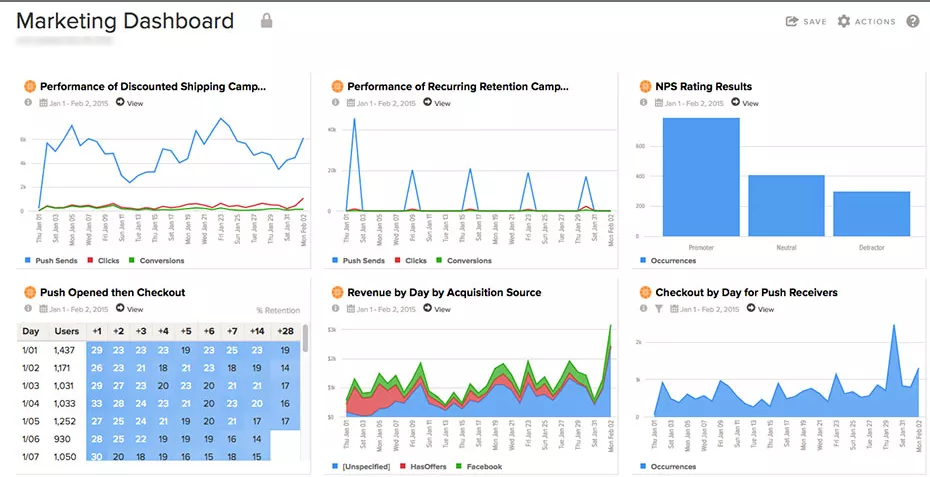
Like Kochava, Localytics is both the tracker and the mobile analytics system.
Localytics work principles
1. Tracking installations from Facebook, Google, Twitter, Inmobi and other partner networks. It has less partners than Kochava, but it can identify all popular traffic sources.
2. Viewing users actions in real-time mode with the several-minutes delay. Consider it when analyzing and checking data to make right conclusions.
3. Building funnels, creating users segments, making custom reports. It has one essential function — the cohort analysis.
4. Calculating DAU/MAU/WAU, LTV, classic Retention, ARPU, etc.
5. Carrying out A/B test and checking the boldest theories.
6. Using push notifications to re-engage the user in the application.
7. Integrating with the other analytics systems: Appsflyers, Adjust, Kochava, Branch Metrics.
Pricing
Localytics is available for Windows, Android and iOS. Pricing depends on the number of events you want to transfer and on the set of the functions required. Free trial period is provided.
5. Аpsalar
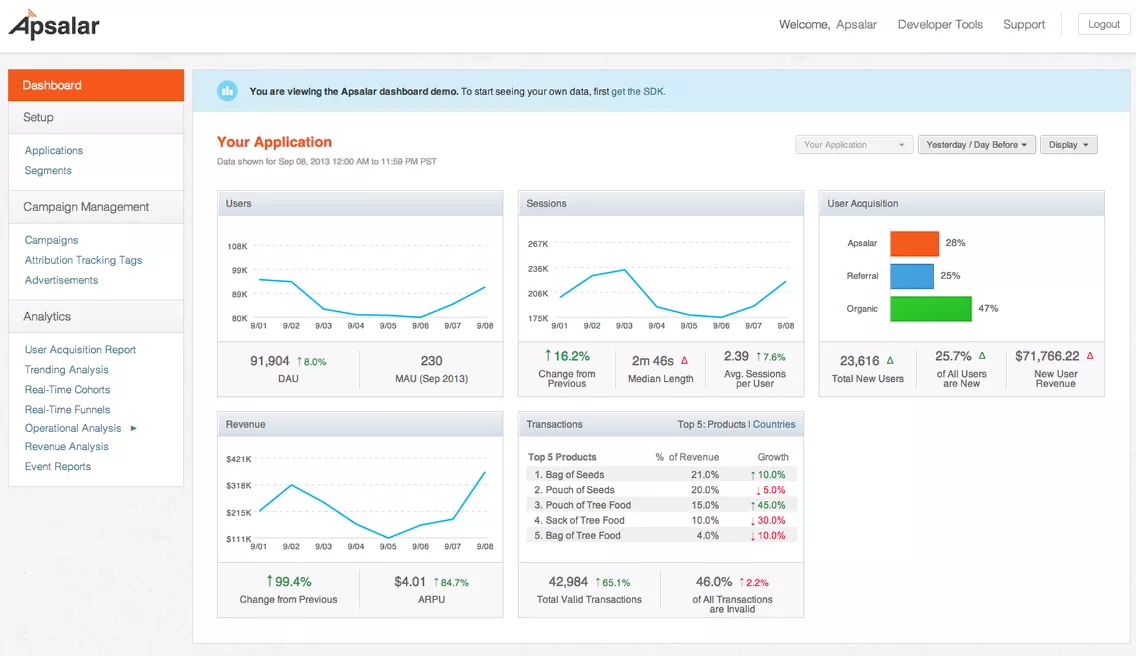
It has functions of both the analytics system and the tracker. The platform is integrated with more than 1000 partner networks (Google, Facebook, Twitter, Apple, Pinterest).
Apsalar peculiarities
1. Protecting from the fraud and double installations.
2. Uploading external APIs.
3. Using in-App analytics with the possibility to create both standard and custom reports.
4. Tracking any events in the app, creating own events.
5. Инструмент умеет считать LTV, ROAS, ARPU, Revenue, Retention.
6. Creating users cohorts, building funnels and distinguishing segments.
7. Viewing data in real-time mode.
8. Showing Uninstall Rate. Uninstall rate allows to know the percentage of users, who delete an app and to analyze their behavior to improve the product.
Pricing
Apsalar is available for Android, iOS, Windows. Plan price depends on the number of transferred events and the required set of instruments. Free trial period is provided.
Conclusion
Choosing a tracker and an analytics system is of great importance. This should be considered in advance, i.e. at the stage of creating an application, since it will take much time to analyze the advantages and drawbacks of the trackers. The market is big and it's hard to choose one single favorite. It all depends on the application peculiarities, personal preferences of advertisers and developers.
A piece of advice: first of all, decide what traffic sources to drive and what metrics to track. Then make a list of criteria according to which you’re going to choose a tracker. I hope that this review will make your choice easier.
The article was written in co-authorship with Tania Kichuk.

 4
4
 0
0
 4
4
Related Articles
How to Set Up Consent Mode in GA4 on Your Website with Google Tag Manager
Let's explore how to properly integrate consent mode in GA4, configure it for effective data collection, and at the same time comply with GDPR and other legal regulations
Display Advertising Effectiveness Analysis: A Comprehensive Approach to Measuring Its Impact
In this article, I will explain why you shouldn’t underestimate display advertising and how to analyze its impact using Google Analytics 4
Generative Engine Optimization: What Businesses Get From Ranking in SearchGPT
Companies that master SearchGPT SEO and generative engine optimization will capture high-intent traffic from users seeking direct, authoritative answers