In Google Analytics, you can define any user action as a conversion. However, it is better to specify activities valuable to your business, such as purchasing a product, viewing a product card, or filling out a contact form. The conversion rate indicates the percentage of site visitors who have performed a target action compared to the total number of users. GA 4 can be used to measure this critical indicator.
Comparison of conversion rates in Universal Analytics and Google Analytics 4
First, let's take a look at how Universal Analytics' conversion rate differs from the conversion rate in GA 4.
Conversions in Universal Analytics
You can track conversions in Universal Analytics with events and conversion events.
- An event is a user action on a website or mobile app that can be logged by adding a unique code to the appropriate element. Using tags, triggers, and variables, Google Tag Manager can also track events.
- A conversion event is a predefined goal that defines an event as a conversion.
In other words, a conversion (target) in Universal Analytics means that the user performs a targeted action on the site or mobile app, which may be anything from clicking a button, viewing a particular area of the page, to making a call or a purchase.
For a more purposeful use of goals, they are divided into two types.
Basic goals (macro goals): By fulfilling these goals, business owners can get actual financial returns or commercial benefits: a call, an order, or an application. They are aimed at the essential interaction of businesses with clients.
Auxiliary goals (micro goals): These are goals that are set at the intermediate stages of the conversion funnel.
Information about the stage in the conversion funnel at which the user stopped engaging is extremely valuable. It allows you to improve a specific phase and increase the overall conversion rate.
In Universal Analytics, the conversion rate is the number of conversions divided by the total number of sessions in a certain amount of time. This figure is given as a percentage.
Conversion in Google Analytics 4
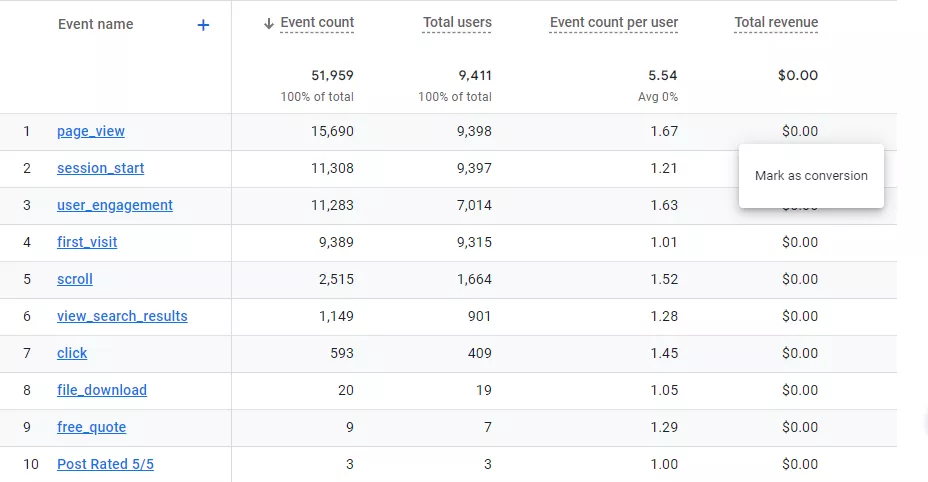
Google Analytics 4 introduces the Event-Driven Data Model. User actions are tracked as events, and event-based conversions have replaced goals. To set up conversions in Google Analytics 4, access the “Events” report and select the events for conversions. For each resource (website or application), GA 4 can define up to 30 event-based conversions.

Note that Google Analytics tracks purchases as a conversion by default. It is crucial to properly configure ecommerce events for optimal Google Analytics performance.
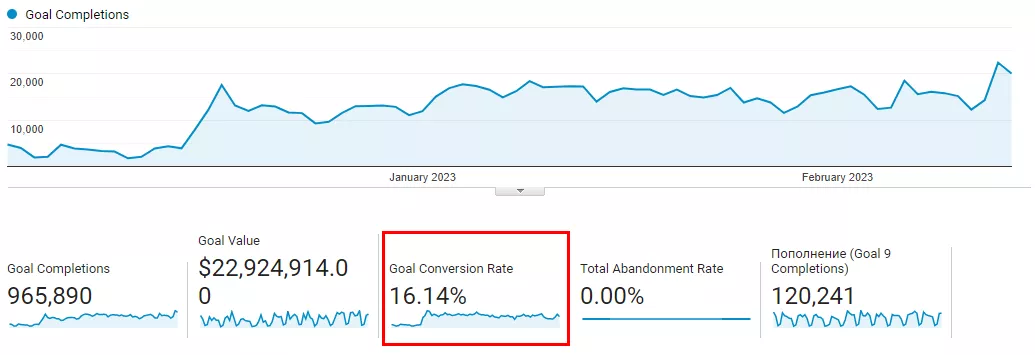
How to define and measure conversion rate in Google Analytics 4
Initially, there was no conversion rate metric in Google Analytics 4, but Google officially added it on July 11, 2022. There are now two types of conversion rates in GA 4.
- Session conversion rate: this rate corresponds to the conversion rate in Universal Analytics.
- User conversion rate: the number of users who performed a targeted action at least once out of the total number of users.
Adding the conversion rate to standard reports
Using the following steps, you can set up conversion rates so that they appear in standard GA 4 reports.
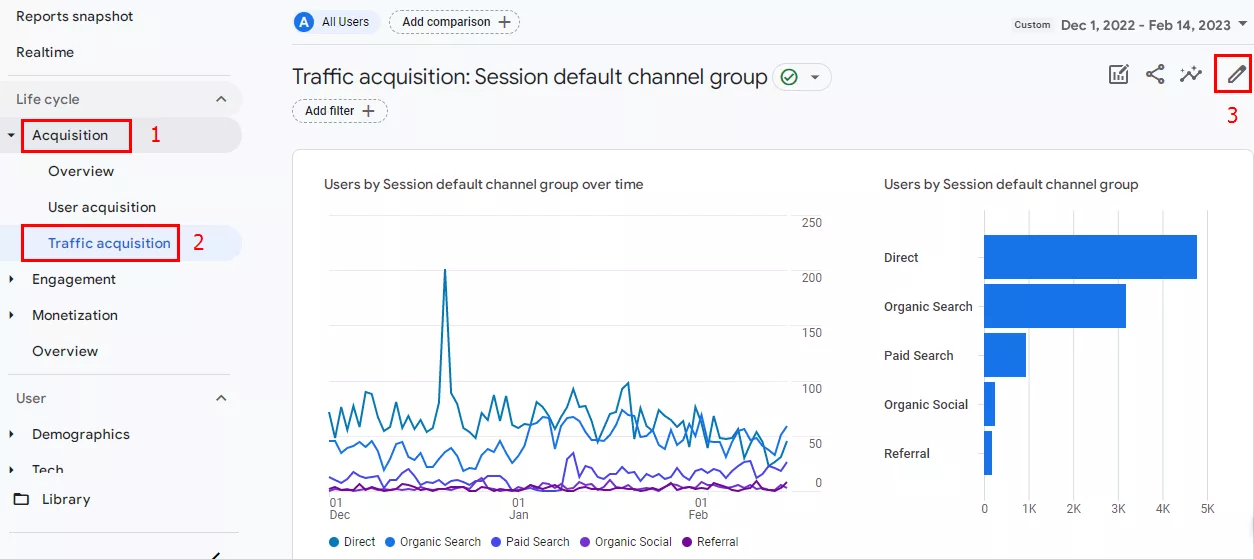
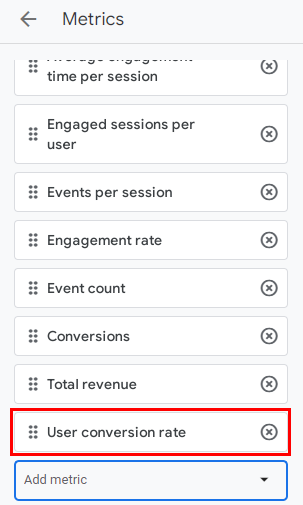
- Under “Reports”, select “Acquisition” followed by “Traffic Attraction” and click on the pencil icon in the upper right corner.
- Click on “Metrics”, and select either “User Conversion Rate” or “Session Conversion Rate”.
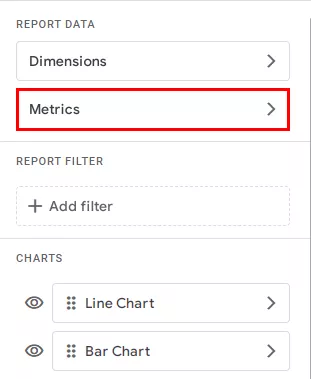
- Save the new indicator by clicking “Apply”.
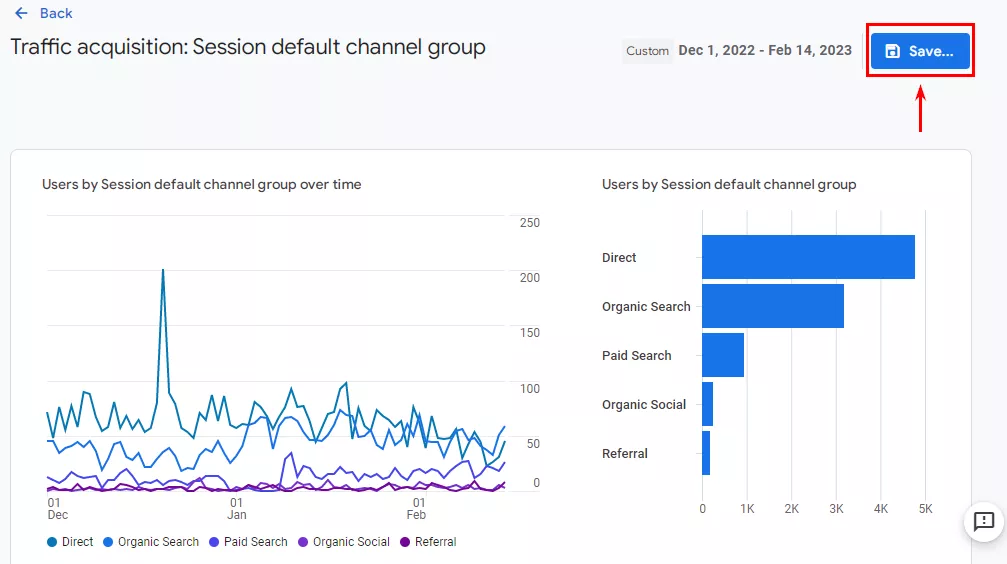
- Save all changes by clicking the “Save” button.
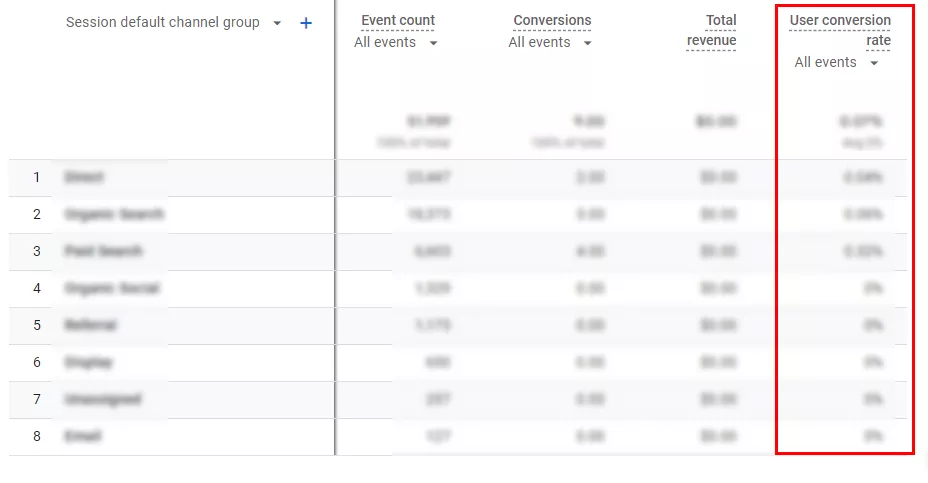
User conversion rate in a standard report:
Evaluating the conversion rate
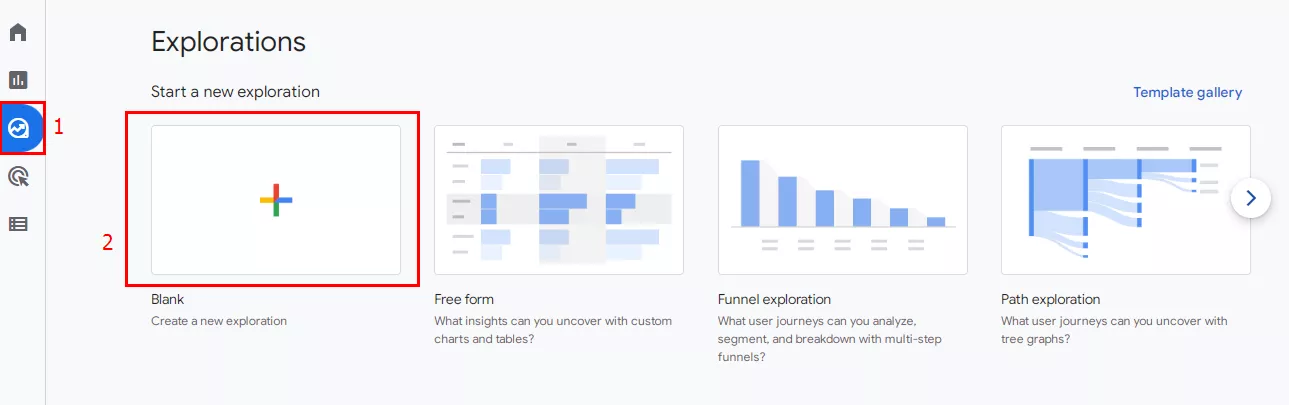
In Google Analytics, you can gather data on both user conversion rates and session conversion rates. Not only that, but you can also create custom reports with the parameters that suit your specific business.
- On the left sidebar, go to the Explore section and click on the “Start a new exploration” button.
- Go to the Dimensions tab.
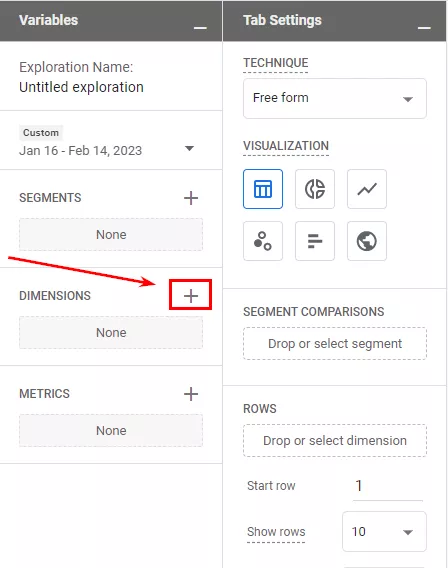
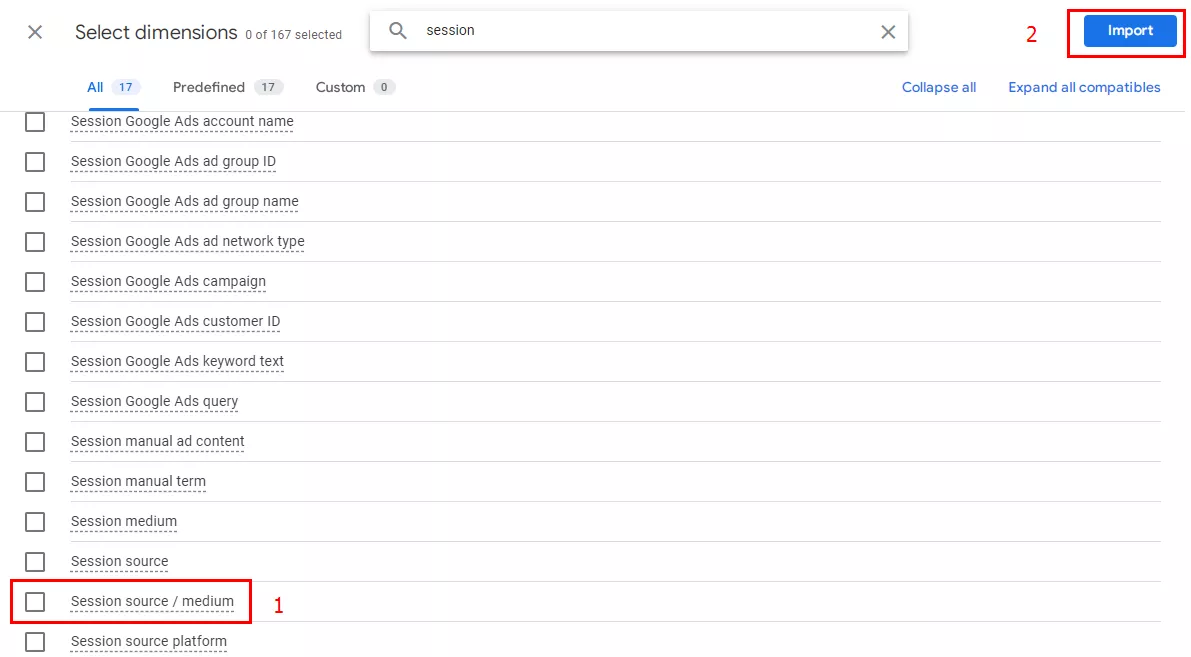
- Select “Session source / medium” and click “Import”.
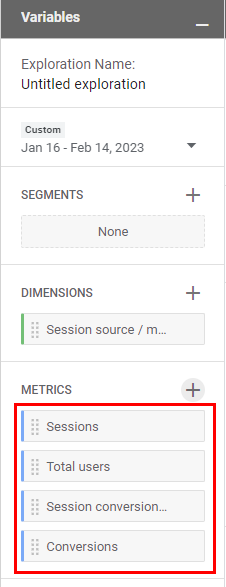
- In the Variables section, add the metrics you want to include in your report. For example, sessions, total users, conversions, and user conversion rate (or session conversion rate). Then, click on the “Import” button.
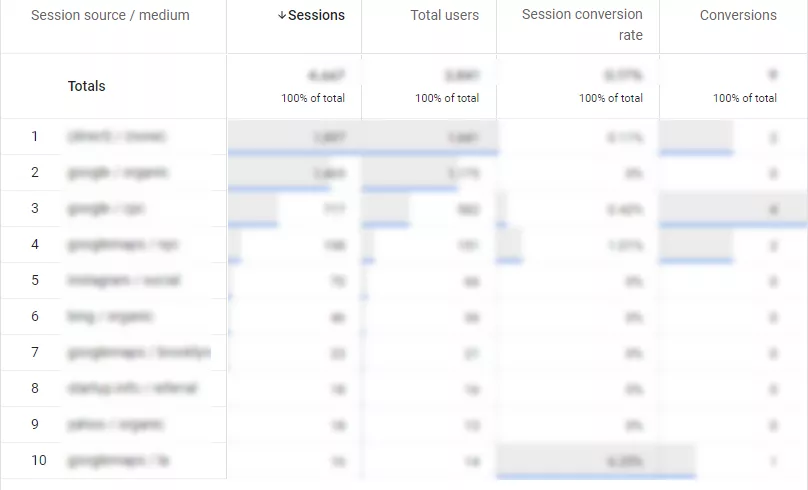
- Drag the session source/ medium to “Rows” and drop all metrics to Values. Both sections are located in the “Tab settings”.
Now you have a list of the most valuable sources and channels, along with their conversion rates, at your disposal.
Key takeaways
Google Analytics 4 presents the conversion rate as a percentage in two formats. Each format reflects a different measure of performance.
- The session conversion rate shows the ratio of conversions to the total number of sessions at a specific time.
- The user conversion rate shows the percentage of users who completed the desired action out of the total number of users.
Conversion rates can act as an indicator that a particular marketing channel is losing or increasing its effectiveness. You can tell by adding the metric to your standard GA 4 reports or by setting up relevant surveys. To optimize your conversion rates and unlock the full potential of your digital marketing efforts, consider partnering with a specialized CRO Agency that can provide tailored strategies and expertise to improve your website's performance and drive more conversions.
Read also about other

 3
3
 1
1
 2
2
Recommended theme posts
Related Articles
How to Set Up Consent Mode in GA4 on Your Website with Google Tag Manager
Let's explore how to properly integrate consent mode in GA4, configure it for effective data collection, and at the same time comply with GDPR and other legal regulations
Display Advertising Effectiveness Analysis: A Comprehensive Approach to Measuring Its Impact
In this article, I will explain why you shouldn’t underestimate display advertising and how to analyze its impact using Google Analytics 4
Generative Engine Optimization: What Businesses Get From Ranking in SearchGPT
Companies that master SearchGPT SEO and generative engine optimization will capture high-intent traffic from users seeking direct, authoritative answers