Facebook becomes more and more popular as a marketing platform. However, the Facebook Ads Manager tool isn’t user-friendly enough to carry out statistical analysis. One of the alternative ways to do that is to import data into R and visualize it. In this article, I’m going to share the detailed steps on how to extract data from API and work with it in R.
R is a programming language for statistical computing and graphics and is available under the GNU General Public License. A lot of users create new packages every day. It makes the R library well-stocked, it provides more basic opportunities for the R language.
I’ve written a set of functions to work with Facebook API and gathered them in a rfacebookstat package available at GitHub and CRAN.
1. Create an App in Facebook
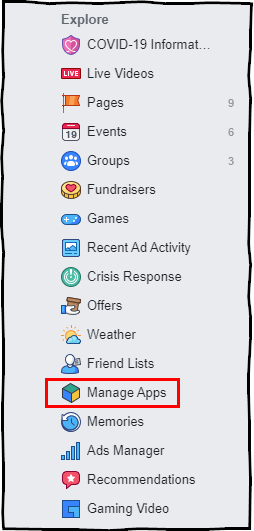
1.1. To start work with Facebook API, you should create a new app. Follow this link and click “App Manager” in a left side navigation menu.
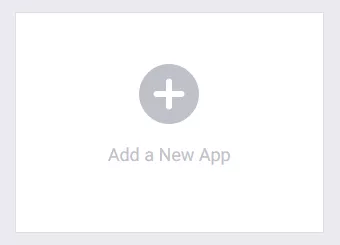
1.2. In facebook platform for developers click “+ Add a New App”.
Fill in the textboxes “Display Name”, “Contact Email”, “Category” and hit “Create App ID”.
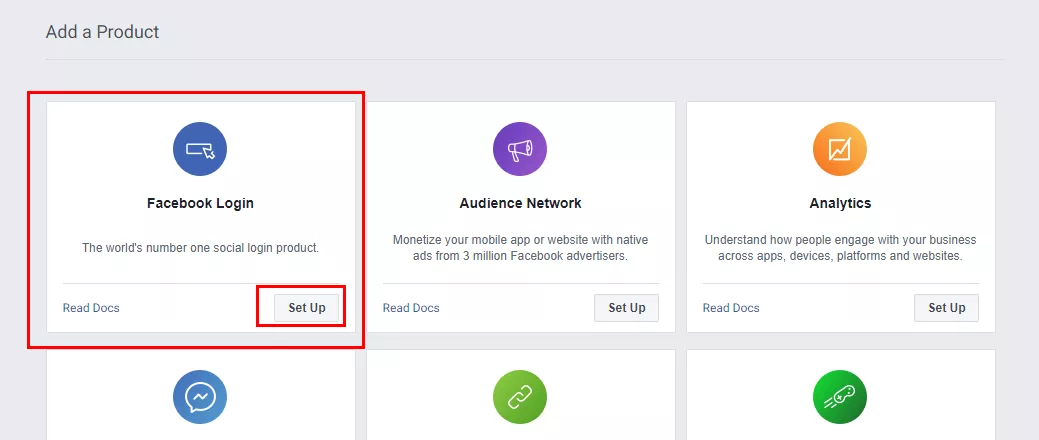
1.3. You’ll see the “Product Installation and Setup” menu. Select “Facebook Login” and click “Set Up”.
1.4. Select WWW.
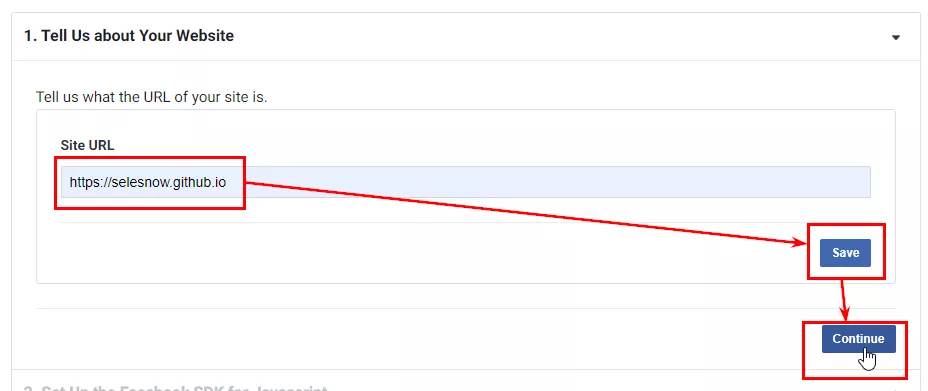
1.5. Type https://selesnow.github.io in the “Site URL” textbox and hit “Save” → “Continue”.
1.6. Select “Facebook Login” on a sidebar menu. Type “https://selesnow.github.io/rfacebookstat/getToken/get_token.html” in the “Valid OAuth Redirect URLs” textbox.
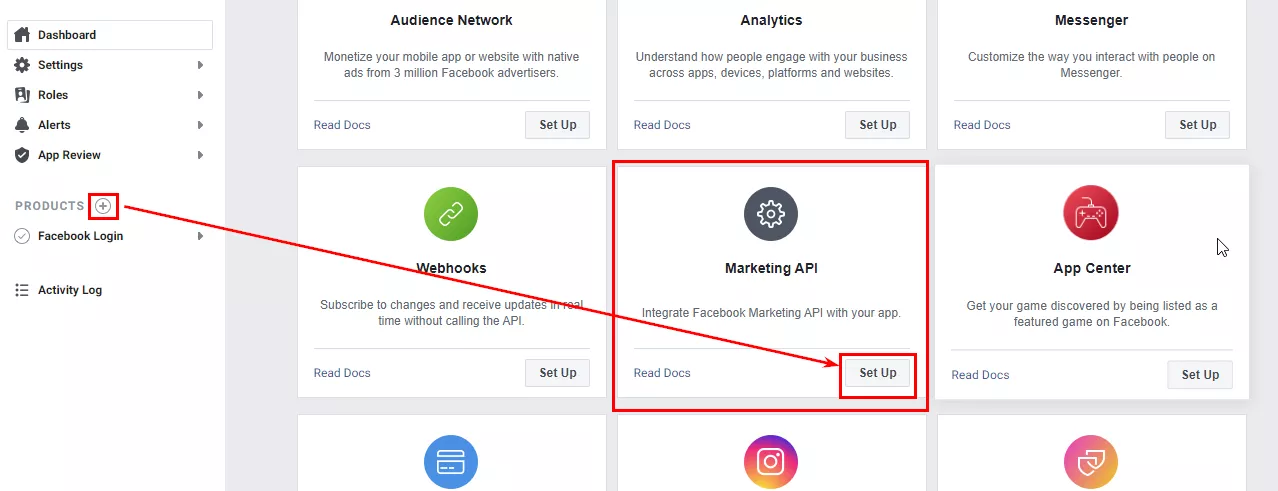
1.7. Select one more product: “API Marketing”:
Finish creating and setting the app. Select “Settings” → “Basic” and copy the App ID and App Secret.
You’ll need this data to authorize later.
Important: Many people flip the switch on for the “In Development” status and get an authorization error afterward as one must complete a detailed verification process on Facebook to publish an app. Thankfully, if you register your app for personal us, you don’t have to flip the switch on.
2. Install rfacebookstat Package
A rfacebookstat package is available for install from CRAN and GitHub.
2.1. To install CRAN packages, use a standard command install.packages().
install.packages("rfacebookstat")2.2. Enable the rfacebookstat package.
The package may be considered a separate software program, so you have to install it first and launch every time you need it. Enable packages in R using a library() function.
library(rfacebookstat)3. Get Facebook API Access Token
Get authorized to start work with Facebook API. Use a fbAuth() function in the rfacebookstat package.
3.1. Select “Settings” → “Basic”, copy the App ID and App Secret and paste them into the corresponding function arguments.
fbAuth(app_id = 00000000000000, app_secret = "xxxxxxxxxxxxx", username = "your login")Paste your Facebook login as a username argument.
3.2. If this is the first time you get a token, you may get a warning notification that some things aren’t approved by Facebook yet. Skip this by clicking “Continue as...”.
Confirm Facebook Login.
As you get redirected to a website with my packages https://selesnow.github.io, a short-lived authorization token is generated for you.
If JavaScript is enabled in your browser, the token will be copied to the clipboard, and in thirty seconds you’ll be redirected to an official page with a package help. If JavaScript is disabled, you’ll have to copy the token manually.
3.3. Enter a value into the R console.
3.4. Your short-lived token will be replaced with the long-lived one and you’ll see the following notification:
Token changed to long time successfully
Do you want save your access token into rds file
C:/Users/Username/Documents/blog_login.rfb_auth.rds
for use it between R sessions? y / n (recmedation y) ?:
The first line that informs you of the token replacement is followed by the second one that asks if you’d like to save the data to use it later in various R sessions. I strongly recommend you to choose ’y’ as it will save you the trouble of getting authorized via browser every time later.
3.5. Request a list of available accounts to check if authorization is successful.
fbGetAdAccounts(username = "your login")
If you get a list of accounts, the authorization is successful; if you get an error, you’ve probably configured an app improperly.
{tilda_form_wildcard_23159580}
4. Get Facebook Advertising Statistics
The preparation stage is over, we can proceed with data import.
The main function of the rfacebookstat package is fbGetMarketingStat(). Let’s go into detail on how to work with this function as it can help you get any data on any advertising account performance.
4.1. Syntax
stat <- fbGetMarketingStat(accounts_id  = "act_0000000000",
sorting      = NULL,                           level        = "account",
 breakdowns   = NULL,                           fields       = "account_id,
campaign_name,                                           impressions,
 clicks,                                            reach,
 spend",                           filtering    = NULL,
date_start   = Sys.Date() - 30,
 date_stop    = Sys.Date(),
username     = getOption("rfacebookstat.username"),
token_path = fbTokenPath())
The code above contains most of the arguments of a function fbGetMarketingStat() set as default values.
4.2. Function arguments
4.2.1. accounts_id: an ad account ID. It’s a required argument. You can get it from a URL if you open a Facebook advertising account you need.
As you have to indicate an ad account ID every time you open API, you can avoid such data duplication by inserting the list of accounts you need at the beginning of a script in the rfacebookstat.accounts_id option.
options( rfacebookstat.accounts_id = c("47725506", "361373151") )After that every function of the rfacebookstat package will automatically import accounts specified in the rfacebookstat.accounts_id option.
4.2.2. sorting: data sorting. It’s an optional argument. Available options are ‘field list’ and ‘sorting direction’ (in either ascending or descending order). For example, reach_descending, impressions_ascending.
4.2.3. level: the Ads object level. It’s a required argument. Available options are ‘ad’, ‘adset’, ‘campaign’, ‘account’. For example, level = "account".
4.2.4. fields provide data you want to import. It’s a required argument. For example, fields = "account_id,account_name,campaign_name,impressions,unique_impressions,clicks,unique_clicks,reach,spend".
See the table below for a more detailed field list available in API 2.8. or refer to official documentation.
Field | Description |
account_id numeric string | The ID number of your ad account, which groups your advertising activity. Your ad account includes your campaigns, ads and billing. |
account_name string | The name of your ad account, which groups your advertising activity. Your ad account includes your campaigns, ads and billing. |
action_values | The total value of all conversions attributed to your ads. |
actions | The total number of actions people took that are attributed to your ads. Actions may include engagement, clicks or conversions. |
ad_id numeric string | The name of the ad you're viewing in report. |
ad_name string | A unique advertising ID you can see in a report. |
adset_id numeric string | The unique ID of the ad set you're viewing in report. An ad set is a group of ads that share the same budget, schedule, delivery optimization and targeting. |
adset_name string | The name of the ad set you're viewing in report. |
app_store_clicks numeric string | The number of clicks on links within the ad that lead to your store. |
buying_type string | The paying method for target ads in your campaigns: through dynamic auction bidding, fixed-price bidding, or reach and frequency buying. This field is currently only visible at the campaign level. |
call_to_action_clicks numeric string | A metric that indicates the number of CTA clicks. |
campaign_id numeric string | The unique ID number of the ad campaign you're viewing in report. Your campaign contains ad sets and ads. |
campaign_name string | The name of the ad campaign you're viewing in report. Your campaign contains ad sets and ads. |
canvas_avg_view_percent numeric string | The average percentage of the Instant Experience. An Instant Experience is a screen that opens after someone interacts with your ad on a mobile device. It may include a series of interactive or multimedia components, including video, images, product catalog and more. |
canvas_avg_view_time numeric string | The average total time in seconds that people spent viewing an Instant Experience. An Instant Experience is a screen that opens after someone interacts with your ad on a mobile device. It may include a series of interactive or multimedia components, including video, images, product catalog and more. |
clicks numeric string | A total number of your ad clicks. The list includes third-party website clicks, likes, comments on posts, responses to invitations or app installs. |
cost_per_10_sec_video_view | The average cost per every 10-second video view. |
cost_per_action_type | The average cost of a relevant action. |
cost_per_estimated_ad_recallers numeric string | The average cost for each estimated ad recall lift. |
cost_per_inline_link_click numeric string | The average cost of each inline link click. |
cost_per_inline_post_engagement numeric string | The average cost of each inline post engagement. |
cost_per_total_action numeric string | The average cost per action. |
cost_per_unique_action_type | The average cost of each unique action. |
cost_per_unique_click numeric string | The average cost for each unique click (all). |
cost_per_unique_inline_link_click numeric string | The average cost of each unique inline link click. |
cpc numeric string | The average cost for each click (all). |
cpm numeric string | The average cost for 1,000 impressions. |
cpp numeric string | The average cost to reach 1,000 people. |
ctr numeric string | The percentage of times people saw your ad and performed a click (third-party clicks, likes, responses to invitations). |
date_start string | The start date for your data. This is controlled by the date range you've selected for your report. |
date_stop string | The end date for your data. This is controlled by the date range you've selected for your report. |
deeplink_clicks numeric string | Number of link clicks at specific app components. |
estimated_ad_recall_rate numeric string | The rate at which an estimated number of additional people, when asked, would remember seeing your ads within 2 days (expressed as a percentage). |
estimated_ad_recallers numeric string | An estimate of the number of additional people who may remember seeing your ads, if asked, within 2 days. This metric is only available for assets in the Brand awareness, Post engagement and Video views Objectives. |
frequency numeric string | The average number of times each person saw your ad. |
impressions numeric string | The number of times your ads were on screen. |
inline_link_click_ctr numeric string | The percentage of time people saw your ads and performed an inline link click. |
inline_link_clicks numeric string | The number of clicks on links to select destinations or experiences, on or off Facebook-owned properties. Inline link clicks use a fixed 1-day-click attribution window. |
inline_post_engagement numeric string | The total number of actions that people take involving your ads. Inline post engagements use a fixed 1-day-click attribution window. |
newsfeed_avg_position numeric string | The average position where your ad was inserted into people's news feeds on mobile and desktop. Position 1 is the one at the top of the feed. |
newsfeed_clicks numeric string | The total number of clicks your ad received in people's news feed, on mobile and desktop. |
newsfeed_impressions numeric string | The total number of times your ad was inserted into people's news feeds, on mobile and desktop. |
objective string | The objective reflecting the goal you want to achieve with your advertising. It may be different from the selected objective of the campaign in some cases. |
reach numeric string | The number of people who saw your ads at least once. Reach is different from impressions, which may include multiple views of your ads by the same people. |
relevance_score AdgroupRelevanceScore | Gives you an idea of how relevant your ads are to the people in your target audience. It uses a 1-10 scale in which one means that your ad is much less relevant than other ads targeting the same audience. You'll be able to see this score once your ad has had about 500 impressions (not for ad groups or campaigns). |
social_clicks numeric string | The number of clicks to link your ad receives when it's shown with social information (e.g. Jane Smith likes this). |
social_impressions numeric string | This is the number of times your ad was viewed and included social information. |
social_reach numeric string | The number of people who saw your ad including social information. |
social_spend numeric string | The total amount you've spent so far for your ads showed with social information. (ex: Jane Doe likes this). |
spend numeric string | The estimated total amount of money you've spent on your campaign, ad set or ad during its schedule. |
total_action_value numeric string | The total value of all conversions attributed to your ads. |
total_actions numeric string | The total number of actions people took that are attributed to your ads. Actions may include engagement, clicks or conversions. |
total_unique_actions numeric string | The number of people who took an action that was attributed to your ads. |
unique_actions | The number of people who took an action that was attributed to your ads. |
unique_clicks numeric string | The number of people who performed a click (all). For example, if three people clicked the same ad five times, the number of unique clicks is three. |
unique_ctr numeric string | The percentage of people who saw your ad and performed a unique click (all). The metric is calculated as unique clicks (all) divided by reach. |
unique_impressions numeric string | The number of unique people who saw your ad, regardless of how many times they viewed it. |
unique_inline_link_click_ctr numeric string | The percentage of times people saw your ad and performed a link click. Inline click-through rate uses a fixed 1-day-click attribution window. |
unique_inline_link_clicks numeric string | The number of people who performed an inline link click. |
unique_link_clicks_ctr numeric string | The percentage of people who saw your ad and performed a link click. |
unique_social_clicks numeric string | The number of people who click on the link in your ad that directs people outside of Facebook when it's shown with social information (e.g. Jane Smith likes this). |
unique_social_impressions numeric string | The number of people who saw your ad on a screen. |
video_10_sec_watched_actions | The number of times your video played for at least 10 seconds, or for nearly its total length (depending on what comes first). |
video_15_sec_watched_actions | The number of times your video played for at least 15 seconds, or for nearly its total length (depending on what comes first). |
video_30_sec_watched_actions | The number of times your video played for at least 30 seconds, or for nearly its total length (depending on what comes first). |
video_avg_pct_watched_actions | (The metric will soon be deprecated, please use video_avg_percent_watched_actions). The average time a video was played divided by the number of views. The metric is not available for a live broadcast. |
video_avg_percent_watched_actions | The average time a video was played, (expressed as a percentage). |
video_avg_sec_watched_actions | The metric will soon be deprecated, please use video_avg_time_watched_actions). The average time a video was played divided by the number of views. The metric is not available for a live broadcast. |
video_avg_time_watched_actions | The average time a video was played, including any time spent replaying the video for a single impression. |
video_complete_watched_actions | The number of times your video played for at least 30 seconds, or for nearly its total length (depending on what comes first). |
video_p100_watched_actions | The number of times your video was played at 100% of its length, including plays that skipped to this point. |
video_p25_watched_actions | The number of times your video was played at 25% of its length, including plays that skipped to this point. |
video_p50_watched_actions | The number of times your video was played at 50% of its length, including plays that skipped to this point. |
video_p75_watched_actions | The number of times your video was played at 75% of its length, including plays that skipped to this point. |
video_p95_watched_actions | The number of times your video was played at 95% of its length, including plays that skipped to this point. |
website_clicks numeric string | The number of clicks on links within the ad that lead to your website. |
website_ctr | The percentage of times people saw your ad and performed a link click. |
4.2.5. Breakdowns are used to capture Ads Insights responses that are grouped into different sets or cohorts. Supported breakdowns are:
- age;
- country;
- gender;
- frequency_value;
- hourly_stats_aggregated_by_advertiser_time_zone;
- hourly_stats_aggregated_by_audience_time_zone;
- impression_device;
- place_page_id;
- placement;
- device_platform;
- product_id;
- region;
- actions;
- publisher_platform;
- platform_position;
- impression_device.
Breakdowns can be combined. The following combinations are available now:
Fields marked with * can be requested together with action_type, action_target_id and action_destination.
- action_type *;
- action_target_id *;
- action_device *;
- action_device, placement *;
- action_device, placement, impression_device *;
- action_device, publisher_platform *;
- action_device, publisher_platform, impression_device *;
- action_device, publisher_platform, platform_position *;
- action_device, publisher_platform, platform_position, impression_device *;
- action_reaction;
- action_type, action_reaction;
- age *;
- gender *;
- age, gender *;
- country *;
- region *;
- placement *;
- placement, impression_device *;
- publisher_platform *;
- publisher_platform, impression_device *;
- publisher_platform, platform_position *;
- publisher_platform, platform_position, impression_device *;
- product_id *;
- hourly_stats_aggregated_by_advertiser_time_zone *;
- hourly_stats_aggregated_by_audience_time_zone *;
- action_carousel_card_id / action_carousel_card_name;
- action_carousel_card_id / action_carousel_card_name, placement;
- action_carousel_card_id / action_carousel_card_name, placement, impression_device;
- action_carousel_card_id / action_carousel_card_name, country;
- action_carousel_card_id / action_carousel_card_name, age;
- action_carousel_card_id / action_carousel_card_name, gender;
- action_carousel_card_id / action_carousel_card_name, age, gender.
For example: breakdowns = "region"
4.2.6. filtering: data filtering. An optional argument. Filters are specified as JSON objects “key:value”. Indicate three properties:
- field: a filtering field;
- operator: a logical operator ('EQUAL', 'NOT_EQUAL', 'GREATER_THAN', 'GREATER_THAN_OR_EQUAL', 'LESS_THAN', 'LESS_THAN_OR_EQUAL', 'IN_RANGE', 'NOT_IN_RANGE', 'CONTAIN', 'NOT_CONTAIN', 'IN', 'NOT_IN', 'ANY', 'ALL', 'NONE');
- value: a filtering value.
For example:
filtering = "impressions LESS_THAN 5000"4.2.7. Date_start: This shows the start date of a campaign if it’s already running or the date when it’s scheduled to begin in a YYYY-MM-DD format.
4.2.8. date_stop: This shows the end date of the campaign in a YYYY-MM-DD format.
4.2.9. api_version: Facebook API version.
4.2.10. access_token: an access token.
5. Examples of how to use fbGetMarketingStat
5.1. Before you launch the examples below, you should generate an API token and save it as a file with the help of a fbAuth() function.
fbAuth(app_id = 00000000000000, app_secret = "xxxxxxxxxxxxx", username = "your login")5.2. Enter the following code to get the statistics on the number of impressions, clicks and ads spends at the account level and separately for each region:
AccStat <- fbGetMarketingStat(
 accounts_id = “act_0000000000”,
 level = "account",                      fields = "account_id,
 account_name,                                impressions,
  clicks,                                spend",
 breakdowns = "region",                      date_start = "2020-03-01",
date_stop = "2020-03-30",                      username   = "your login")
5.3. Get the statistics on the number of unique impressions and unique clicks filtered by age groups “18-24”, “25-34” and data sorting in decreasing order of unique impressions (the ‘reach’ field).
CampStat <-     fbGetMarketingStat(accounts_id = "act_0000000000",
level = "campaign",                          fields = "campaign_name,
reach,                                    unique_clicks",
breakdowns = "age",                          sorting = "reach_descending",
filtering  = "age IN 18-24,25-34",                          date_start = "2020-03-01",
 date_stop  = "2020-03-30",                          username   = "your login")
Conclusions
Utilizing Facebook API and rfacebookstat R package enables you to:
- get the data on all advertising accounts, campaigns, ads etc. from different perspectives.
- create data visualizations using all power of R.
- transfer the data to any database or save it as a CSV.
Recommended theme posts
Related Articles
Display Advertising Effectiveness Analysis: A Comprehensive Approach to Measuring Its Impact
In this article, I will explain why you shouldn’t underestimate display advertising and how to analyze its impact using Google Analytics 4
Generative Engine Optimization: What Businesses Get From Ranking in SearchGPT
Companies that master SearchGPT SEO and generative engine optimization will capture high-intent traffic from users seeking direct, authoritative answers
From Generic to Iconic: 100 Statistics on Amazon Marketing for Fashion Brands
While traditional fashion retailers were still figuring out e-commerce, one company quietly revolutionized how U.S. consumers shop for everything from workout gear to wedding dresses

