How to Measure Your Newsletter Performance: 10 Key Email Marketing Metrics
When setting up communication with their audience, businesses often use email newsletters to stay in touch. To get the most out of a newsletter, you have to use it properly and clearly understand what it does and what results to expect.
In this article, I will tell you how to evaluate the effectiveness of email newsletters. I will also discuss what metrics to track in order to respond promptly at each stage of the funnel and how you can use those to improve key indicators.
Why measure newsletter performance?
When starting an email newsletter, every professional or business owner sets a budget, chooses the type of newsletter, and decides on a strategy. But it doesn’t end there: once the newsletter is sent out, you need to use metrics to evaluate its performance.
Measuring metrics will give you an understanding of how the customer behaves at each stage of the funnel. Most importantly, it will help you identify if the newsletter needs to be adjusted or if costs and target channels need to be changed.
By collecting data on all key indicators, you will be able to:
- identify conversion slippage points in time and fix errors;
- learn more about your target audience and adjust your marketing strategy;
- optimize the campaign budget;
- determine if the channel is profitable and feasible to use in the project.
Email newsletter performance metrics
Performance metrics are available for each individual email at the ESP (Email Service Provider) and must be analyzed to understand customer behavior. Based on the results, you can make adjustments to each campaign email and increase conversion rates. Performance metrics include:
- inbox placement rate;
- bounce rate;
- open rate;
- click-through rate;
- conversion rate;
- unsubscribe rate;
- spam complaint rate.
Inbox placement rate
Some emails never reach their intended recipients because they do not pass through the filters of servers and email providers. That’s where this metric comes in — it measures how often an email is delivered to the user's inbox as opposed to being sent to the user's spam folder. The optimal level of email deliverability is above 95%.
To maintain a high inbox placement rate, it is necessary to maintain a good reputation for the sender's domain. In addition, the email database should be regularly checked for:
- those who have unsubscribed;
- those who have complained about spam;
- non-existent email addresses;
- other delivery errors.
It’s important to remove these from the email database, as emails directed to these recipients will get stuck halfway and won’t make it to the inbox.
Discover essential email marketing definitions in our glossary to enhance your campaigns!
Bounce rate
The bounce rate is the ratio of undelivered emails to the total number of emails sent. In simple words, these are delivery failures.
A bounce rate of less than 5% is unlikely to harm your domain’s reputation.
Here are a few steps you can take to reduce the bounce rate:
- Consistently clean the database of delivery errors.
- Implement double-opt-in (double confirmation of subscription), which will help prevent the addition of email addresses with errors into the database.
- Use postmaster for regular monitoring of domain reputation.
- Reduce the number of spam words in the newsletter;
- Have a visible unsubscribe button.
Exceeding the limit on the percentage of errors may first lead to a reduction in the number of emails that can be sent per hour. If the limit is repeatedly exceeded, the account might be blocked. Therefore, it is worth updating your contacts after each newsletter to keep the bounce rate low.
Open rate
The open rate is the ratio of opened emails to all sent emails.
It tells you how loyal your customers are to your brand and how interested they are in receiving emails from you.
On average, a good open rate is around 20%, but this number can vary from 10% to 40% depending on the size, quality, and activity of your subscriber base and niche.
How to increase open rates:
- Choose the most convenient time to send emails to your audience, and test different days and hours.
- Send certain types of emails at the same time.
- Choose interesting topics for your emails, and make them more enjoyable to read. Add something that will catch the subscriber's attention; this can be discounts, useful tips, etc.
- Remove inactive subscribers who have not opened emails for months from the email database.
- Use segmentation to send more personalized newsletters.
- Diversify promotional mailings with useful informational emails.
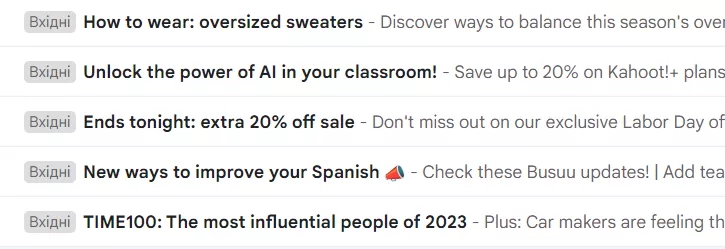
Here are a few examples:
However, there is a disadvantage to the open rate metric: a customer opening an email is not the same as reading it. Therefore, the open rate is calculated with a margin of error. It is also important to note that the open rate is directly related to the number of contacts in the database. Therefore, an open rate of 0% with a base of 50,000 contacts and an open rate of 10% with a base of 100,000 contacts are the same number of reads.
Contacts who haven't read the newsletter in 3-6 months should be sent reactivation trigger chains with a different subject line. These reactivation emails should remind users about your brand or company and the newsletter. You can include a motivational bonus or a questionnaire to learn about new topics that would interest subscribers.
Click-through rate
The click-through rate (CTR) indicates the ratio of people who clicked on a link in an email to the total number of recipients.
Essentially, it shows how much interest subscribers have in a brand’s offers and how many of them click on a link in the email.
The average CTR indicator is about 1-3%, but it can vary depending on the niche, quantity, and quality of the contact base.
Click-through open rate
The click-through open rate (CTOR) is the percentage of people who clicked a link in an email compared to the number of people who opened the email.
It shows the extent to which users are actually interested in the content of the email and understand any calls to action.
There is a fundamental difference between CTR and CTOR: click-through open rate takes into account missed and unread emails.
If the conversion rate from reads (the CTOR) is significantly higher than the click-through rate, it means that users are interested in the offers in the newsletters, and it is necessary to work on increasing the open rate.
If the CTOR doesn't differ from the CTR, then the problem is in the content of the emails.
There are a few steps you can take to increase the click-through rate from reads:
- Use segmentation to send personalized offers.
- Make emails user-friendly; adapt them for different devices and email providers.
- Add alt text and links to images in the email. Alt text is displayed if the user fails to download an image in the email.
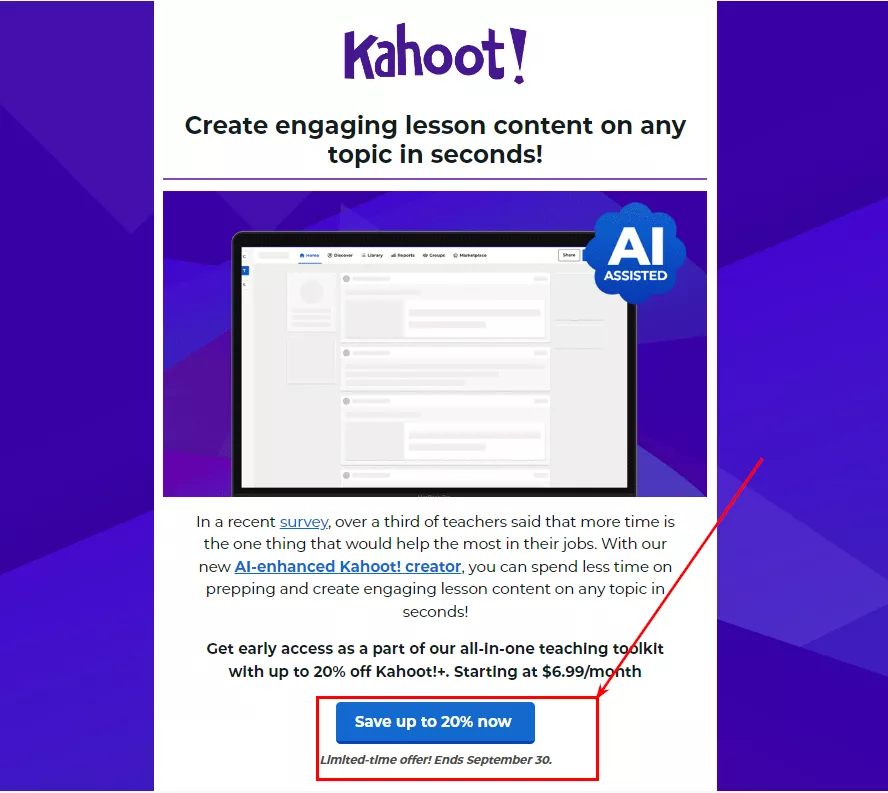
- Add clear CTAs (calls to action) using action verbs on visible buttons.
Email CTA examples:
What are the drawbacks of CTR and CToR metrics? In some niches, CTR is not indicative of customer interest. Emails with a clear call to action are intended for new subscribers who haven't yet made a purchase or for existing customers to inform them about changes in service usage, plan expirations, or the promotion of new features. In these types of emails, the open rate and time spent using the service are more meaningful. These, as well as other metrics, can be set up independently in Google Analytics.
Unsubscribe rate
The unsubscribe rate is measured by dividing the number of unsubscribes by the number of emails delivered.
A good unsubscribe rate is 0.5%. If it starts to exceed 1%, you should take a closer look at your newsletters and optimize your emails so that unsubscribes don't become spam complaints.
Why do customers unsubscribe?
- They may have subscribed just to get a one-time subscription bonus.
- The email newsletters are sent out too frequently.
- Customers are uninterested in the offers.
How to reduce unsubscribe rates:
- Communicate the long-term benefits of subscribing.
- Set up a trigger welcome series of emails to interest a new subscriber.
- Diversify mailings with different information sections.
- Optimize the frequency of newsletters by testing or sending surveys.
- Use segmentation to send personalized offers.
Spam complaint rate
The spam complaint rate is the ratio of those who marked your emails as spam to all recipients.
A good unsubscribe rate is less than 0.5%. If it starts to get higher than this, you should immediately take a number of actions to avoid being labeled as a spammer.
Why do subscribers complain about spam?
- Emails are sent too often.
- Emails are sent even if the user unsubscribed earlier.
- The unsubscribe button is hidden.
- The content of the email is spam-like: shouting phrases, bright fonts, an excess of emoji and exclamation marks, and intrusive sales messages.
How to reduce the spam complaint rate:
- Optimize the frequency of your emails by testing them or sending surveys.
- Regularly remove unsubscribed users from your database and do not add them back. These users will no longer receive emails, but keeping them in your database will spoil your activity statistics and increase the ESP rate for the number of contacts.
- Make the unsubscribe button visible.
- Don’t overwhelm your subscribers with emails, and avoid email content that can be confused with spam.
- Diversify the content plan with different information sections.
Exceeding the spam complaint rate limit is dangerous because being flagged as spam will immediately draw the attention of mail providers to the domain. In order to protect their users from spammers, email providers will lower the reputation of the domain, which will make it impossible to send letters. So, if you have to choose between two evils, let the customer unsubscribe once, which is safer for the domain's reputation, instead of complaining about spam.
Email campaign performance indicators for the reporting period
Running external analytics for each email campaign will allow you to evaluate how profitable the tool has been over a period of time and whether the investment has paid off. I'll talk about the performance indicators measured by analytics tools in more detail below.
Web sessions
Sessions are the number of website visits generated by an email campaign. The dynamics of sessions on the site can be used to analyze how the audience perceives the company’s offers. This metric also shows whether the emails encourage users to go to the site for further acquaintance with the product and whether the communication itself is appropriate and appealing.
It is important to analyze what portion of all site sessions are made up of visits from the email channel. If the number of sessions from mailing lists starts to decrease but the percentage of visits from the email channel stays the same, seasonality could be playing a role, not just the quality of newsletters. The opposite is true: if the percentage of sessions from the email channel starts to decrease, it is worth analyzing why this has happened. It could be due to the growth of other channels or a decrease in customer interest in mailings.
Conversion rate
The conversion rate refers to the ratio of recipients who performed a certain action to the total number of web sessions.
This metric demonstrates how email content, communication, time of year, information occasion, and other variables affect the number of purchases.
If the conversion rate increases while the number of sessions remains the same, it can be assumed that revenue can be increased by increasing the number of newsletters or the CTR. If the conversion rate decreases while the number of sessions remains the same, we need to analyze whether this is due to seasonality, a major info occasion in the previous period, or the content of the newsletters.
This indicator reflects the customer's behavior on the website. Therefore, it also depends on the site interface, the ease and conditions of order placement, and other factors not directly related to email newsletters.
Return on marketing investment (ROMI)
ROMI can be either positive or negative. For example, a ROMI of 150% means that for every $1 invested in the campaign, there is a $1 return on investment and another $1.5 in net profit. A ROMI of 0% means that the marketing investment has fully paid off, but the campaign has not generated a profit. Meanwhile, a ROMI of -50% means that the marketing investment has only been half recouped and the campaign is not profitable.
FAQ
How do I evaluate the effectiveness of a newsletter?
Conduct a comprehensive analysis of business indicators for each individual mailing and the email campaign as a whole. This is necessary to understand customer behavior at each stage of the funnel and identify key growth points.
Which KPIs should be tracked?
To answer this question, you'll need to determine what business goals you're setting for your email campaign.
For example, these could be:
- channel revenue growth;
- automation of marketing processes;
- personalizing communications;
- attracting new users;
- reactivating old customers;
- boosting engagement in your newsletters;
- increasing website traffic through email subscribers, etc.
The main KPIs for evaluating the effectiveness of email newsletters are open rate, click-through rate, and event count (registrations, subscription purchases or renewals, consultation appointments, or other activities).
How do I calculate important metrics?
Here is a table that gives you formulas to calculate the main metrics of email newsletters.
|
Email newsletter effectiveness indicators |
|
|
Inbox placement rate |
(number of emails delivered / number of emails sent) * 100% |
|
Bounce rate |
(number of bounced emails / number of emails sent) * 100% |
|
Open rate |
(number of opened emails / number of emails delivered) * 100% |
|
Click-through rate |
(number of emails clicked / number of emails delivered) * 100% |
|
Conversion rate |
(number of emails clicked / number of emails opened) * 100% |
|
Unsubscribe rate |
(number of unsubscribers / number of emails delivered) * 100% |
|
Spam complaint rate |
(number of spam complaints / number of emails delivered) * 100% |
|
Email campaign effectiveness indicators for the reporting period: |
|
|
Web sessions |
web analytics tool |
|
Conversion rate |
(number of recipients who performed the CTA / number of web sessions) * 100% |
|
ROMI |
((revenue - marketing expenses) / marketing expenses) * 100% |
What is a good open rate?
The average open rate is around 20%. However, this number can vary greatly depending on the size, quality, and activity of your subscriber base and how the contacts were collected, depending on the niche and type of business. A good open rate is one that meets the business objectives of the email campaign.
Read more about email marketing in our blog:
- How to Create a Customer Journey Map in Email Marketing
- The Creative Side of Retention Marketing: How to Create Inspired Emails that Captivate Your Subscribers
- How I Achieved a 39% Response Rate After Sending Cold Emails to 100 of the Most Influential Experts in B2B Sales
Conclusions
Metrics are used to evaluate the effectiveness of email newsletters, and these help analyze the quality of the emails and the email marketing methods. The main metrics include:
- inbox placement rate;
- bounce rate;
- open rate;
- click-through rate;
- click-through open rate;
- unsubscribe rate;
- spam complaint rate.
When analyzing the outcomes of email newsletters, the efficiency indicators of an email campaign for the reporting period are also considered. For this purpose, tools that measure site sessions, number of conversions, and ROMI are useful.
Related Articles
How to Set Up Consent Mode in GA4 on Your Website with Google Tag Manager
Let's explore how to properly integrate consent mode in GA4, configure it for effective data collection, and at the same time comply with GDPR and other legal regulations
Display Advertising Effectiveness Analysis: A Comprehensive Approach to Measuring Its Impact
In this article, I will explain why you shouldn’t underestimate display advertising and how to analyze its impact using Google Analytics 4
Generative Engine Optimization: What Businesses Get From Ranking in SearchGPT
Companies that master SearchGPT SEO and generative engine optimization will capture high-intent traffic from users seeking direct, authoritative answers


