How to Set Up End-to-End Analytics for a Leading Employment Agency in Europe
Period: July 1, 2022 – January 30, 2024
Region: Eastern Europe
Service: End-to-End Analytics
Project team: Ihor Pavlenko (Internet Marketer), Olha Hornostaieva (Web Analyst Team Lead), Oksana Demecheva (Project Manager), Oleksandr Konivnenko (Department Head).
Our client
In this project, our client was a leading recruitment agency that provides employment solutions for people from Ukraine and Eastern Europe for companies in Poland and the EU. It helps companies find employees for various sectors, including industry, logistics, and agriculture.
The challenge
Our client was actively attracting users through paid traffic channels, including Meta Ads and Google Ads. However, there was a problem: each tool produced separate reports that their employees had to combine manually. While the actual number of leads was only visible in the CRM system, the source of the leads was in Google Analytics 4 (GA4). To further complicate matters, the costs were in the advertising accounts.
Our task was to combine all sources into one automatic report to minimize the amount of manual work.
Stages of implementation
1. Tools and architecture development
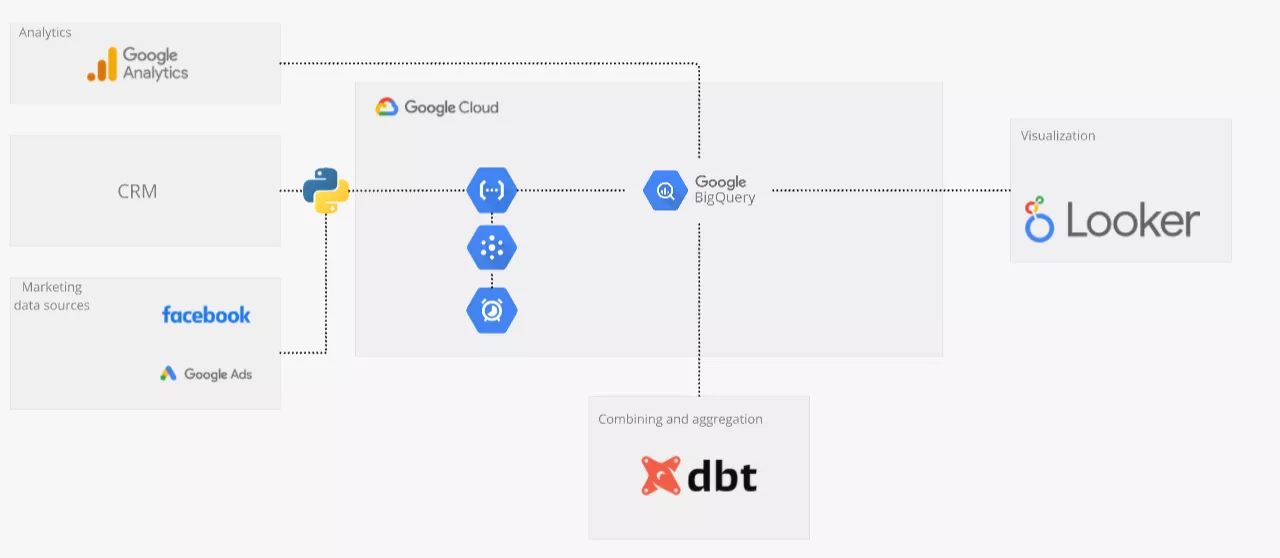
To build end-to-end analytics, we primarily used Google tools and services that allowed us to automate data collection, processing, and visualization. Here is a diagram of the solution architecture:
The solution is long-term and stable, and it is also cost-effective. Using all the tools in the Google Cloud infrastructure costs no more than five dollars per month for this amount of data..
2. Creating layouts
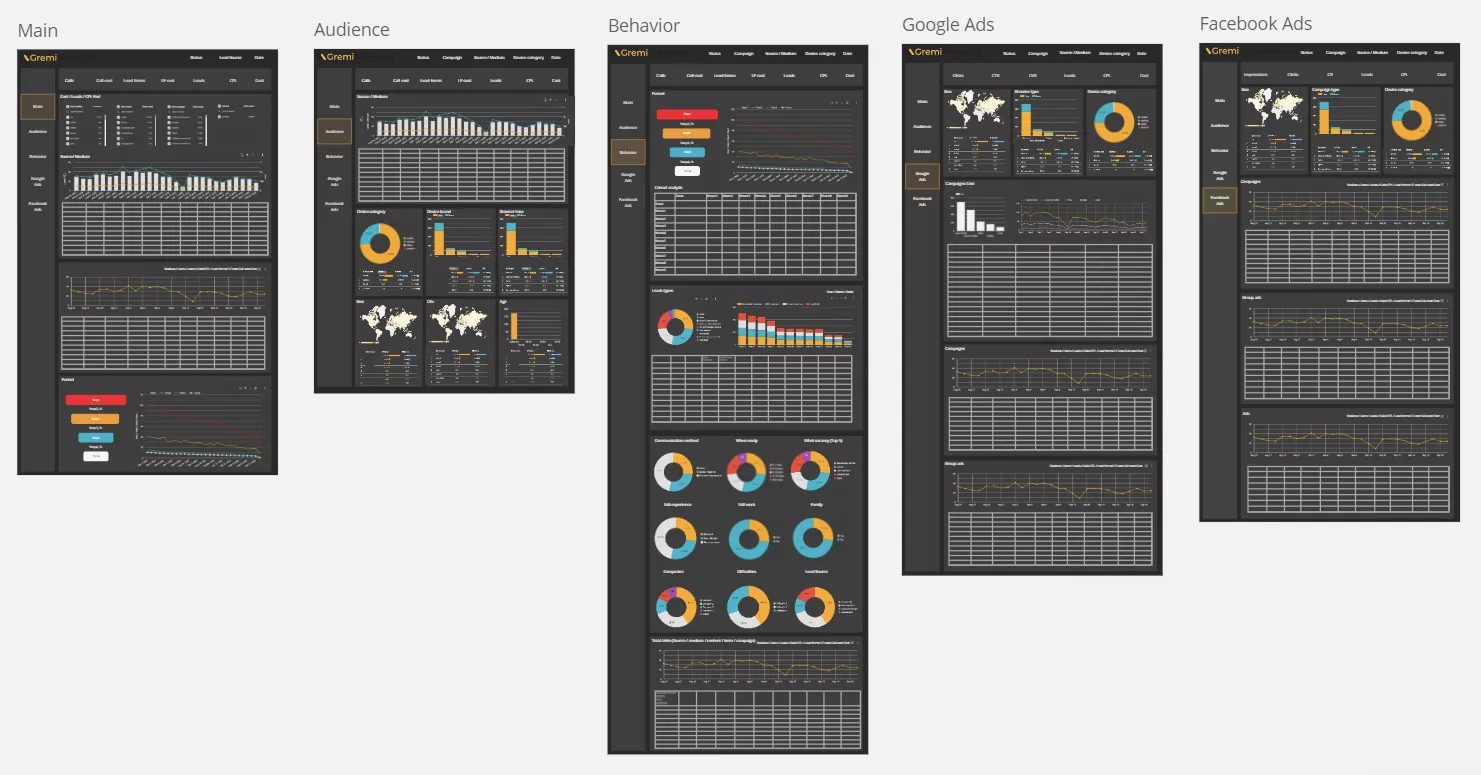
After receiving all the necessary information from the client, we created report layouts in Miro and got them approved before starting the main work. This helped us save time and avoid misunderstandings when further developing the dashboards.
3. Data storage and collection
We used Google BigQuery as our central storage method. This cloud-based database was built specifically for analytics, scales automatically, and requires no additional support. Google Analytics data is delivered there daily in its raw form, free of charge.
For advertising sources, we developed a special connector — a Python code hosted in Cloud Functions that automatically downloads data from Google Ads and Facebook daily.
Instead of a standard CRM system, the client used a task management system where leads are stored as individual tasks. The Python code on the system's server retrieves the necessary application and customer data daily, instantly formats it, and sends it to BigQuery.
4. Combining and aggregating
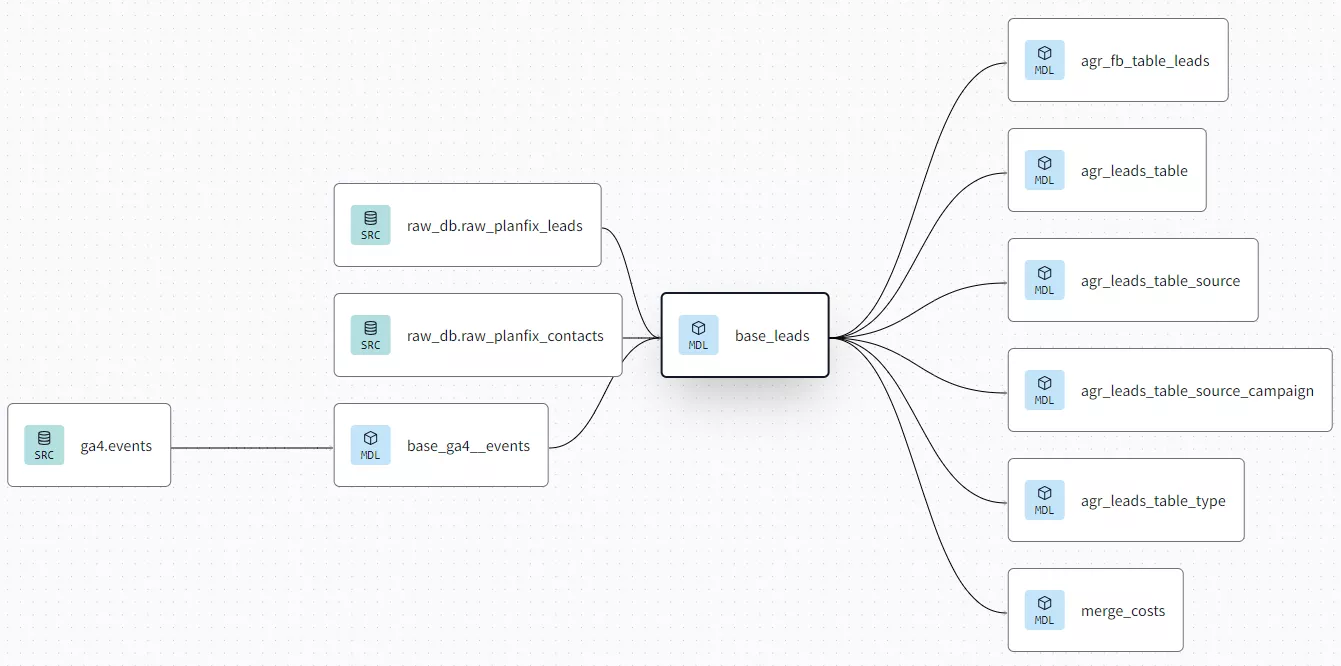
We used the DBT (data build tool) service, which allows you to effectively manage a project that contains many SQL scripts. DBT structures the SQL code, making the transformation and orchestration process much easier.
Orchestration is an automated process of building tables in a database according to a schedule and sequence. It reduces manual work and the risk of errors.
Using this service and the built SQL queries, we combined data from multiple sources, performed complex aggregations, and created unified data marts.
Data marts aggregate and transform data tables from multiple sources into a format that is easy to visualize.
At the aggregation stage, we also filtered out duplicate requests from the same customers.
The problem: Requests from the website arrived in GA4 without IDs, so it was difficult to combine data from GA4 with data from the CRM system. There was no way to implement ID transfer.
Our solution: We checked the delay (time interval) with which requests from the website arrive in the partner's system. The delay was up to 60 seconds. Based on this, we combined the requests by time. If a request from GA4 matched the time of a request from the system by up to 60 seconds, we assigned that request to the appropriate source.
To implement this process, we went back to the previous step and modified the connector for uploading data from the system, adding the date and exact time of the request to the transmitted data. This allowed us to understand the source and channel for more than 85% of the requests.
The rest of the requests could not be merged. Some were not captured by the analytics due to users' use of ad blockers, and some were not merged because the lag time for the requests was more than 60 seconds.
In the future, the customer plans to implement a new CRM system and will be able to send the application number to GA4, allowing more accurate data matching. At the current stage, the solution we created helped us work with the available data.
5. Visualization
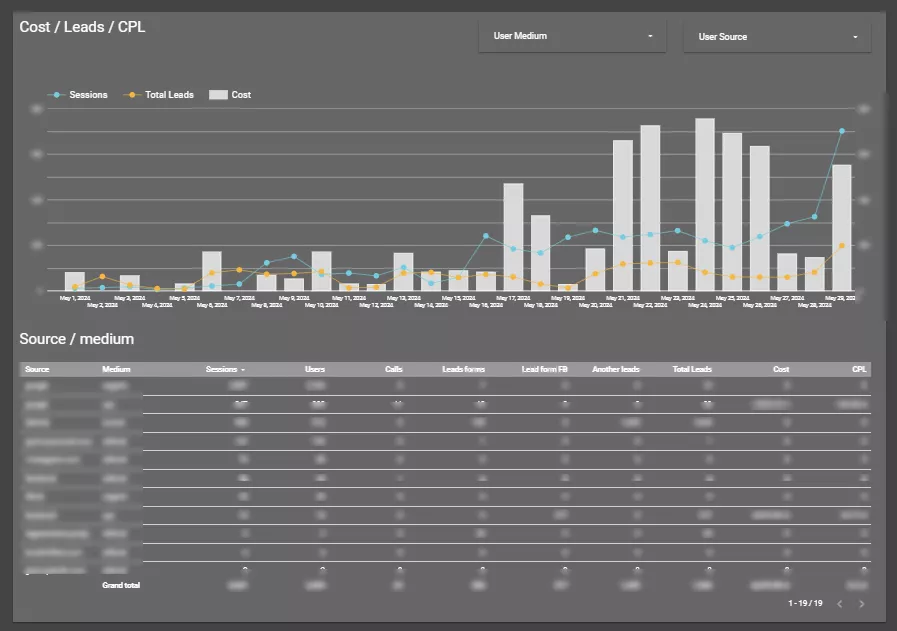
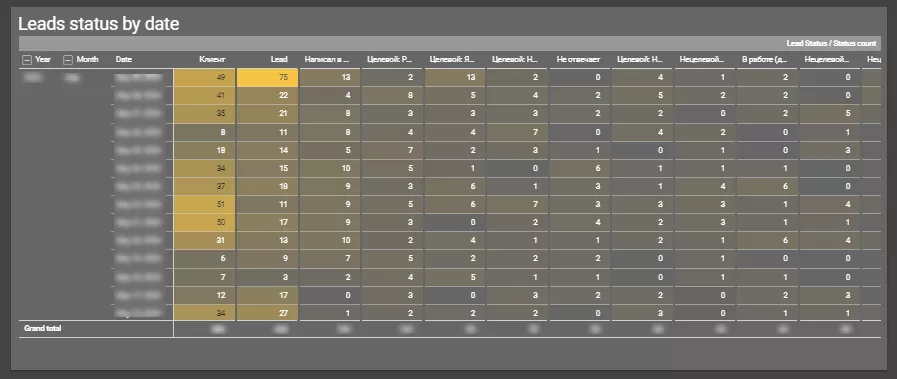
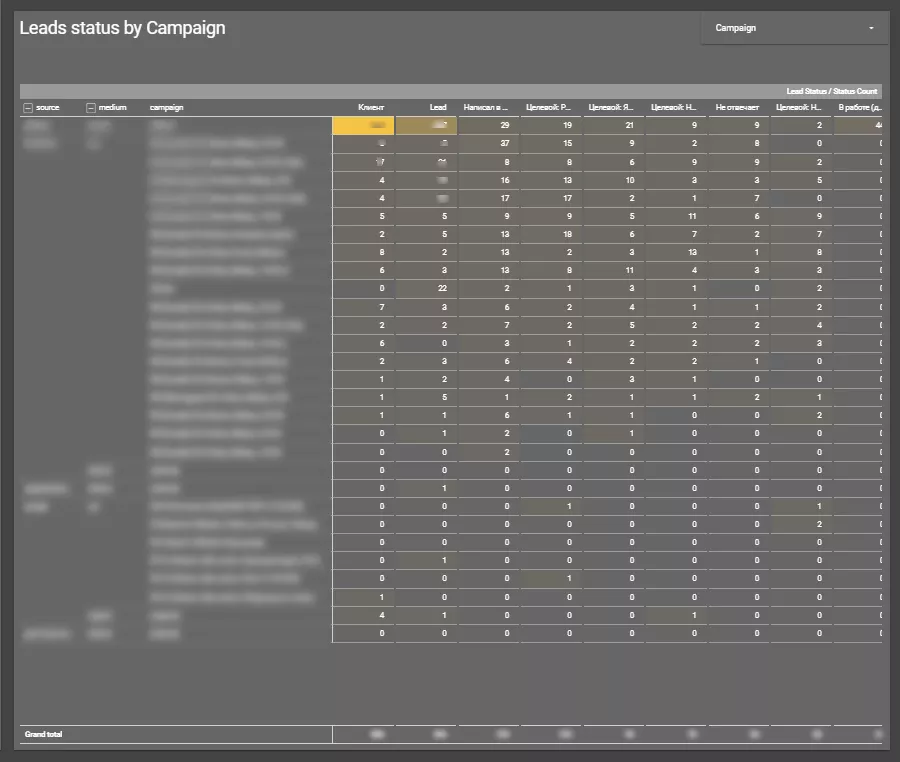
Finally, we connected the showcases to the Looker Studio visualizer, where we prepared the final dashboards. Here are some examples of the final dashboard:
Results
In this project, we created a single analytics system for the client that allows them to make quick marketing decisions and elevate the process of advertising optimization. The new analytics platform combines information from multiple sources: analytics systems, advertising accounts, and internal data. This allows the client to monitor the effectiveness of all channels, analyze costs and key performance indicators (KPIs), and optimize the budget by redirecting funds to more effective channels.
Conclusions
- The task was to combine separate reports from different tools (Google Ads, Meta Ads, Google Analytics 4, and task management systems) into one automated report that would minimize the manual effort required to create it.
- First, we used Google Cloud tools for data storage and processing to ensure stability and cost-effectiveness.
- We then wrote a Python code to automatically download data from the ad platforms and the partner's system.
- For data collection, we used the Google BigQuery cloud database, which automatically scales as needed.
- We also used DBT to manage SQL scripts and data transformation, which allowed us to effectively combine applications from different sources and filter out duplicates.
- We prepared the final dashboards in Looker Studio for easy and quick data analysis. To optimize the advertising budget, we introduced channel performance monitoring, cost analysis, and key performance indicators.
Recommended theme posts
Related Articles
How to Set Up Consent Mode in GA4 on Your Website with Google Tag Manager
Let's explore how to properly integrate consent mode in GA4, configure it for effective data collection, and at the same time comply with GDPR and other legal regulations
Display Advertising Effectiveness Analysis: A Comprehensive Approach to Measuring Its Impact
In this article, I will explain why you shouldn’t underestimate display advertising and how to analyze its impact using Google Analytics 4
Generative Engine Optimization: What Businesses Get From Ranking in SearchGPT
Companies that master SearchGPT SEO and generative engine optimization will capture high-intent traffic from users seeking direct, authoritative answers

