Do you want me to tell you what our employees are doing right now? They are collecting reports in spreadsheets. How much time they waste ignoring automation? It is quite simple to see the real picture: just calculate the number of person-hours spent on reporting and multiply the result on the average cost of an employee’s working hour.
In this post, I will tell you why is it important to implement BI business solution, what tasks are possible to be solved with the help of automatization and what Netpeak has received for developing its own BI solutions for the department of contextual advertising.
Business intelligence (BI) – methods and tools for transition of raw information into a meaningful, useful form. These data are used for business analysis. BI technologies process large amounts of unstructured data to find business strategic opportunities.

How much time did the implementation take?
Project realization – from setting up the tasks till its completion – took about 5 months.
What were we doing all this time?
1.Pre-project preparation
1.1. We identified the basic and additional objects of BI implementation.
1.2. We identified channels, through which we should receive necessary data. We have chosen Google AdWords, Google Analytics, and facebook as initial sources. These biggest part of the whole project budgets of our clients is spent on the current platforms. Moreover, the inside ERP has also become such data source, as well as the range of tables filled by our employees.
1.3. Based on the set targets, we have identified the list of reports, diagrams and filters, required for solving our business tasks.
1.4. We have elaborated the architecture of databases, where all information necessary for visualization will be kept.
1.5. We have chosen tools for project realization with minimum financial expenses.
2.Technical project implementation
2.1. We have studied documentation on working with API ad all previously chosen sources.
- Google Analytics – API documentation;
- Google AdWords – API documentation;
- Facebook – API documentation.
2.2. We have received access to API of all required sources.
2.3. We have written the function packages in R programming language for API’s work with Facebook – Rfacebookstat.
2.4. We have researched function packages for API’s work with Google Analytics and Google AdWords, and also for transferring financial data in one currency.
2.5. We have written scripts in programming language R for collecting and saving data from all sources in the database.
2.6. We have set up visualization of all reports and diagrams.
2.7. We have distinguished reports access levels for our employees.
So now – let’s move to the details.
How to define BI implementation objectives?
How to understand that your business needs BI, not a manual data collection and processing in the spreadsheets?
Analyze:
- How much time do you spend on manual data collection and manipulation;
- What are the exact tasks you want to solve using BI.
At the time of writing the article, Netpeak team has 30 contextual advertising specialists. Each of them regularly collects and analyzes data on different campaigns from various systems. In order to free up specialists’ time for data analysis and ad optimization, we decided to collect all necessary information “in a single tab”.
At Netpeak's department of contextual advertising, we have identified the following objectives:
- To control the basic effectiveness indicators of ad campaigns on all advertising platforms and all projects.
- To search for ways of scaling ad campaigns without losing effectiveness.
- To grow the budgets without ad effectiveness decrease.
- The general ad campaigns effectiveness growth on all projects.
How to define which tables and diagrams are necessary for reaching your goals?

That’s quite simple. When you have clearly formulated your objective, then the understanding of the type of required information and tis format comes to you automatically.
After consulting with specialists and department heads, we have defined the list of reports, diagrams and keywords on which employees of multiple campaigns are basing during the ad campaigns analysis and the manual – with evaluation of department’s effectiveness (the one that consists of more than 30 specialists).
As a result, we have described 60 visual elements and the series of filters (for convenient work with them).
How to find tools for project realization with minimal expenses?
When selecting the tools, it is highly recommended to ground on the viewpoint of a specialist that owns at least several BI platforms and databases, and also is able to work with big amounts of data.
One more guideline for BI platform selection is a Gartner Magic Quadrant for Business Intelligence and Analytics Platforms annual research.
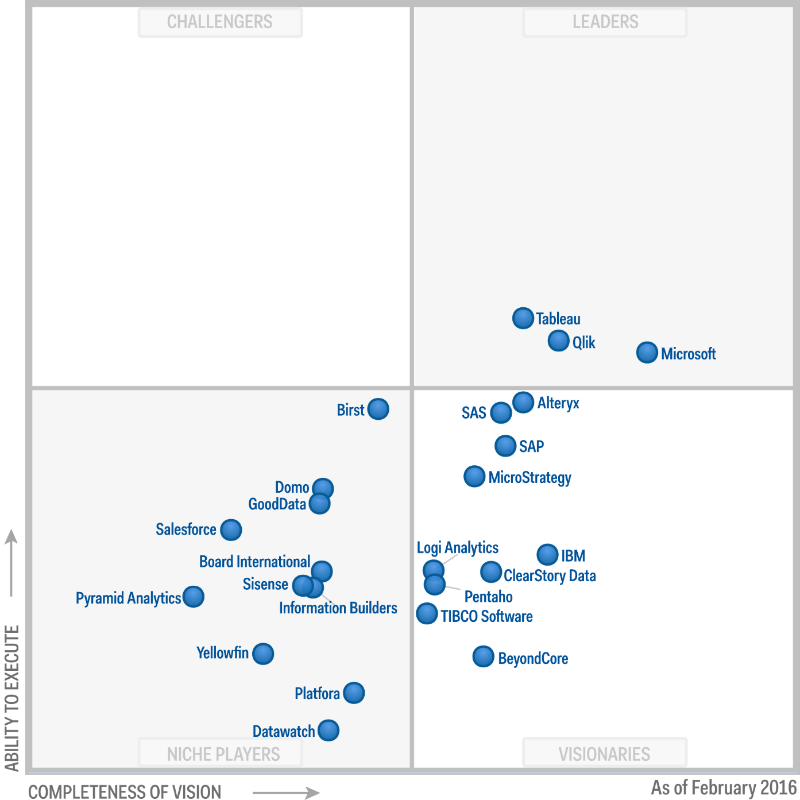
BI sphere leaders haven’t changed for quite a serious amount of time. It’s Microsoft (Power BI, Tableau Software (Tableau) and Qlik (QlikView, QlilSense). These are the decision worth paying attention to.
When selecting BI platform for solving the contextual task, take into account:
- From what sources you need to receive data for visualization;
- Whether you will need online access to the answers;
- What budget do you have.
I chose the following tools:
- Google Sheets – to save project reference information, and also information that companies type in manually. As a rule, these are small tables that consist maximum of several hundreds of lines. This tool is free and perfectly fits for collaborative work of employees in one document in online regime.
- Programming language R – to gather information from API of ad systems. This tool is also free of charge and is designed for quick processing of big data amounts.
- MySQL – DBMS for the storage of collected information that does not require any future changes. We recorded the aggregated data in the database, so that MySQL productivity is more than enough for accomplishment of our purposes. We receive nearly 300 000 lines of data every month – with the right database configuration and correct productivity tables indexing MySQL is more than enough is more than enough for processing the following data masses. As well as the previous tools, MySQL is 100% free.
- Microsoft Power BI – data visualization tool. The available functionality is enough for accomplishment of defined purposes. Moreover, Power BI for desktop computers is free of charge, while on line version will cost less than its main competitors (there is no necessity to purchase the server because all data is kept and processed through Microsoft servers).
Technical implementation of the project

Technical realization has to start with description of the process of data collecting, filtering, aggregation, storage and visualization.
To define the space required for data storage, you have to find out:
- How often do you need to update the reports;
- How much data have to be storaged;
- To what volume will the database grow within a year.
We collect data monthly, then our specialists optimize ad campaigns on the reports’ basis during the month. And in the following month we see information for its future optimization and scaling.
Work scheme
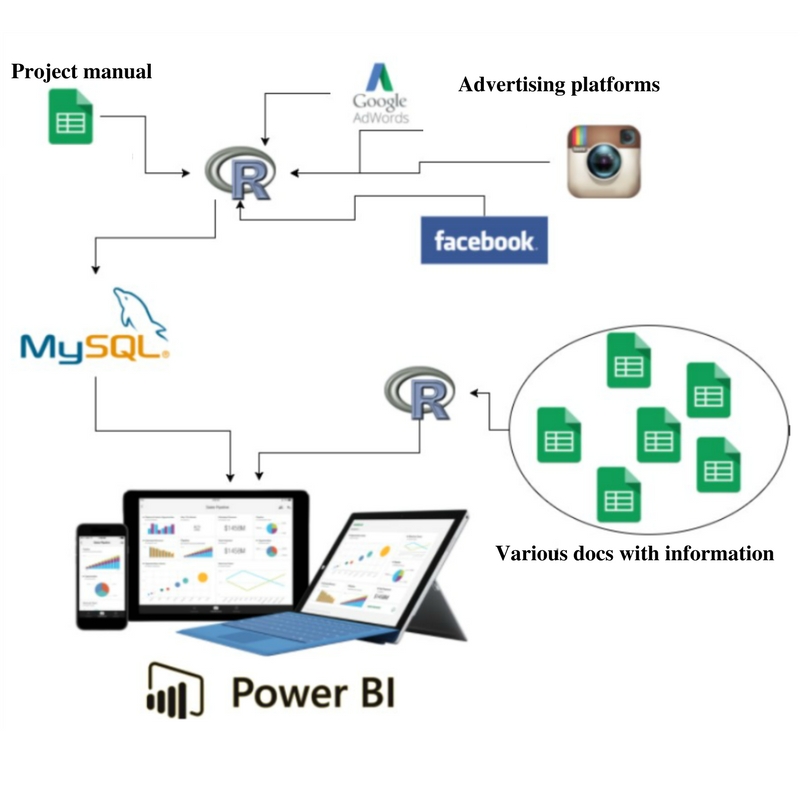
- All marketers monthly input data on their projects to Google Sheets. This is how we collect a manual that contains all necessary information for the scripts’ work.
- After actualizing the aforementioned manual, we implement R scripts that with the help of API from all ad platforms collect information, link it, aggregate and save to MySQL database.
- Within a month, company employees fill in the great variety of other documents in Google sheets: the ones with information on effectiveness rates, new and old projects, etc. All these documents are connected with POwer BI Desktop with the help of R connector.
- Once in a month after collecting all information for the previous month with the help of “Update” button, all reports and diagrams activize in Power BI Desktop interface.
- All data are published in Power BI Service for online accessibility to specialists, team leads and department heads.
How do contextual advertising specialists use BI solution?
Let’s start with the necessity to delimit the roles with Power BI. In this way, every employee has received the access to a particular dataset.
Department structure:
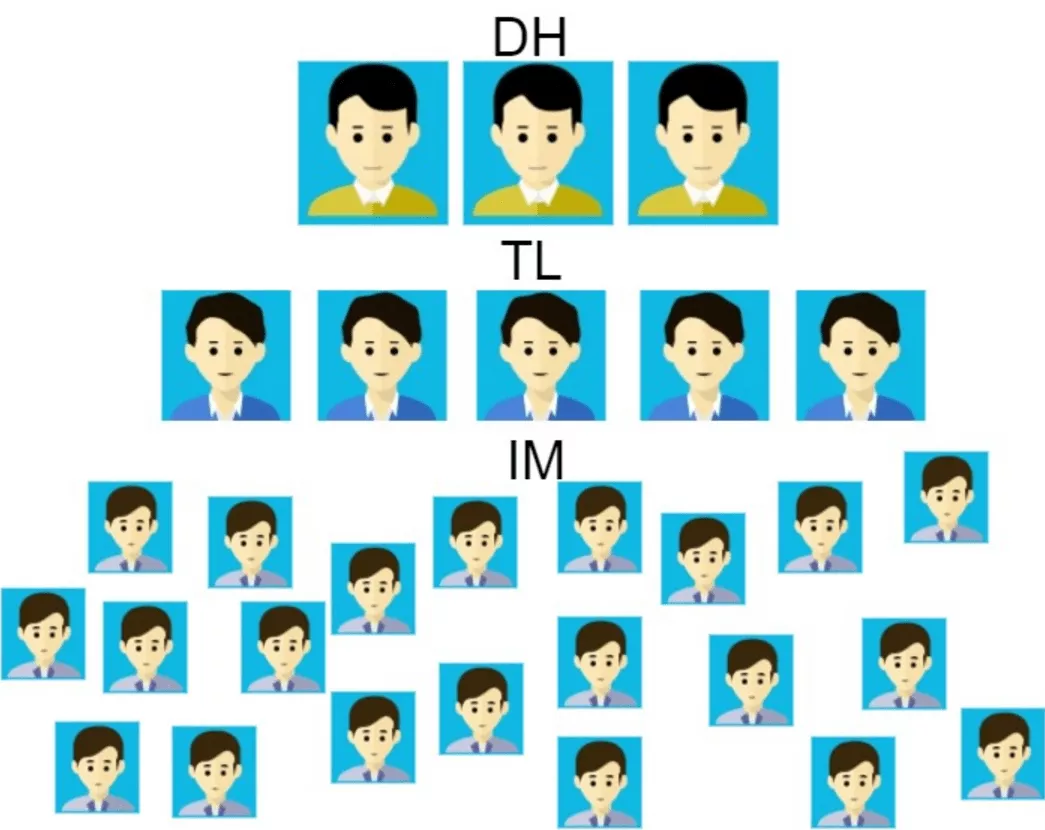
DH (Department Head) – governing body. Employees with the following access level see information on all projects, which helps them to manage department and operatively respond to the negative trend in the key indicators of the teams.
TL (Team Leaders) – team supervisors. They have access to information on the projects managed by specialists enrolled in their teams, but cannot see data on the projects of other teams.
IM (Internet marketer) – contextual advertising specialists. They have access to information on their projects only and cannot see data on the projects of other specialists.
We clearly distinguished the data access. Every employee received access to necessary information and can make decisions on his/her responsibility level.
In BI reports you can review the general information on KPI that has to be controlled by the department head and team leaders:
- Department efficiency;
- Specialists workload;
- Different project and specialist segmentation;
- The active projects and other numbers change dynamics.
Let’s review how specialists apply the developed tool when running ad campaigns in details.
-
General project analysis
The first table that specialist sees displays data on the amount of spent finances, the number of displays, clicks, CTR and cost per clicks in the project, source and traffic channel section.
The deeper analytics of each project starts with the aformentioned data. Specialist can switch to studying the diagrams that display volume of lost transactions, income and conversions, and on its basis it is possible to make conclusions on a separate project or advertising campaign.
-
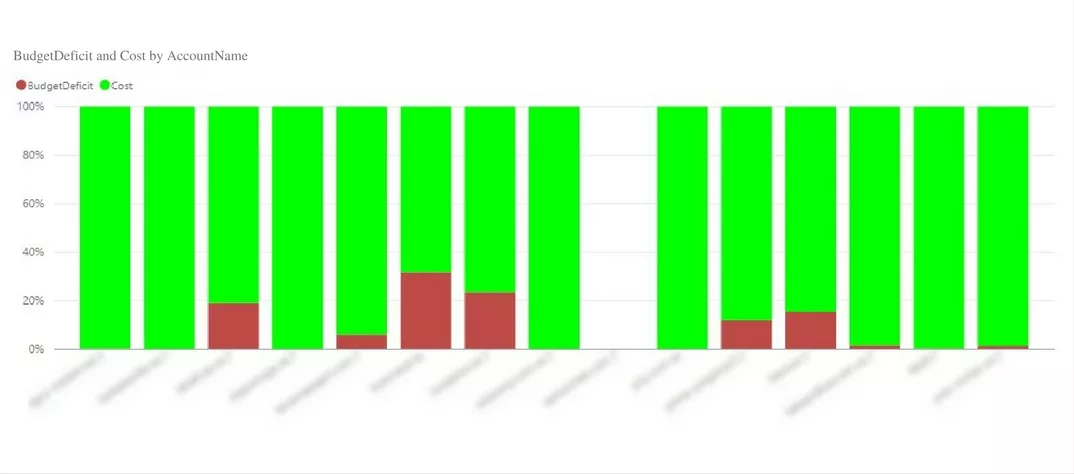
Lost income volume analysis
The volume of lost income is displayed on the diagram on the breakdown of budget losses and rates.
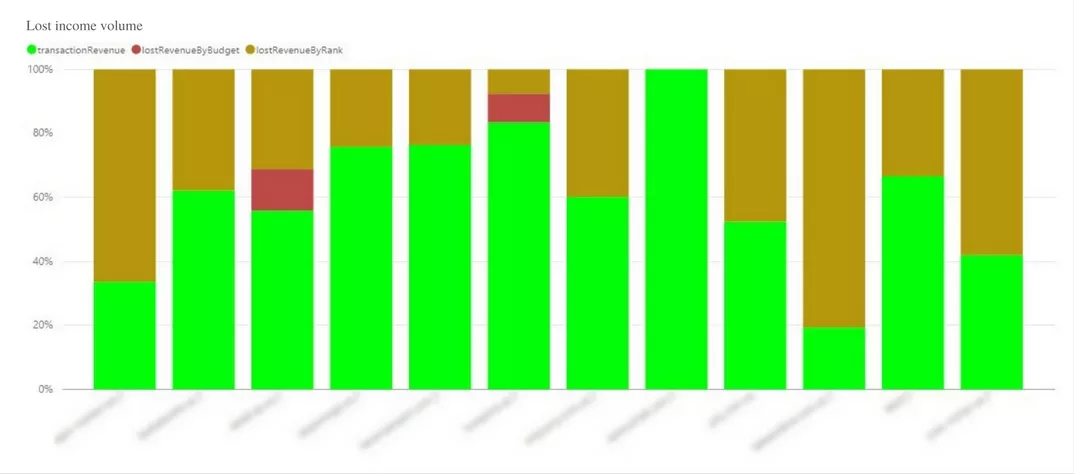
Specialist immediately sees:
- Projects and ad campaigns where it is possible to increase budget without losses of ad campaigns efficiency;
- Projects and ad campaigns within which it is necessary to pay attention to the efficiency indicator and lead cost to minimize losses connected with low ad rating.
Conversions lost due to the lack of budget can be analysed by specialist using special table. The current table has data on each project that show the amount of finances lacked for maximum possible outreach and the number of transactions lacked in this connection.
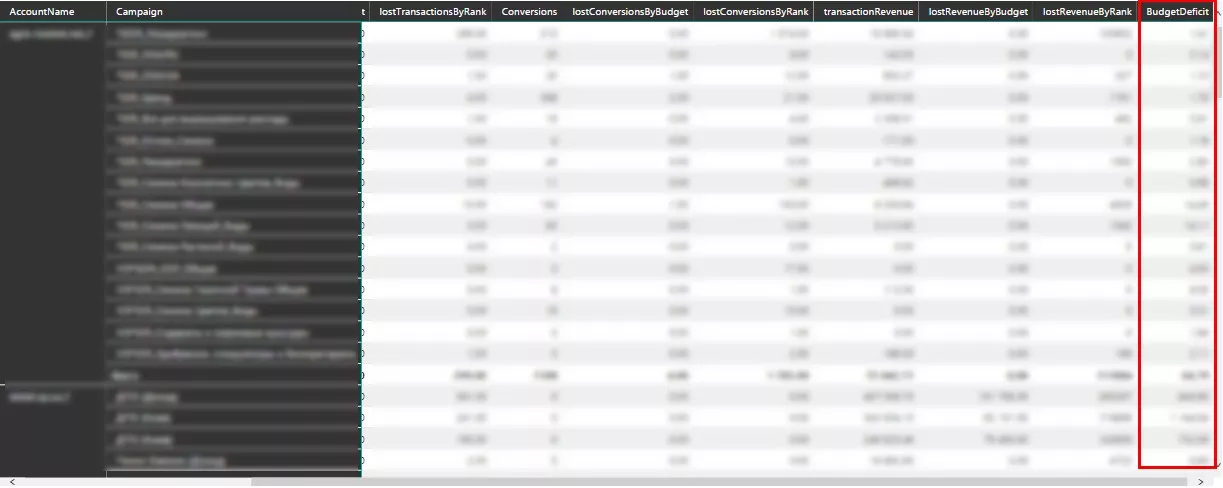
Moreover, specialists have access to traffic rates that display the budget proportion, which potentially could be spent without losing efficiency.
After looking through the aforementioned diagrams and reports, specialist can write a letter with recommendations for budget growth and add the income volume or the number of transactions and conversions that will be received as a result of budget growth. In this way specialist finds out in which projects and ad campaigns it is possible to grow the ad budget and add more profit to clients.
3. Analysis of lost conversions and connection with rate
Next step is minimizing revenue lost due to the low ad rates. In this case, there are two ways.
3.1. Increase keyword's quality score
In the first place, it is necessary to pay attention to the quality score because it will allow to optimize transaction cost.
To work with the quality score, specialist has six different programs.
First two diagrams show general information on quality score for projects. Moreover, it is possible to switch to the level of ad campaign or group of advertisements.
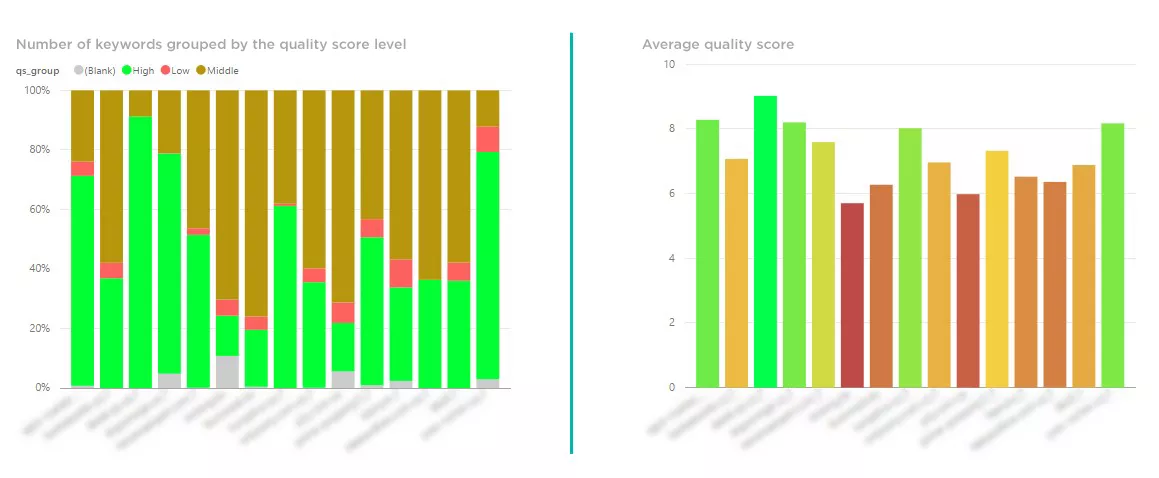
The diagram on the left divides all keywords within the account into three groups:
- High (marked in green) – keywords with high quality score, averaging from 8 to 10 points.
- Middle (marked in yellow) – keywords with middle quality score, averaging from 5 to 7 points.
- Low (marked in red) – keywords with quality score lower than 5 points.
The diagram on the right demonstrates the average account/ad campaign/ ad group quality score.
With the help of these diagrams specialist sees problematic accounts, ad campaigns, ad groups, and can quickly identify keywords that require optimization.
The following three diagrams show each quality score component in accounts, ad campaigns and ad groups sections.
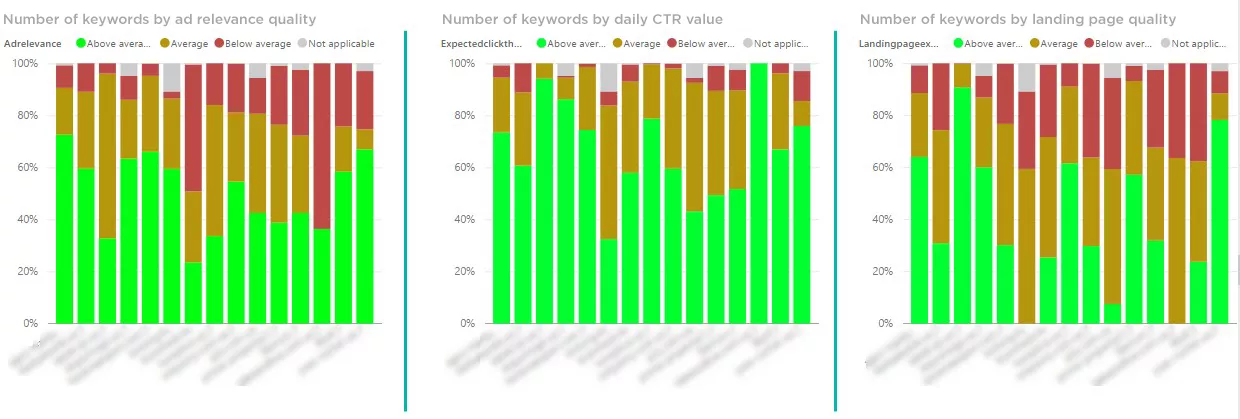
Within each graph you can see the ratio of keywords with different scores. Green color marks keywords with higher than the average score, yellow – with the middle score level, and red v with the score lower than the average level.
On the left diagram you can see keywords score based on the ad relevance. For the keys with low score level, specialist has to create advertisements that contain keywords in the headline and body part.
The central diagram reflects keywords score based on expected CTR value. This component affects quality score more than the others, although it is pretty hard to change its its value. In case there is a high proportion of advertisements with low expected CTR value in a group, specialist has to make all advertisements more noticeable and attractive: to check, whether ad extensions are activated, to elaborate a more creative approach to the texts themselves and ad headlines.
The diagram on the right shows the landing page quality assessment. In this case, specialists should try to change the landing page in the advertisement for the more relevant one make client recommendation to revise the text from the landing page to increase the frequency of keywords appearance.
After specialist has worked with the quality score and pulled it up to the maximum level, the cost per click decreases. Therefore, the number of clicks and transactions grows in the frames of a previous budget.
Transaction cost analysis
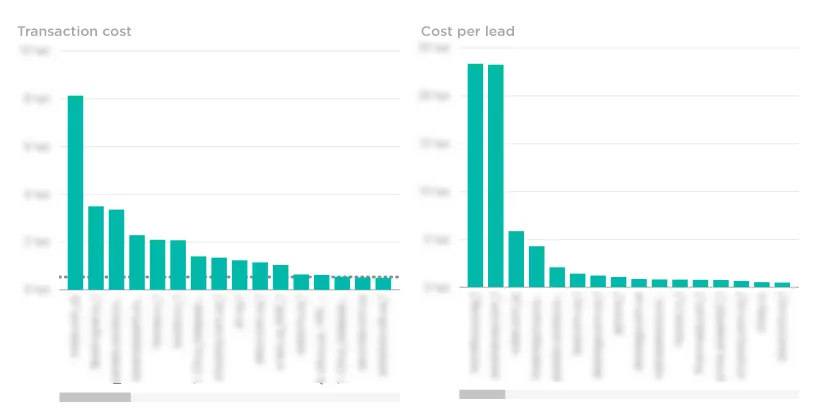
Within each project, specialist knows the valid conversion cost and can compare these data with lost conversions. In case the transaction cost is lower than the valid number and there are income losses due to the low rating,it is better to raise the bet. In this case, the number of lost auctions will fall down and specialist will be able to attract more interested users and , as a result – to grow profit.
4. Scaling campaigns
BI solution has been expanded with the series of reports on the click’s cots i Google AdWords in the the section of different subjects, cities and countries. Based on the current data, marketer can evaluate whether it is worthy to scale ad campaigns on concrete cities and regions and it as effective as possible depending on the opportunities and specifications of client’s business.
At the moment, we have access to the information on the click’s cost:
- In 188 countries;
- In 25,7 thousands cities;
- In division to 27 subjects.
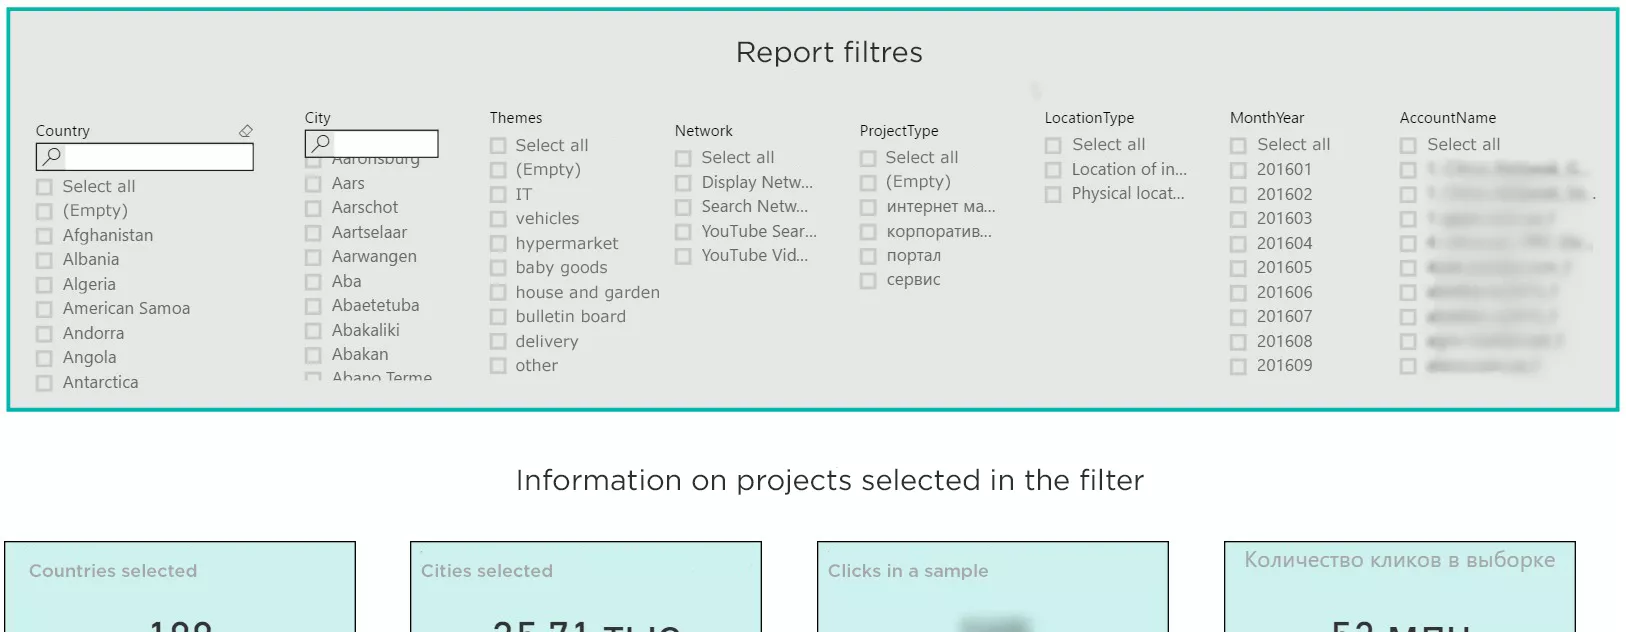
Moreover, the detailed report is available and the cost per click in division to subjects and countries in Facebook.
Conclusions
How we implemented BI analytics for contextual advertising department:
- Identified objectives, sources and list of reports required for solving business tasks.
- Developed database architecture and selected tools for project realization.
- Received access to API of all required sources and developed required functions packages in programming language R.
- Visualized Power BI reports.
- Distinguished accesses to data depending on the employee's role.
What was the result?
- Governing body:
- Controls implementation of KPI section;
- Receives data for projects distribution among specialists depending on their workload.
- Marketers on the basis of received data:
- Estimate the amount of lost revenue; analyze conversions lost due to the rating;
- Optimize ad campaigns and operatively define the growth zones;
- Scale ad campaigns, plugging in new sources and regions.
Follow our Case study rubric to be the first to find out what effect did BI analytics of contextual advertising department produced on business of our clients.

 3
3
 3
3
 0
0
Recommended theme posts
Related Articles
How to Set Up Consent Mode in GA4 on Your Website with Google Tag Manager
Let's explore how to properly integrate consent mode in GA4, configure it for effective data collection, and at the same time comply with GDPR and other legal regulations
Display Advertising Effectiveness Analysis: A Comprehensive Approach to Measuring Its Impact
In this article, I will explain why you shouldn’t underestimate display advertising and how to analyze its impact using Google Analytics 4
Generative Engine Optimization: What Businesses Get From Ranking in SearchGPT
Companies that master SearchGPT SEO and generative engine optimization will capture high-intent traffic from users seeking direct, authoritative answers