What errors you may face when working with Google Analytics and how to fix them
Analytics is a must in today’s business management. But how to deal with invalid statistics data?
In this article, I’ll run you through the technical issues which may arise when working with Google Analytics and show how to find the way out.
Invalid parameters in reports
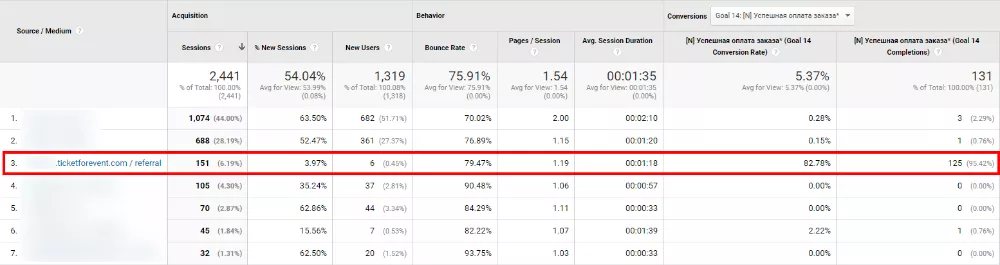
Referral traffic from the inappropriate sources
Sometimes you can find referral traffic from unexpected or unwanted sources in Google Analytics reports. For example:
- subdomains referrals: if you have different cross-domains, the statistics will show it the following way: sub.domain.com / referral;
- payment methods referrals: if orders are paid through the third-party payment processors (e.g., Liqpay), the reports will provide information on traffic and conversions which refer to … / referral;
- accounts.google.com referrals: this source you may see if your site supports authorization through a Google account. Once a user has logged in, the session will be overwritten, and the source/channel will be displayed as accounts.google.com / referral.
A significant amount of conversions may refer to such sources. While the real channels that drove this traffic will be estimated in the wrong way.
Referral exclusions may be of help here. I advise you to add this item to your analytics setup checklist to prevent decision-making based on inaccurate data.
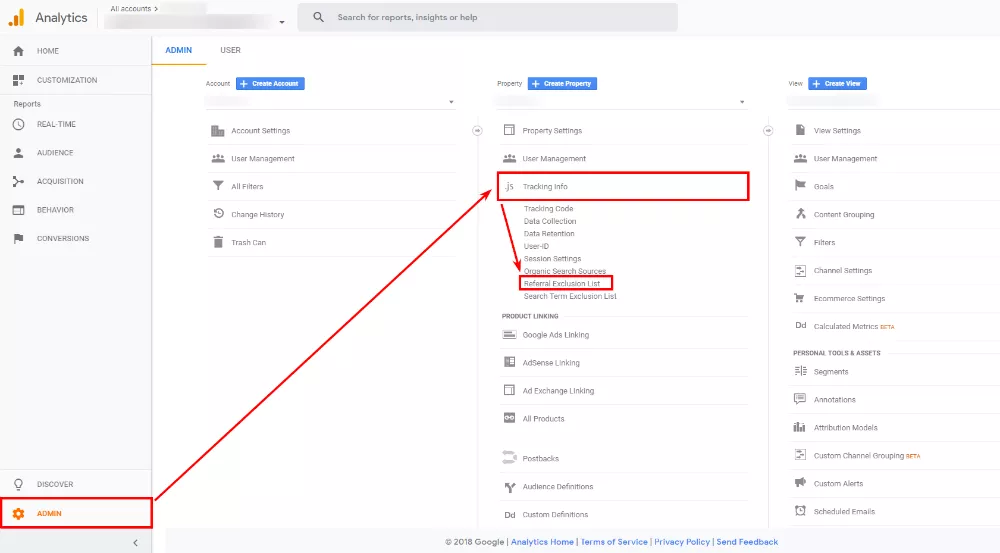
How to do it?
1. Sign in to your Google Analytics account
2. Click Admin
3. Go to “Tracking Info” section
4. Click on the «Referral exclusion list».
Add each domain you don’t want to see as a referral source in reports:
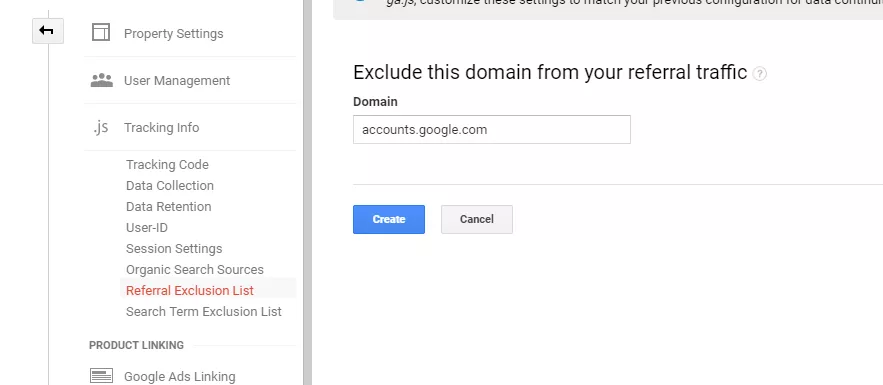
A little heads up: this setting is relevant for analytics.js and gtag.js codes only.
If you use ga.js on your site, set up the required parameters in the code.

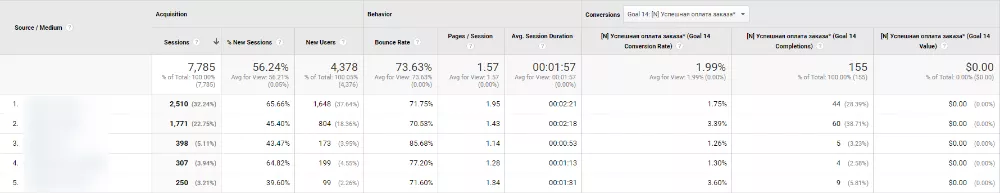
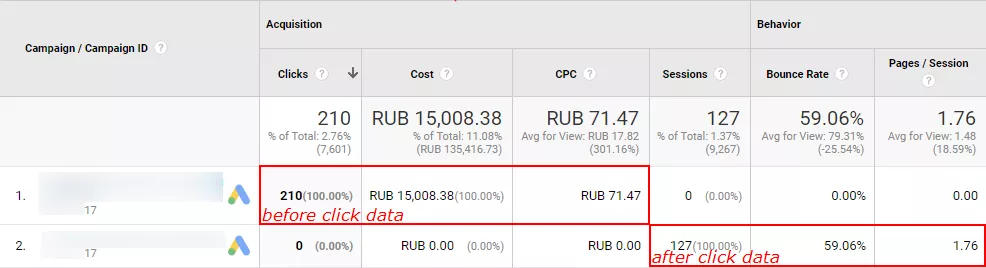
Once you configure this setting, the session will no longer terminate, and the conversion will be assigned to the correct source according to the “Last non-direct click” model.
Before:
After:

(not set) and (not provided) values in Google Analytics reports
This issue is discussed in many articles, information on it is provided in the Analytics help center. For a deeper insight, I suggest reading a Lunametrics article or an article written by Paul Koks.
In a few words: Google Analytics may hide part of the data due to confidentiality — this is how the (not provided) value appears. SEO experts often face it when analyzing search queries, most of which are encrypted by Google Analytics.
1. Google Ads and Google Analytics accounts are not linked, or you set them up the wrong way.
2. UTM tag issues:
- disabled auto-tagging in Google Ads;
- syntax errors manual tagging;
- invalid use of mixed link tagging.
3. Redirects — if you specified a link with a redirect on the landing page, all data about previous actions will be lost, and the session will get (not set) value.
4. Site features — e.g., parameters are lowercased or a tag is cut off — such nuances may cause incorrect transfer (or complete loss) of the gclid parameter or manual tags.
5. Google may receive insufficient data on some search or advertising systems, so such traffic remains unmarked or is considered as a referral.
6. The end of the session at midnight is a default setting; once the session ends, it will be overwritten. This may lead to significant deviations in the number of sessions and their sources.
As to paragraphs 1 and 2, we will tell about them later, in the “Advertising systems data issues” section.
As to paragraph 3: you can check landing pages and the site for redirects using either browser extensions or special software, for example, Netpeak Checker.
As to paragraph 4: in order to check whether the tag and case are applied to your site, type the address of the site with a test tag that will contain characters of a different type and case in the browser line:
site.com/?utm_source=teST_21If characters lowercase or disappear after you follow such a link (/?utm_source=test_21), contact your developer.
As to paragraphs 5 and 6, these features are inside the Google Analytics itself, so you can’t avoid them but may consider when making the analysis.
Sampling
According to Google Analytics, sampling is the practice of analyzing a subset of all data in order to uncover the meaningful information in the larger data set.
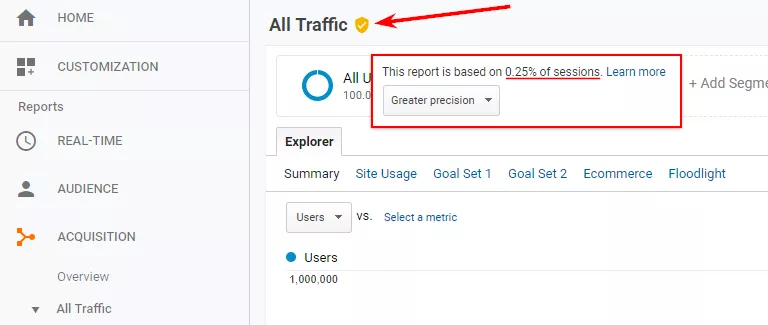
What actually happens: if there is a large amount of statistics (more than 500,000 sessions per resource), Google Analytics takes only some of the original data and multiplies it by N times up to 100%.
However, the reliability of such information is doubtful.
How to avoid sampling?
- use shorter intervals in reports: build monthly reports rather than annual ones and analyze them separately (this option is absolutely inconvenient and is suitable only for simple and one-time analysis);
- use reports without customization, segmentation, and filters — the more metrics and conditions you set, the more difficult the reports building process will be;
- create separate properties for different sources (mind that it will be difficult to bring such data together);
- upload data to Google Spreadsheets using add-ons, for example, “Google Analytics Add-on” or “Supermetrics” — although information will be sampled anyway, tables will simplify the process of uploading data for small periods (see paragraph 1);
- use Google Marketing Platform (it has some limits as well);
use external databases: for example, upload data to BigQuery or Power BI using R.
Advertising systems data issues
Linking with Google Ads
If there are errors in the linking settings of Google Analytics + Google Ads, this may lead to serious data discrepancies. Inaccurate statistics may become a reason for false conclusions and ineffective decision-making.
Problems and solutions
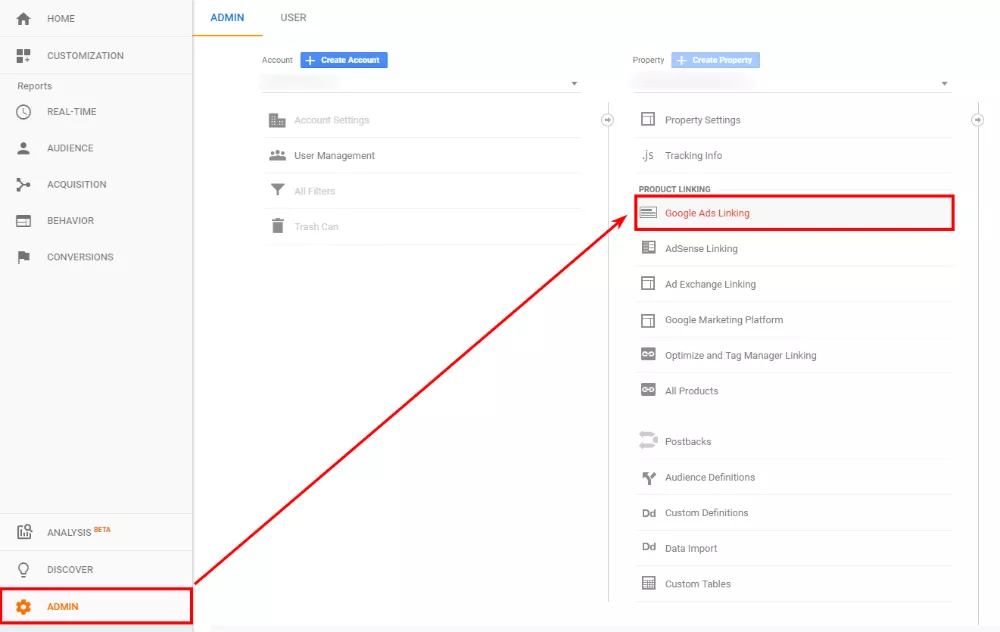
1. Google Ads and Google Analytics are not linked.
In Google Analytics, go to the “Administrator” section - “Property” - “Google Ads linking”:
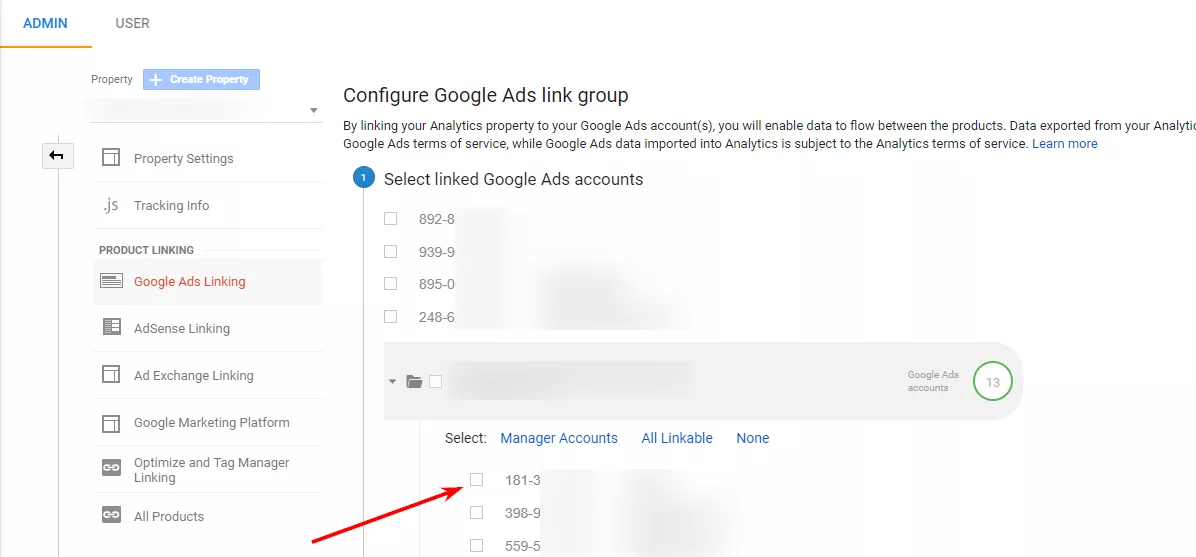
Choose the required advertising account:
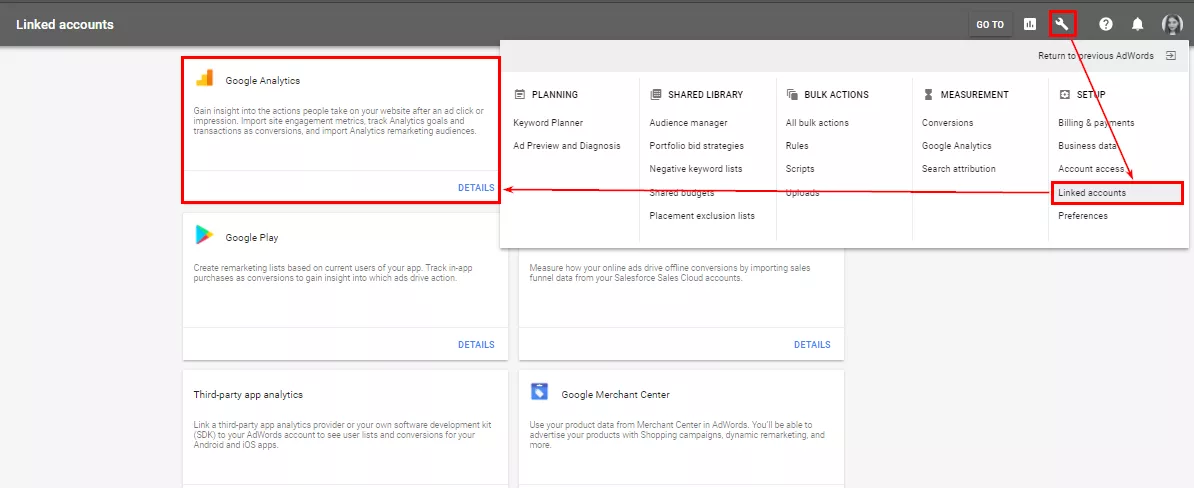
The other way to link accounts is Google Ads: go to “Settings” — “Linked accounts” — “Google Analytics”.
2. Google Ads auto-tagging is disabled.
It can be enabled in the “Account settings”. All you need is to mark a checkbox in the “Auto-tagging” field.
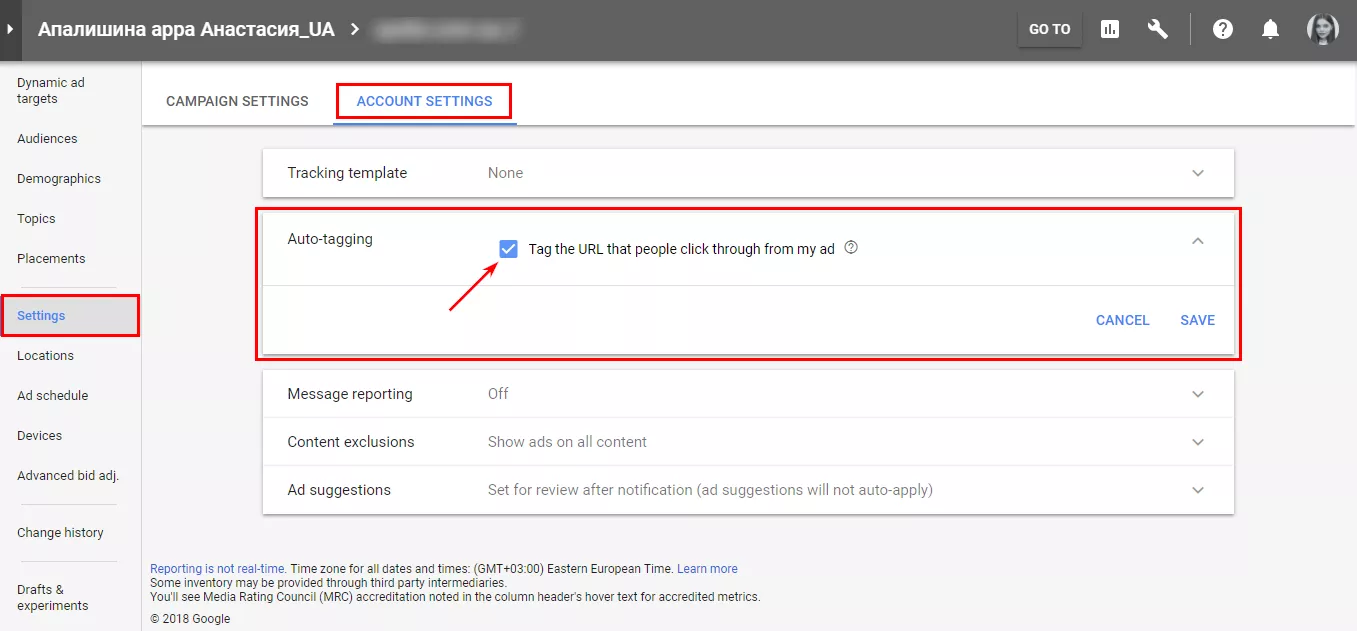
3. Invalid use of mixed tags — both automatic and manual.
If you need to set some parameters manually, mark the corresponding checkbox in the Google Analytics “Property Settings” section:
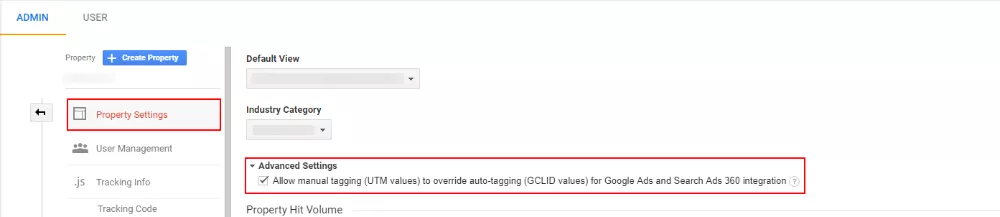
But be careful when filling in the tags. If you set an ad campaign value that differs from its name in Google Ads, your data in Analytics will not coincide.
If linking of Google products is invalid, (not set) value may appear in the Analytics reports. This problem will be revealed in the next section.
Visualization
Everyone who works with Google Analytics knows that the charting possibilities are highly limited there. To solve this problem, I suggest you using external tools.
One of the best options is DataStudio. It provides many data sources, a variety of table, graph and chart types, as well as the capacity to calculate your metrics. At the same time, the tool is free and simple to use.
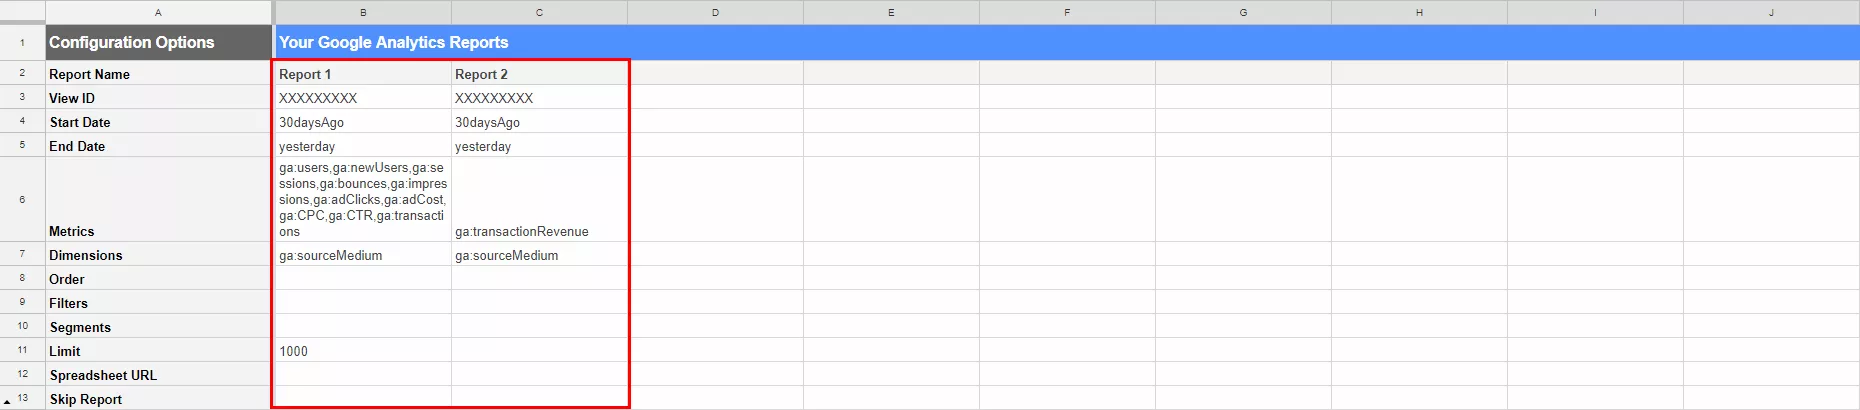
A limited number of columns and metrics in custom reports
When creating custom reports in Google Analytics, you can’t add more than ten metrics to one tab.

And very often it’s not enough. The way out is parsing data into tables.
This is when Google Analytics add-on for Google Sheets comes in. With this add-on, you can parse the data in the table and adjust it to your needs.

Google Analytics still doesn’t allow more than 10 metrics.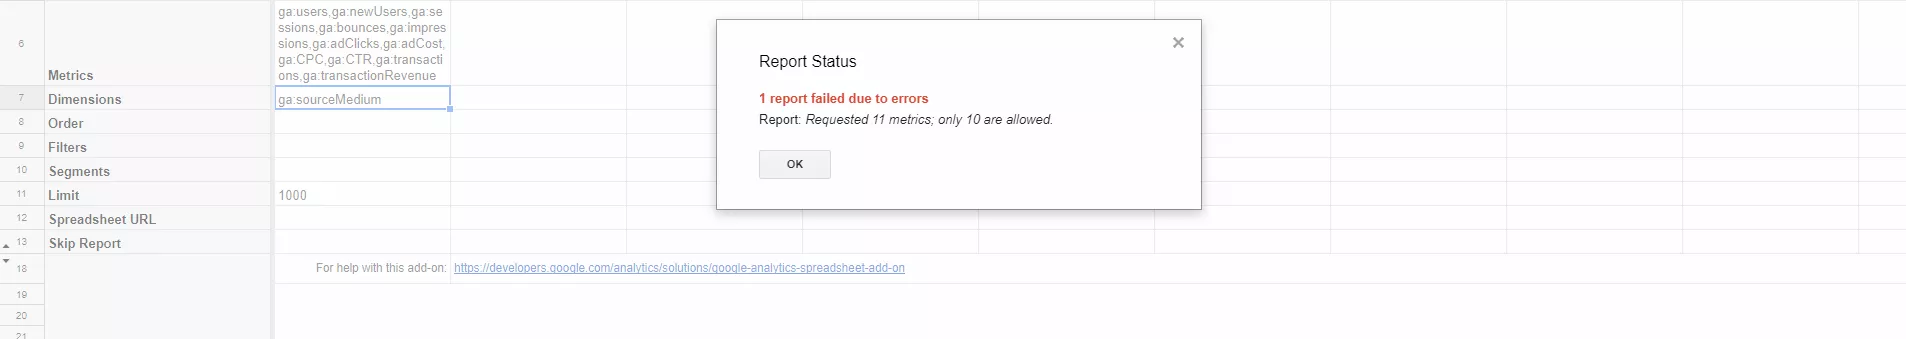
But you can break the required number of metrics into several queries. The add-on will create several data sheets. And you can make a general table with this data on a separate sheet.
Besides, you can create columns for calculating your metrics of any complexity and in any quantity with the help of functions right in the table:
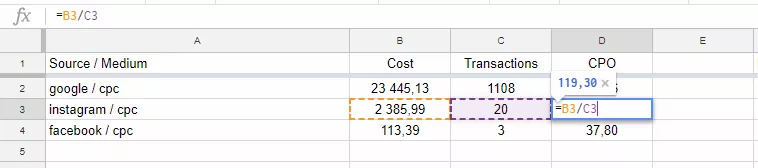
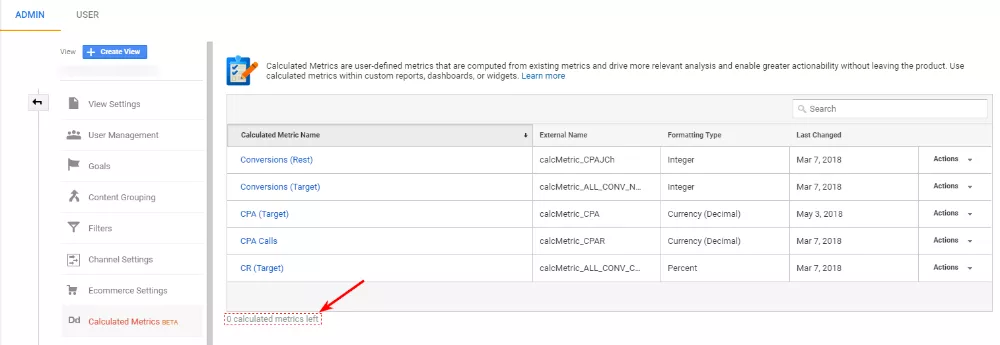
This is how you may avoid Google Analytics restrictions on the number of “Calculated metrics” — there can be a maximum of five of them in the basic version.
Problems with target quality and ROMI calculation
Repeat transactions
The main reason for which data on transactions in Google Analytics can be multiplied by two is the capacity to update the “Thank you” page. Also, the problem may be caused by the wrong implementation of e-commerce.
To solve the problem, find its reason. Then follow these steps:
- fix the implementation of e-commerce codes;
- set them up using GTM (for detailed instructions, read the OWOX blog);
- change the working algorithm of the “Thank you” page to avoid its refreshing;
- do not add the e-commerce “Purchase” code to the site and transfer transaction data from CRM using the Measurement Protocol.
By the way, this approach is one of the most reliable ones, it will help you build an end-to-end analytics system. Therefore, we will pay special attention to it in the next paragraph of this section.
Let’s proceed with detecting repeat transactions. To do this, build a custom report in Google Analytics:
![]()
If properly implemented, the number of transactions for each metrics will be equal to 1.
![]()
If the data on a single transaction is repeated several times, you will see the following result:
![]()
Data transfer from CRM (Measurement Protocol)
This is not a problem but a solution. The problem is the insufficient data on leads/sales that occur at the next stages of the funnel outside the site.
It causes the following limitations and errors in analysis and optimization:
- missing data about transactions made not through the website but, for example, by telephone, offline, etc.;
- invalid data on transactions due to the insufficient data on canceled transactions and returns;
- missing data about LTV (Lifetime Value), etc.
Solution: building an end-to-end analytics system in one of the available ways.
You can use ready-made solutions, for example, the Roistat end-to-end analytics system, or you can build your own end-to-end analytics. The choice depends on your resources.
Transferring prime cost data
If you decide to build your analytics system in Google Analytics, consider the prime cost of goods. This will allow you to calculate performance up to ROMI (return on marketing investment) directly in Google Analytics.
There are two ways to import goods costs to Google Analytics:
- manual — importing data by downloading a file manually;
- automated — transferring costs through the Data Layer.
Conclusions
When working with Google Analytics, any user may face a number of questions or problems. But any problem has a solution:
- To prevent problems due to errors in tracking setup, carefully read the technical documentation and Google help, make clear technical tasks for developers.
- To avoid sampling, resort to data export to external storage systems and analytics.
Be one step ahead: check your site for redirects in advance, save tags in links, repeat transactions.
- The limitations of Google Analytics are not a sentence. Visualize in DataStudio. Store data in BigQuery. Any problem has a solution.
Build a system of end-to-end analytics and calculate ROMI.

 7
7
 2
2
 5
5
Recommended theme posts
Related Articles
How to Set Up Consent Mode in GA4 on Your Website with Google Tag Manager
Let's explore how to properly integrate consent mode in GA4, configure it for effective data collection, and at the same time comply with GDPR and other legal regulations
Display Advertising Effectiveness Analysis: A Comprehensive Approach to Measuring Its Impact
In this article, I will explain why you shouldn’t underestimate display advertising and how to analyze its impact using Google Analytics 4
Generative Engine Optimization: What Businesses Get From Ranking in SearchGPT
Companies that master SearchGPT SEO and generative engine optimization will capture high-intent traffic from users seeking direct, authoritative answers