RFM analysis is a marketing analysis technique used to segment customers based on their behavior. It uses a customer’s transaction history or other measurable interactions to estimate their value to a business. The information gathered by this method will help you identify which customers bring more value and which bring less.
Based on this data, you can direct marketing activities to retain loyal customers and increase their profits. Also, once you have identified the segment of less loyal customers, you can direct marketing efforts to purposefully understand and meet their needs, thus increasing the number of loyal contacts.
The benefits of RFM analysis
One of the main benefits of RFM is that its requirements are simple. All you need is information about the purchases or activities you want to analyze. You'll get the desired data by matching the activity's frequency and time.
Here is what the acronym RFM stands for:
- Recency refers to how recent a customer's last purchase was. Recent buyers are considered more active and valuable.
- Frequency is how often the customer makes purchases. Those who buy more often are considered to be more valuable.
- Monetary (average order value) is an average return on action. Customers who spend more money are considered more valuable. The average order value is calculated by dividing the amount of all purchases by the number of purchases (F).
Recency and frequency are variable parameters that can be modified depending on the segmentation goals.
For example, a marketer may be interested in how long ago a newsletter was last opened and the frequency of openings in general. This allows them to identify the segment of people who open emails frequently and those who rarely open emails. Once the right segment has been identified, activities can be targeted to reactivate contacts who have not read emails for a long time and to re-engage inactive subscribers.
Those who continue to ignore the emails should be removed from the database to avoid wasting the marketing budget on them.
You can do the same with customers who haven't bought anything.
Another big advantage of RFM analysis is that you can analyze only the two metrics you are most interested in. RF analysis is often used in segmentation, where recency (R) and frequency (F) are considered. The average order value (M) is not considered because it often depends on the frequency of purchases (F).
The abbreviation also indicates the degree of importance of each variable: from Recency (R), the most important, to Monetary (M), the least important.
For many companies, the monetary parameter is not so important or does not have a specific applied value for the current task. These types of companies do not use the M indicator and only focus on RF analysis.
For example, when sending informational email newsletters for a marketplace, the frequency at which emails are opened and how long ago they were opened is important. This data is used to create segments. In this case, the monetary parameter is of little practical use, as we do not need direct sales, but rather, we are aiming to improve open and conversion rates.
However, if you send promotional mailings, for example, to an electronics store, you may need the Average Order Value parameter: it can encourage customers to return and make repeat purchases. As you can see, even for the same channel, different segments of analysis are used depending on the goals.
What is the purpose of RFM analysis?
The RFM analysis is used by companies that want to improve the marketing effectiveness of their email lists and increase profits. In particular, the method is useful for:
- Marketing campaign optimization. It helps you understand which customers are valuable, how often they shop, and how much they spend. This allows you to target marketing campaigns to specific user groups, optimize budgets, and improve audience effectiveness.
- Customer retention. Using RFM analysis, you can identify customers about to leave and offer personalized services or discounts to retain them.
- Customer loyalty enhancement. The segmentation created by RFM analysis allows you to measure the number of loyal and disloyal customers. This allows you to target loyalty-focused marketing efforts to specific segments and measure the effectiveness of those efforts.
- Assortment optimization. RFM helps identify the products or services that are most popular with customers. This, in turn, helps optimize operations, and production and scaling efforts can be directed toward the most profitable company’s products and services.
What are the disadvantages of RFM analysis?
- Only three specific parameters. The restricted number of parameters limits the analysis. Other factors, such as age, geography, and social status, are not considered.
- Insufficient accounting of customer activity. RFM does not consider certain types of activities, such as comments, recommendations, and reviews.
- If the data is mixed, it is difficult to determine the boundaries between segments.
- Additional analysis may be needed. RFM customer analysis provides a general overview of a business's customers. It may not be sufficient for companies looking to gain a deeper understanding.
- Regular updates are needed. The classification of buyers should be done regularly, as their parameters will change over time.
What audience do you get?
The audience obtained from RFM analysis depends on the criteria chosen. Customers are usually divided into several groups, depending on their behavior and value:
- VIPs or Tops are a group of frequent shoppers, high spenders, and recent shoppers. They are usually your most valuable customers. Offer them special discounts and loyalty programs to retain them.
- New are those who have recently made a purchase. Their total amount spent is not very high, but they have purchased your product or service for the first time. These customers are potentially promising for the company, and marketing efforts can be directed at retaining and turning them into regular customers.
- Sleepers are users who have not taken any action for a long time but were active in the past and have spent a lot of money before. These customers are potentially valuable, so it's worth targeting them with marketing activities to move them to the VIP category.
- Lost customers are a group of customers who have not interacted with your company’s offerings for a long time and whose total purchases are low. Try to win them back with discounts or other attractive offers.
The resulting groups help companies effectively target their marketing efforts by providing the most successful offer for each segment, which helps win back and retain users.
Example of segmentation
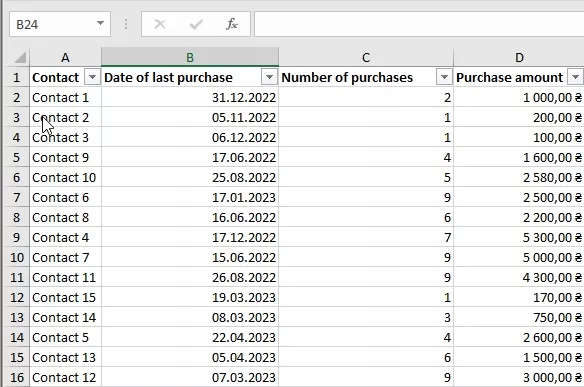
Several tools are available to conduct the RFM analysis, which I will discuss later. In this section, I will conduct an example RFM analysis in an Excel table for clarity.
In this example, I had a certain list of contacts with information about the last purchase date, the number of purchases, and the total amount. I derived the R, F, and M segments based on this data.
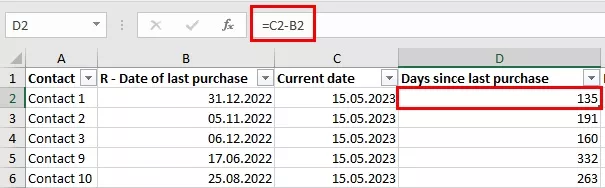
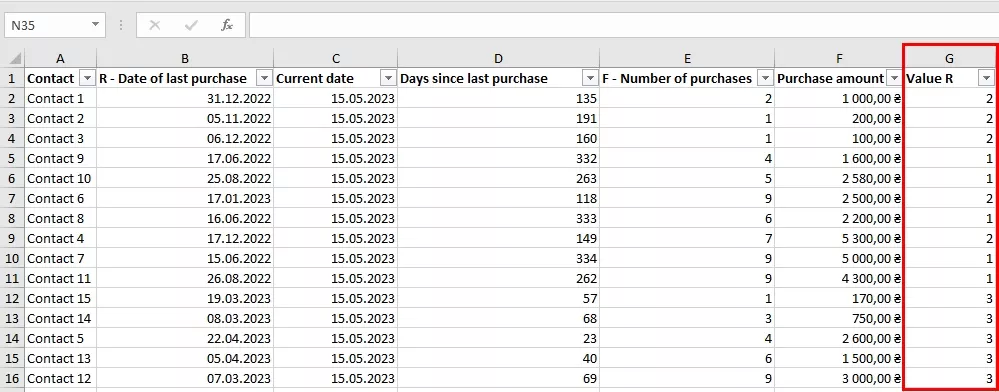
First, I calculate the number of days since the last purchase. I then subtract the date of the last purchase from the current date.
Next, we need to divide customers into three groups, assigning them a value of 1, 2, or 3 depending on how long ago they purchased. I calculate the maximum number of days from the date of the last purchase, based on which I will form the groups. I use the function "PERCENTILE.INC"; it sums the values and returns a number that falls within the specified percentage range. As I'm only looking for three groups, I need to divide the average number of days since the last order into three equal parts to assign a value: 33% for value 3, 66% for value 2, and the remainder for value 1.
For example, to find the 33% who bought the least number of days ago, I use the formula: =PERCENTILE.INC(D2:D16;0.33).
D2; D16 is the range of cells I'm counting from, and 0.33 is 33%.
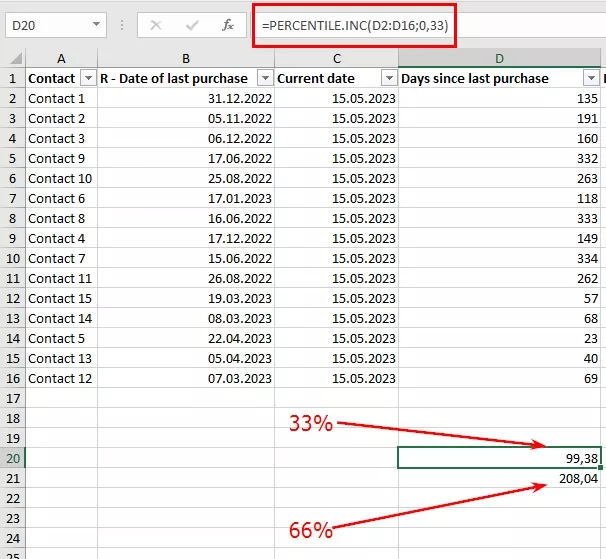
I now have three groups: those who ordered at most 99 days ago (the best customers), those who ordered from 99 to 208 days ago (average customers), and the third group, those who last ordered over 208 days ago (the worst).
Then, I calculate which group each contact belongs to by applying the following condition: if D2 is less than 99, assign a value of 3; if D2 is less than 208, assign a value of 2; otherwise, assign a value of 1.
The example formula looks as follows: =IF(D2<99;3;IF(D2<208;2;1)).
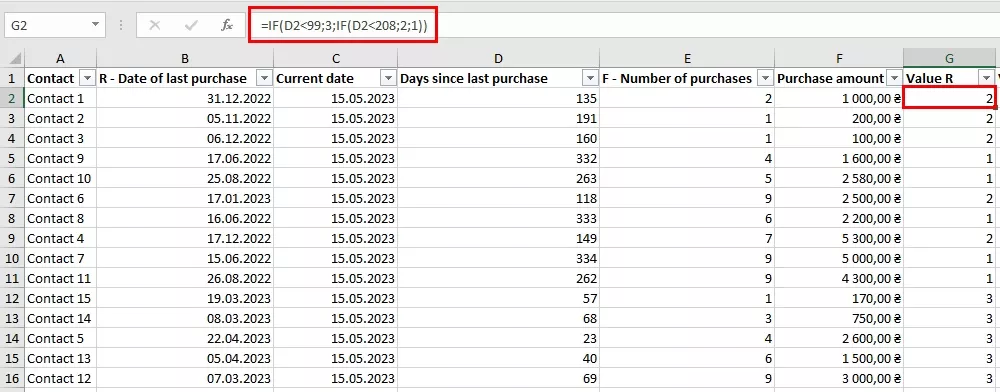
Next, I drag the formula down the column and get the following results:
Do the same for the rest of the indicators in column H.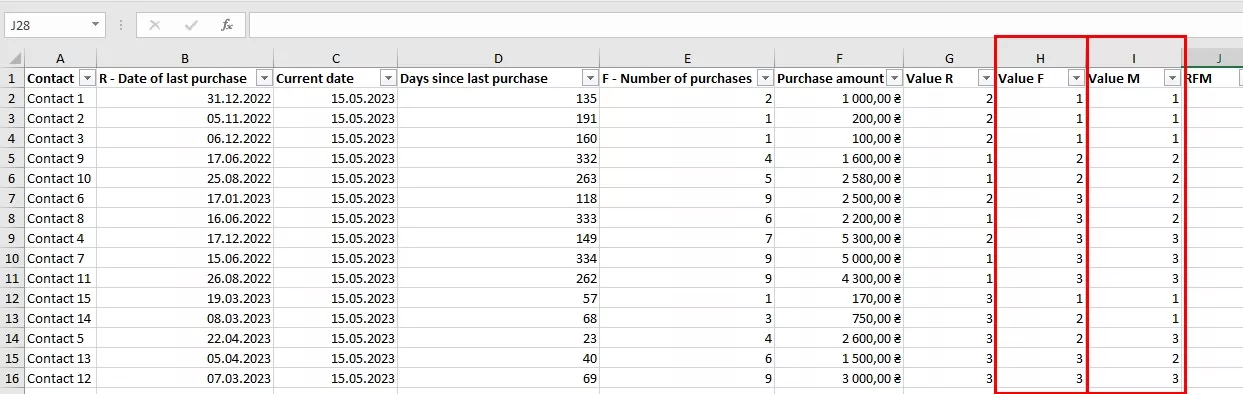
Then, when I have set all the values for all parameters, I output the groups with a simple formula:
Value R*100 + Value F*10 + Value M
The formula for the example looks as follows: G2*100+H2*10+I2.
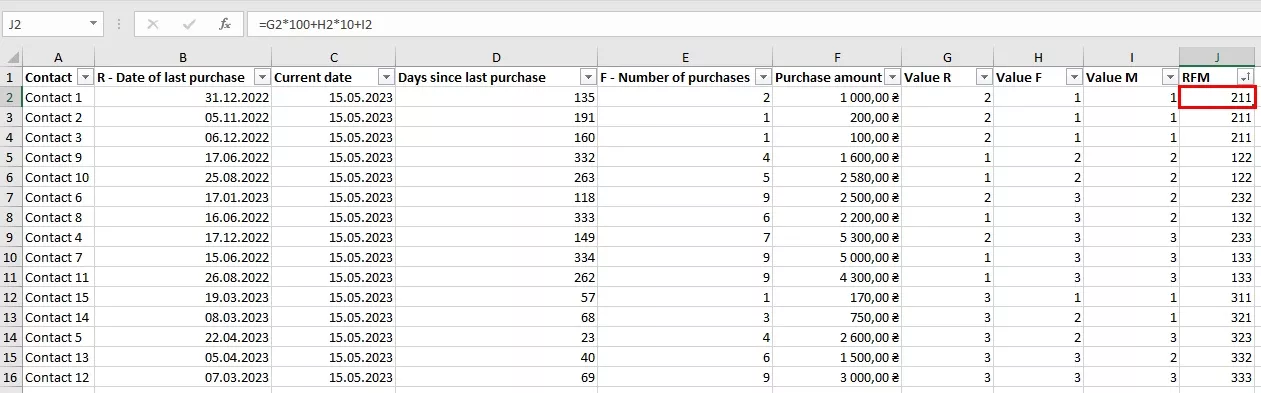
Now, I have groups that can be used for analysis. The best customers are in Group 333, while the worst are in Group 111. Define the threshold for entering the groups based on your needs. For example, 333, 332, 331, 323, 322 can be considered the best, and 133, 132, 123 are the sleeping ones. The new ones can also include 311, 312, 313, etc.
What do you send to the segments?
RFM analysis is used to manage your email list better and target your marketing campaigns. Here are some examples of the different messages you can send to different segments:
- The VIP group. Send them special offers, exclusive promotions, new products and services, discounts, or loyalty bonuses. You can also offer loyalty programs, including discounts, free shipping, or exclusive gifts.
- The Sleepers. Send messages about how much you miss them. Offer discounts to draw them back, and use personalized advertising campaigns based on their previous purchases to get their attention.
- The New Group. Send messages with information about the products and services you provide, and offer them special discounts, promo codes, and privileges for new users. You can also send them information about the warranty or the return policy to build trust.
- Lost group. Send offers such as discounts, bonuses, gifts, or free shipping to attract these customers back. You can also send information about new products and services that interest users to return and purchase.
The messages sent to each group should be personalized and tailored to their needs and interests.
What tools are used
As mentioned earlier, various tools can be used to perform RFM segmentation, including traditional Excel spreadsheets or Google Sheets, specialized programs and online services, and Python programming. Let's take a look at some of these tools:
- Excel or Google Sheets are the most common tools. You can easily use them to create a table with data about users and their purchases. They also have functions you can use to calculate the parameters of interest and segmentation, as in the example above.
- Kissmetrics, Mixpanel, and Salesforce are online services that can be connected to a site to track user actions and behavior. These services allow analyzing user activities and are used for RFM analysis.
- The Python programming language (if you are already familiar with it) can be used for automated customer segmentation. Some libraries and frameworks like Pandas and Scikit-learn allow fast and efficient segmentation.
- Pandas allow you to process, group, and sort large amounts of data and calculate Recency, Frequency, and Monetary Value.
- Scikit-learn provides access to various machine learning algorithms that segment customers based on RFM analysis results. The combined use of these tools makes the RFM analysis process more efficient and reliable.
The choice of a specific tool for RFM analysis depends on the marketer's goals, data volume, and technical expertise. For example, you can use Python to segment large databases quickly and easily with good technical skills. If you don't have technical knowledge, you can use online services.
Excel tables provide a quick and convenient analysis, but using other methods for a large base is better.
Conclusions
1. RFM analysis is a marketing analysis technique used for email list segmentation based on user behavior. The information gathered by this method helps identify which customers bring more value and which bring less.
2. The RFM acronym: R stands for recency and refers to how recent a customer's last purchase was; F refers to frequency or how often the customer makes purchases; and M stands for monetary and refers to how much a customer spends within a given period.
3. The main advantages of RFM analysis are the minimal data needed and the option to analyze only certain indicators.
4. RFM analysis also has certain disadvantages:
- It focuses on only three specific parameters.
- Tracking of customer activity is limited.
- It is difficult to define segment boundaries.
- Additional analytics may be needed.
- Regular updates are crucial.
5. The audience obtained from RFM analysis depends on the criteria chosen. Typically, they are VIPs, Sleepers, New, and Lost customers. Different messages should be sent to each of these categories.
6. RFM analysis can be performed using Excel or Google spreadsheets, web services, and even the Python programming language.
FAQ
What does RFM stand for?
RFM stands for Recency, Frequency, and Monetary. These three factors are used to evaluate buying behavior and segment customers.
What is the purpose of an RFM analysis?
RFM analysis is used to evaluate customer behavior and segment the customer base. Its main purpose is to identify the most valuable customers who are important to retain, usually those who generate the most revenue. The analysis also helps identify customers who could potentially leave.
How do you perform an RFM analysis?
To perform RFM analysis, you need to obtain information about each of your users, including the date and amount of the purchase. Once you have the customer data, you can calculate RFM values for each customer.

 2
2
 2
2
 0
0
Related Articles
How to Set Up Consent Mode in GA4 on Your Website with Google Tag Manager
Let's explore how to properly integrate consent mode in GA4, configure it for effective data collection, and at the same time comply with GDPR and other legal regulations
Display Advertising Effectiveness Analysis: A Comprehensive Approach to Measuring Its Impact
In this article, I will explain why you shouldn’t underestimate display advertising and how to analyze its impact using Google Analytics 4
Generative Engine Optimization: What Businesses Get From Ranking in SearchGPT
Companies that master SearchGPT SEO and generative engine optimization will capture high-intent traffic from users seeking direct, authoritative answers