A Complete Guide to PPC Reports in Google Analytics 4
Since the migration from Universal Analytics to Google Analytics 4 (GA4), PPC professionals have been exploring the tool and finding interesting reports, summaries, and functions. It is clear that in GA4, Google has taken a different approach to reporting: a new event-based data modeling. The change in the digital ecosystem is a positive one — marketers can now gain deeper insights into customer and user behavior on the site.
In this article, I will show you how to build reports in GA4 and highlight the new features and updates included in them, alongside examples of usage.
Types of reports according to construction logic
GA4 custom reports
Google Analytics 4 includes standard reports that contain basic metrics. But sometimes, you may need reports with custom metrics for specific projects. GA4 is useful in such cases, as it lets you create reports tailored to the goals and needs of any business.
Using Google Analytics, you can create, customize, and manage various kinds of reports. You can either use ready-made standard reports or create your own personalized overview and detailed reports from scratch.
Both options use the same data but present the information differently.
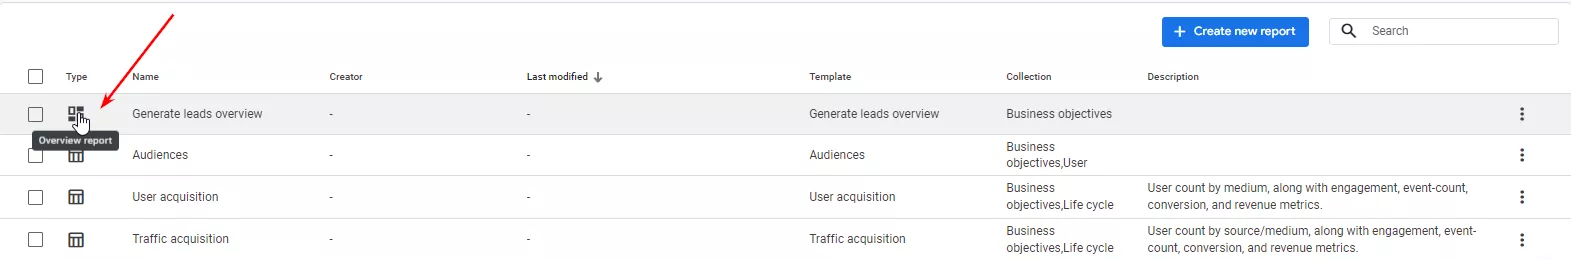
Overview reports
These are similar to Traffic Sources reports. They contain a set of summary cards, each containing a dimension and several metrics. The purpose of an overview report is to provide a summary and an overview of the online performance of a business.
Detailed reports
As suggested by its name, a detailed report helps you analyze data in more detail. While an overview report provides a top-level summary of the data, a detailed report typically includes data tables, graphs, and additional graph visualizations, such as histograms or scatter plots.
Detailed data tables can have up to 250 rows, as well as additional measurements and comparisons. You can create detailed reports using an out-of-the-box solution, as GA4 offers 10 templates to choose from. Each has a set of parameters, metrics, and visualizations. Let me list them:
- Traffic sources
- Traffic attraction
- Demographic data
- Technical data
- Completed purchases
- In-app purchases
- Conversions
- Events
- Pages and screens
- Publisher ads
Together, these reports can be organized into a collection, which is a group for a specific aspect of your business. By default, Google Analytics 4 includes only two report collections: Life cycle and Custom. To create a collection, you must have modification permission. Collections are limited to five topics and 10 reports per collection.
Calculated metrics
Calculated metrics were recently introduced in Google Analytics 4. They are metrics that are manually created by the user and derived from calculations using formulas. These metrics are based on existing Google Analytics data.
Previously, you could only use the metrics originally included in GA4 in default reports and surveys. Now, you can create calculated metrics directly in the interface and add new data. This is very convenient because you no longer need to upload data to Excel or Google spreadsheets to separately calculate the additional metrics you need.
You can add calculated metrics right in Google Analytics 4 using simple math formulas. Do note that Google places a few restrictions on calculated metrics (CM). For instance, you can create up to five calculated metrics for each standard property. Formulas are also limited to 1024 characters in length. However, most basic formulas don't require that many characters.
To create a calculated metric, the user must be a GA4 resource administrator or have editor permissions.
For advanced setup, custom reporting, and deeper insight generation, many companies rely on Google Analytics 4 Services to unlock the full potential of calculated metrics and other GA4 capabilities.
A CM is created as follows:
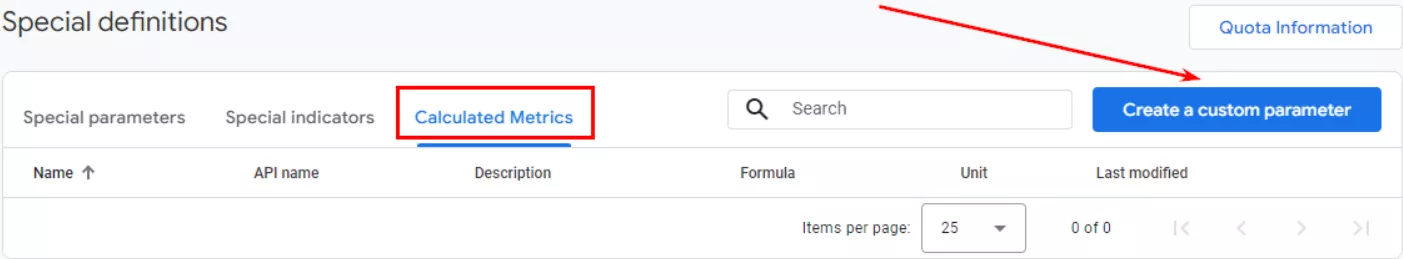
- Go to Administrator > View data > select Special definitions.
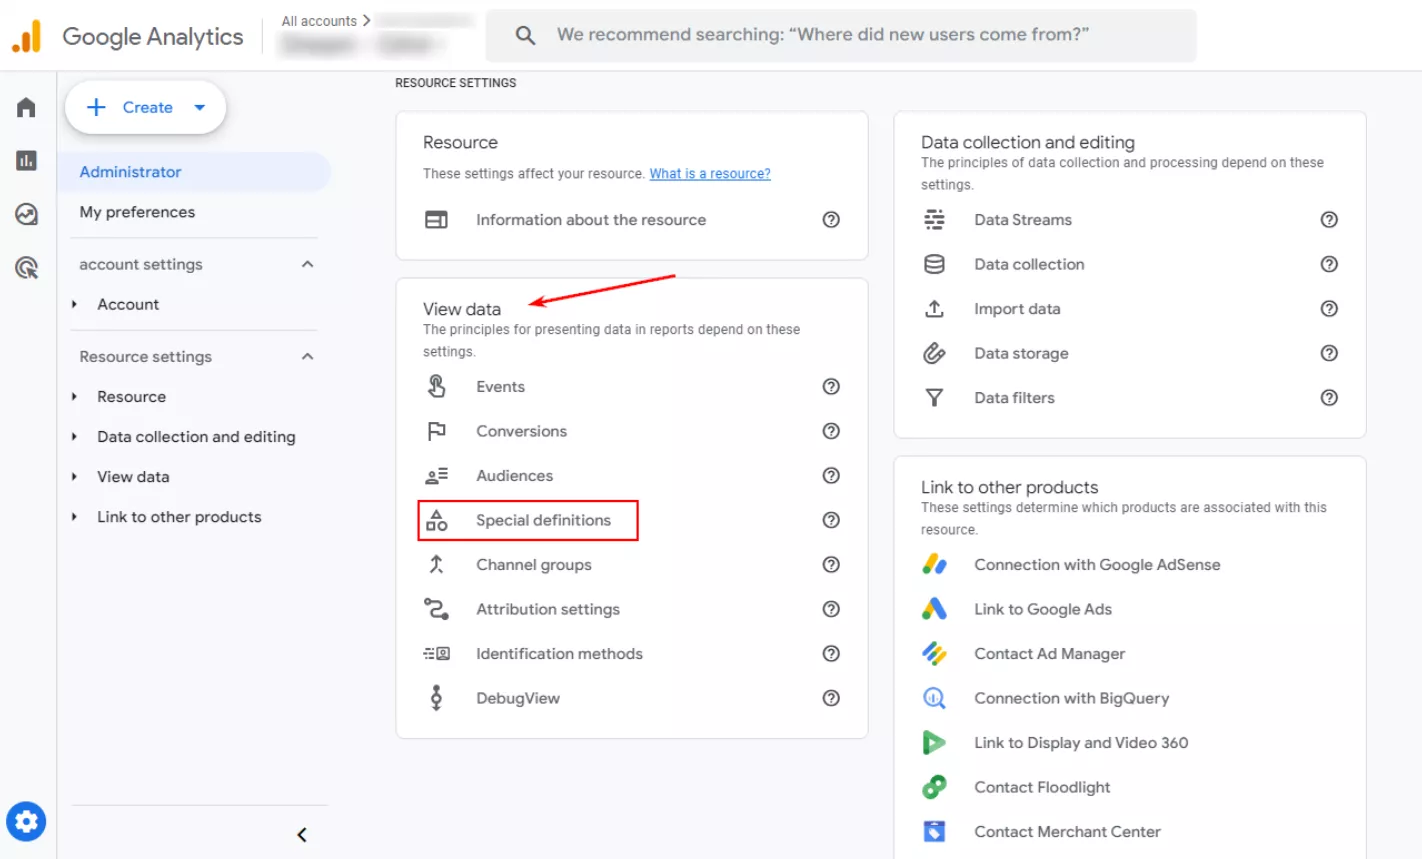
- Click the Calculated Metrics tab on a new page and create your metric.

- The next screen displays the calculated metric setting interface, which has five fields to set.
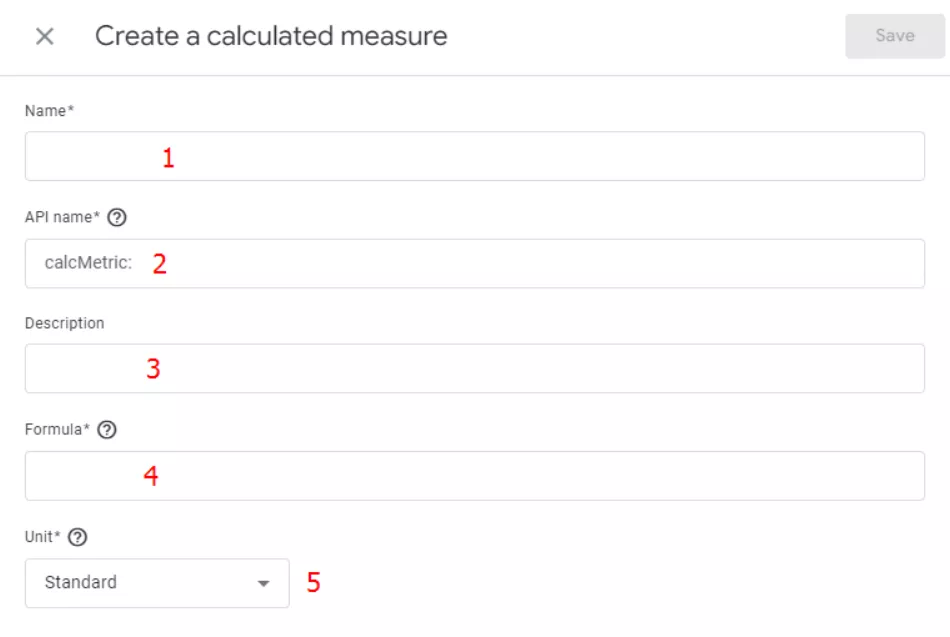
More about the fields in the calculated metrics interface:
- Name is a required field. Add a clear title so anyone looking at the metric will quickly understand it.
- The API name is used to identify the metric being calculated when querying the API. Names can only contain letters, numbers, and an underscore. Special characters and spaces are not allowed. The API name must be unique and cannot be changed.
- Description is optional, but I recommend adding something that gives users additional context when they hover over it in reports. This is similar to a tooltip.
- All actions take place inside the formula. You can use the arithmetic operators: - (minus or negative), + (addition), * (multiplication), / (division), () (parentheses). There cannot be any other calculated metric in the formula field. You can use parentheses, but square brackets do not work. The order of operators is the same as in math.
- The unit determines how the value of the metric is displayed in reports. There are four categories: standard, currency, distance (meters, kilometers), and time (milliseconds, seconds, minutes, hours).
Now let me tell you more about how to create a calculated metric and display it in reports.
I will also share some common examples of using calculated metrics in GA4.
Revenue in another currency
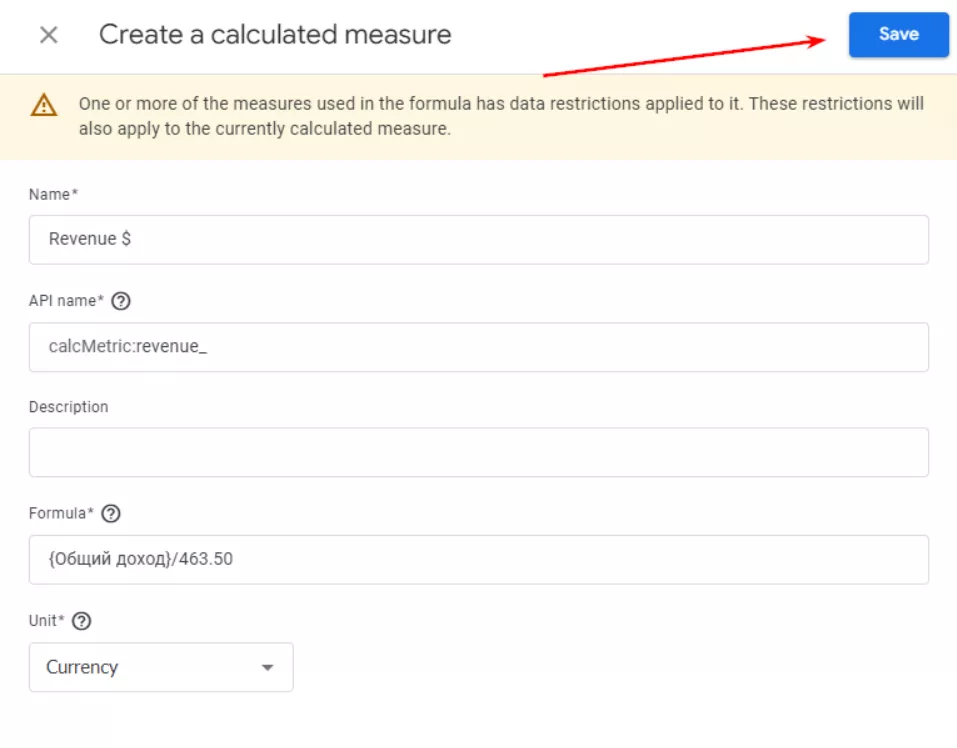
This is important if you want to view revenues, costs, and other metrics in another currency, such as dollars. You can use the formula:
{Total Revenue} * exchange rate $.
Although exchange rates change daily, this type of conversion is useful to get a general idea. Below is an example.
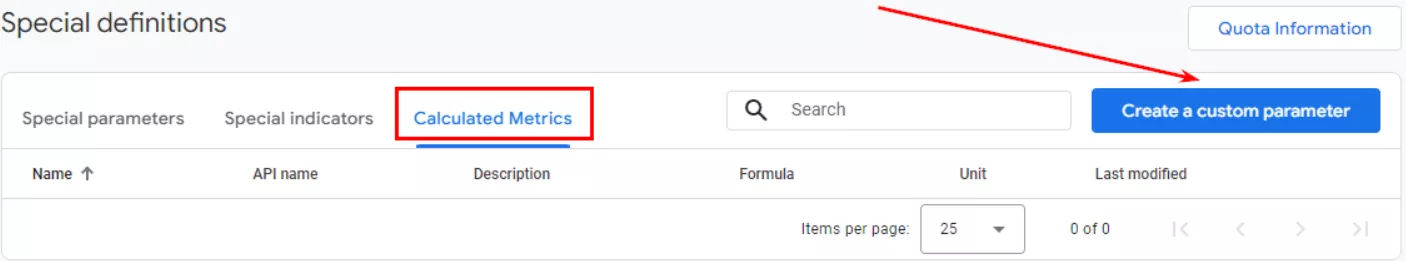
Go to Administrator and select Special definitions.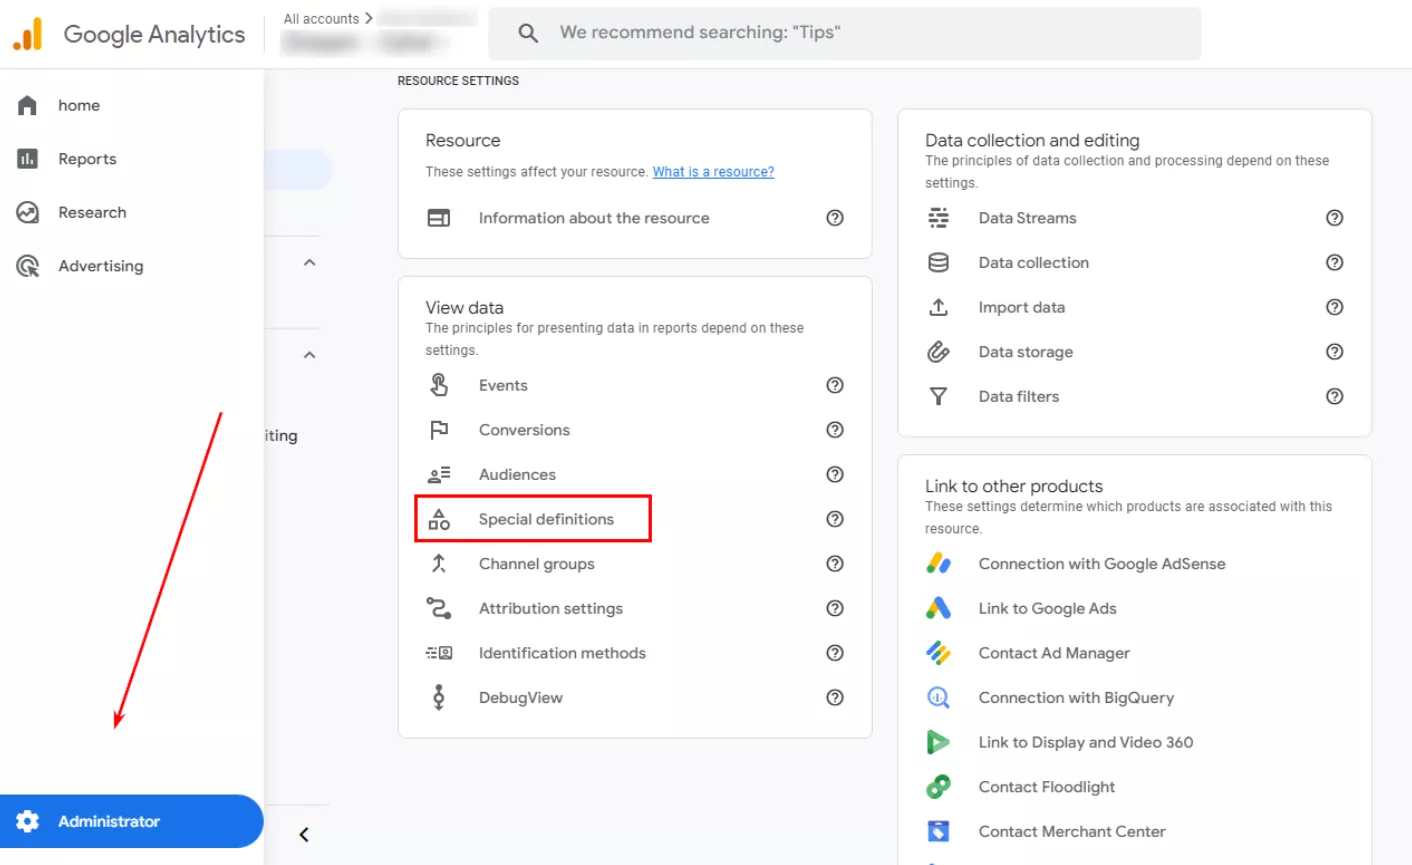
Select Calculated metrics. Create a custom parameter.
Fill in all the details. Add the exchange rate with a dot. Unit: Currency. Click Save.
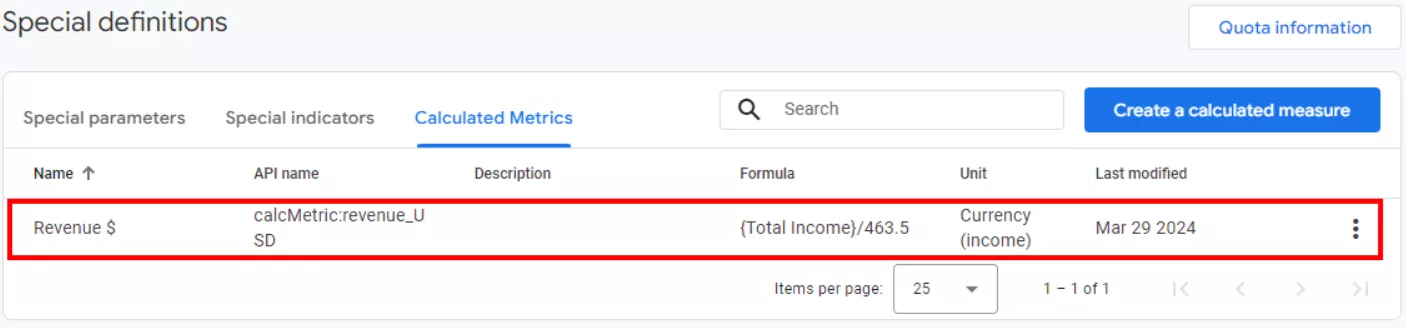
Now, you can add a new parameter to the final report.
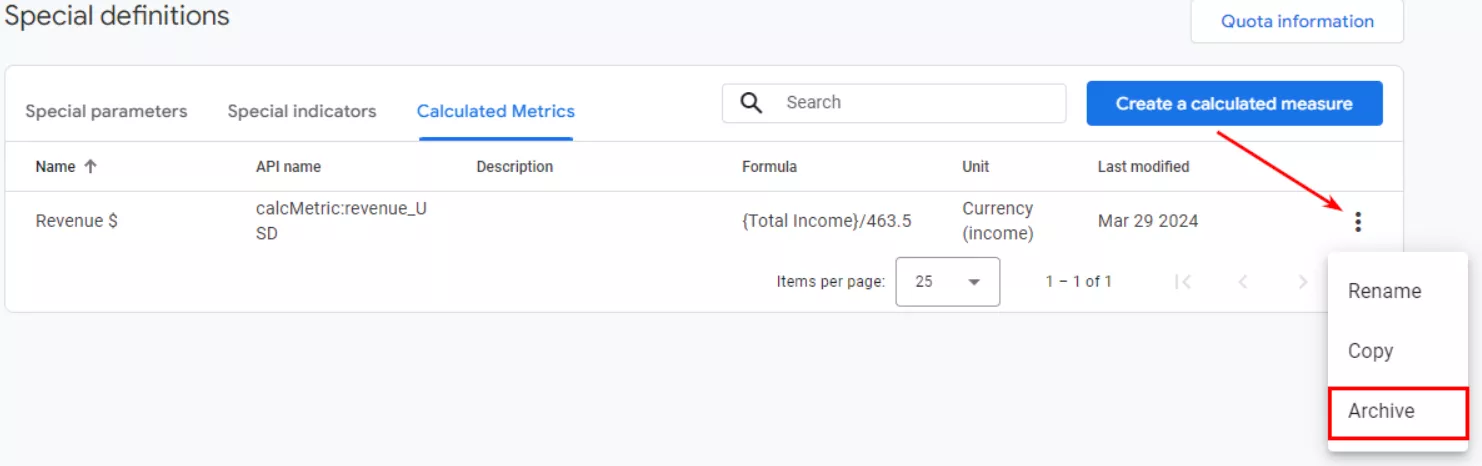
If you want to delete the created metric, click on the three-dot menu on the right. Then click Archive.
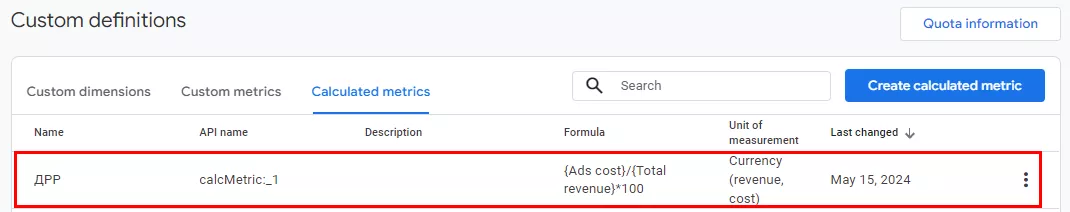
Calculating the Cost Revenue Ratio (CRR)
The Cost Revenue Ratio (CRR) is the ratio of advertising expenses to the revenue generated. It is measured as a percentage.
The formula for CRR calculation in GA4:
CRR = ({expenses}/{revenues})*100.
To calculate the CRR, go to Administrator > View data > Special definitions.

Go to Calculated metrics.
Next, fill in the fields and enter the formula. The calculated CRR metric is created.
Calculating the percentage of new users
To find the percentage of new users, use the formula:
({New Users}/{Total Users})*100
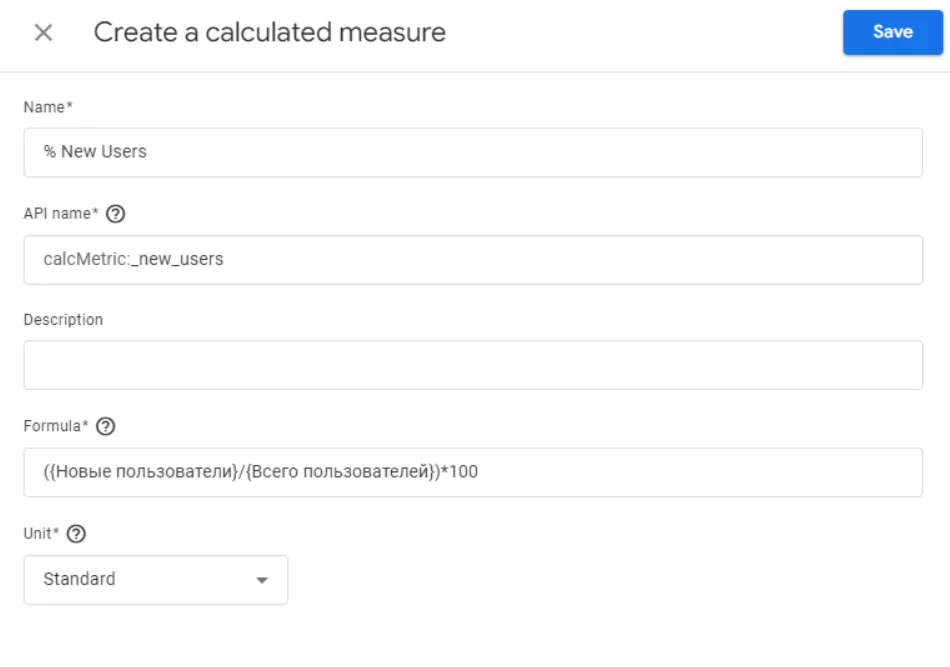
A special parameter is created.
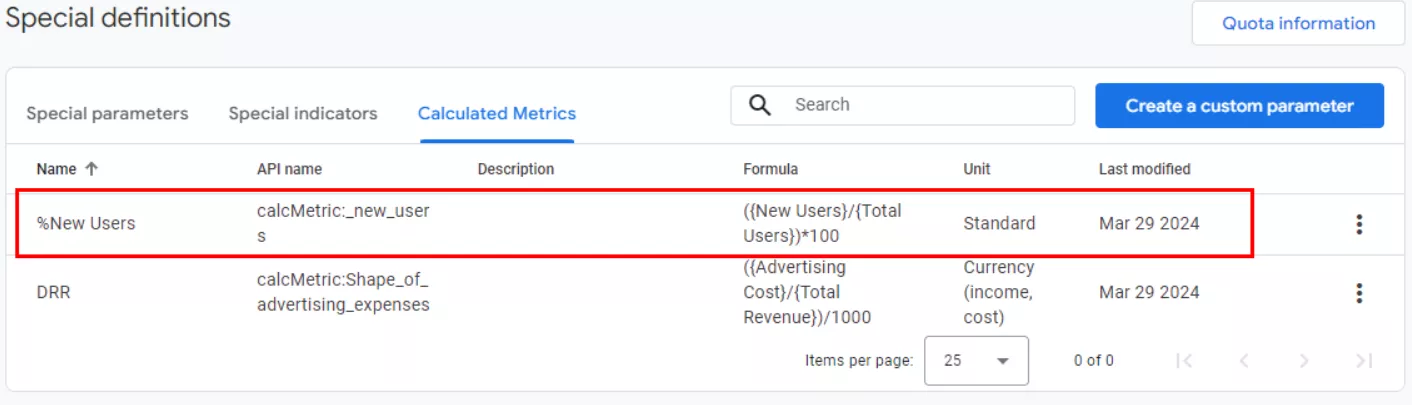
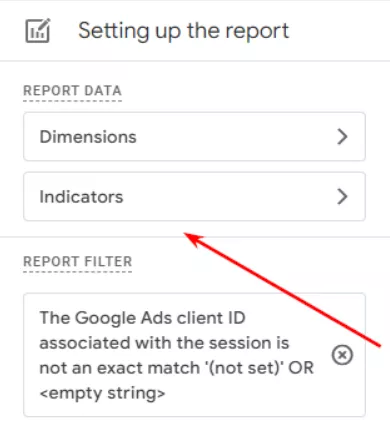
Now, you can add the newly created calculated metrics to the finished report.
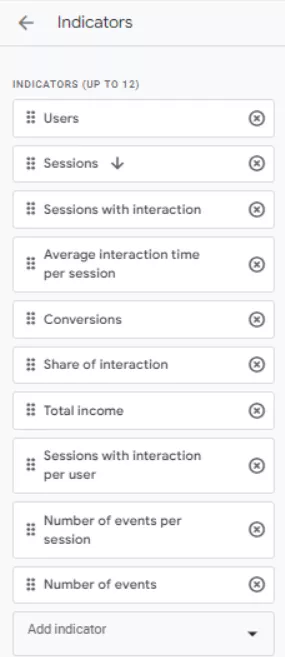
To edit the reports, click on the pencil icon in the top right corner.
A menu will open on the right, and you can add indicators to the created calculated metrics.
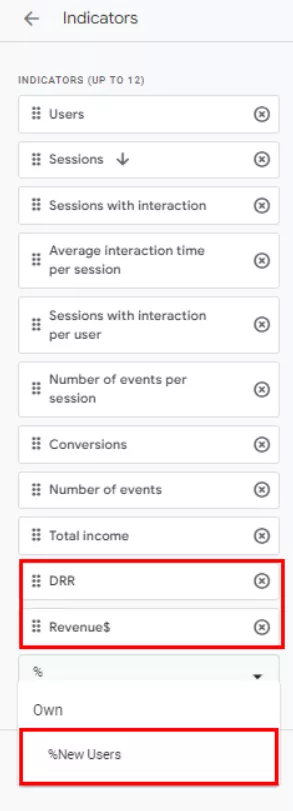
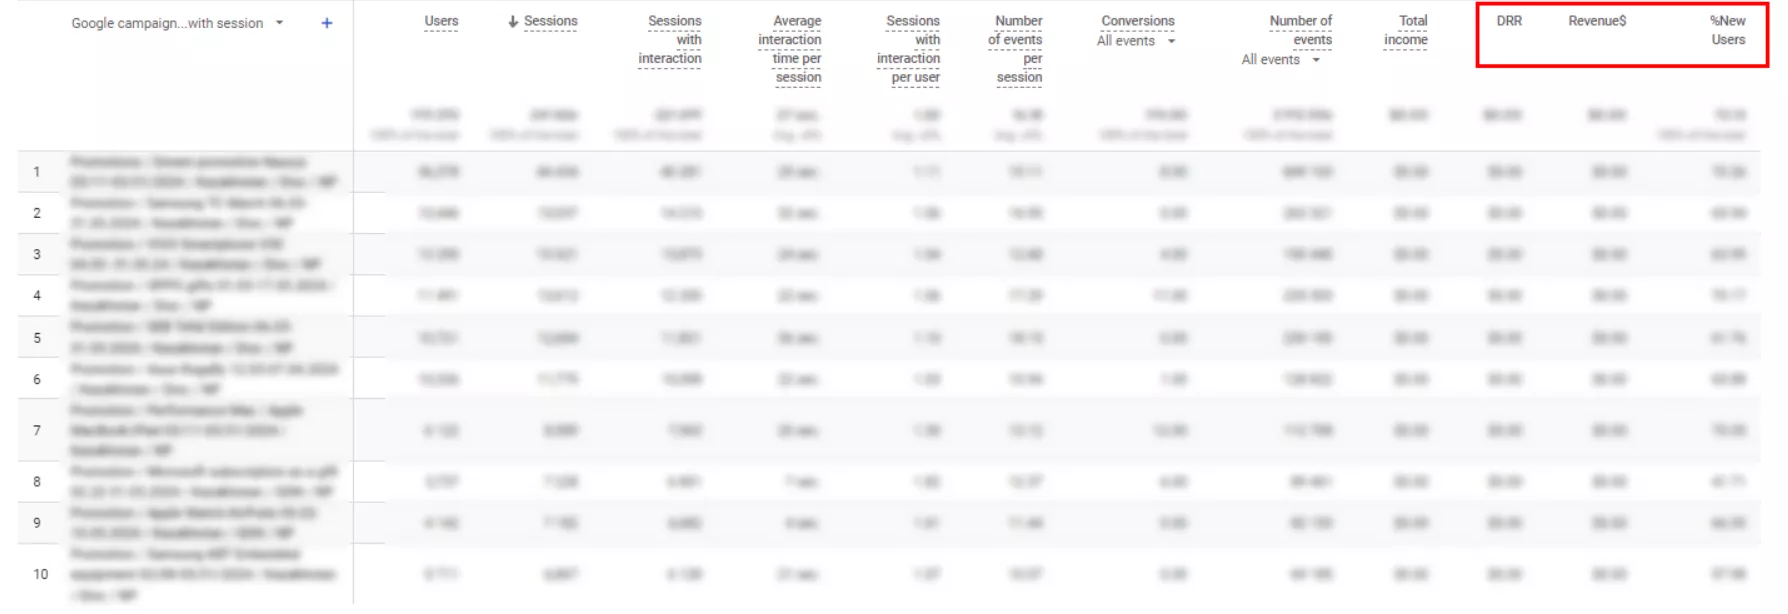
Next, check the new metrics in the report.
Tip: You can perform the calculations manually (e.g., in Excel) to double-check the results and make sure that the settings are correct.
There are several other metrics that can be calculated.
|
Metric |
Formula |
Unit |
|
Frequency of sending forms to prospects |
{{Form Submissions}} / {{Form Views}} |
Standard (form submissions and views must be configured as custom events in Google Analytics 4) |
|
Average order value |
{{Gross Product Revenue}} / {{Transactions}} |
Currency |
|
Product revenue after returns |
{{Total Product Revenue}} - {{Transaction Returns}} |
Currency |
|
New user checkout rate |
{New Users}/{Order Placements}*100 |
Standard |
|
Number of sessions per user |
{Sessions Engaged}/{Total Users} |
Standard |
|
Shipping cost as a percentage of purchase revenue |
{Shipping Cost}/{Sales Revenue} |
Currency |
|
Percentage of discount on product |
{Product Discount}/{Product Revenue} |
Standard |
|
Views per transaction |
{Views}/{Transactions} |
Standard |
|
Revenue in USD |
{Total Revenue}*USD Exchange Rate |
Standard (by selecting a currency, you will see the default currency symbol in your GA4 resource) |
|
Promotion views per transaction |
{Promotion Views}/{Transactions} |
Standard |
It is worth choosing the most appropriate calculated metrics for specific marketing goals. Please note that a maximum of five calculated metrics can be added.
Three basic reports in PPC
There are three main types of reports to be aware of, and they can be manually created with the desired indicators and parameters for specific tasks.
Facebook Report
This is a detailed report tracking site traffic from Meta social networks (Facebook and Instagram) when ads are running. Google Analytics 4 tracks Facebook traffic automatically. You can also add calculated metrics. How exactly? I'll tell you a little later.
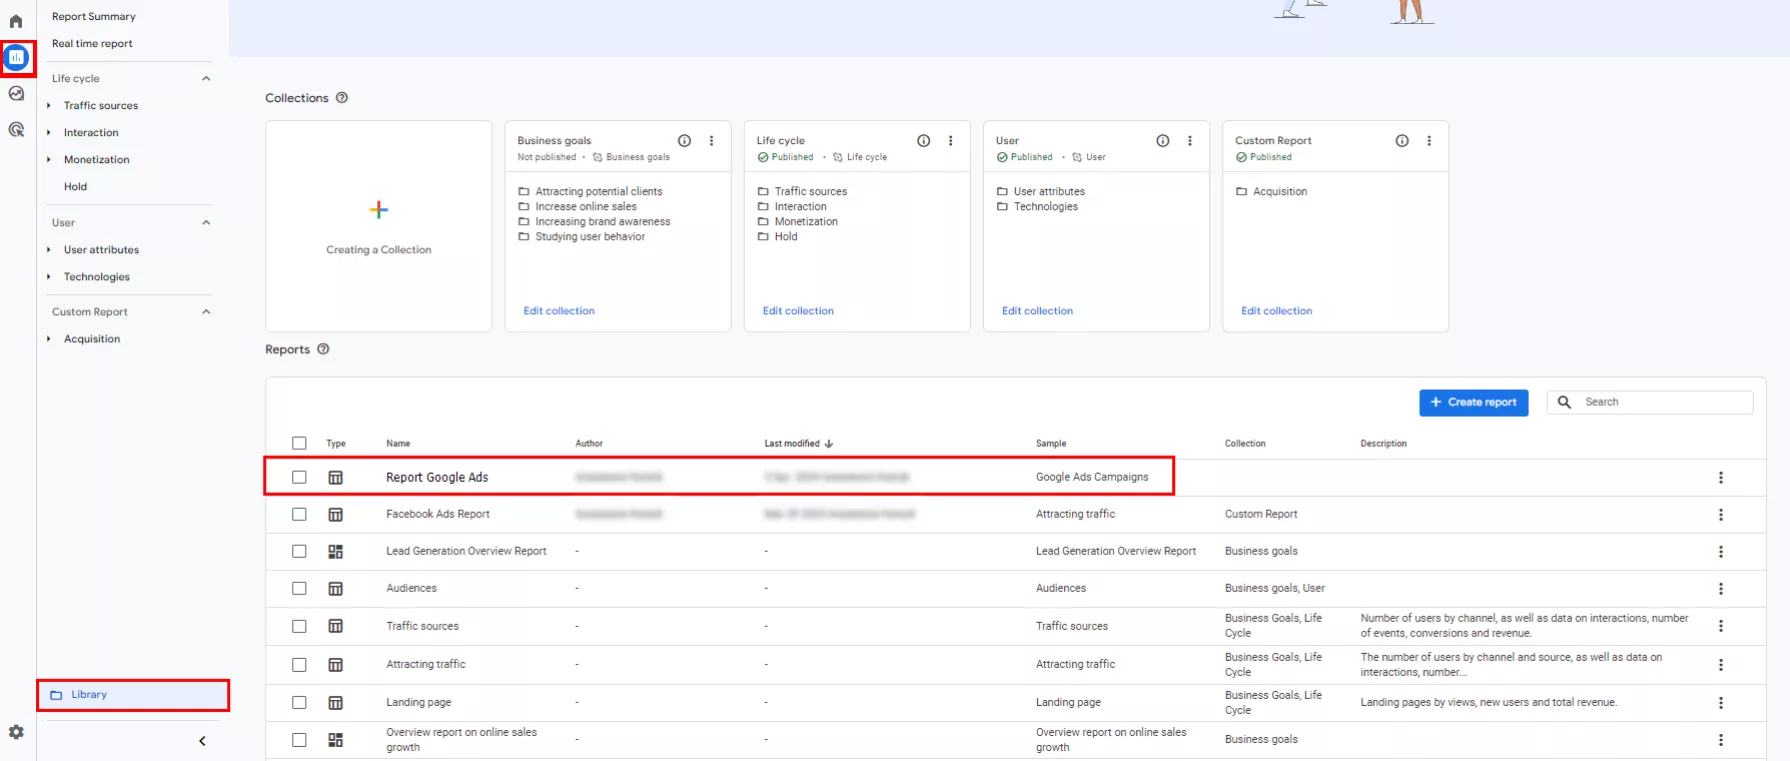
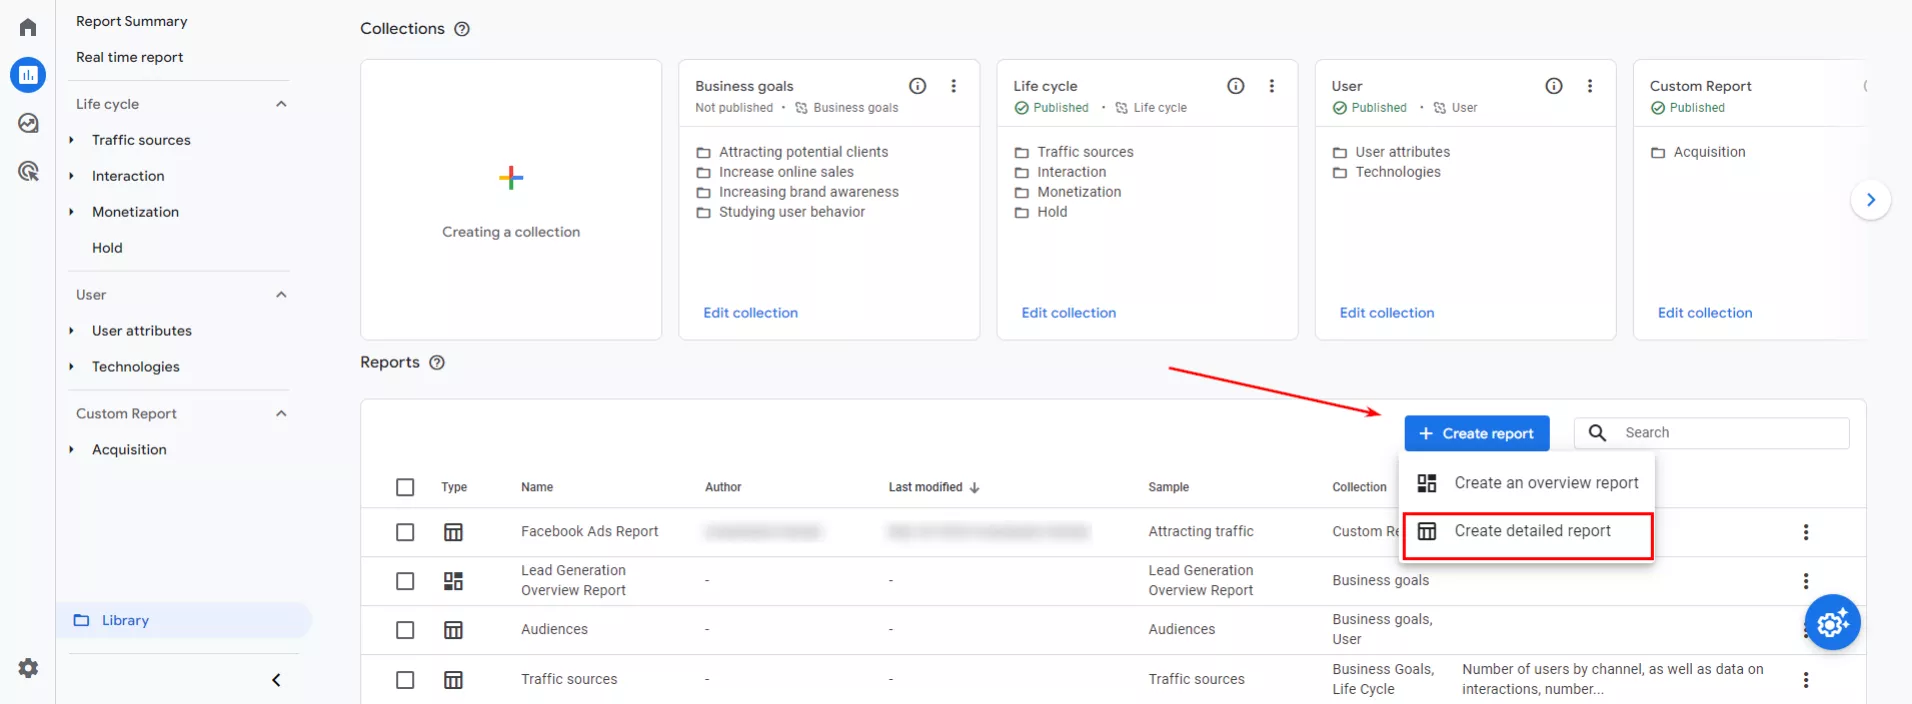
- Go to the Reports menu, followed by Library.
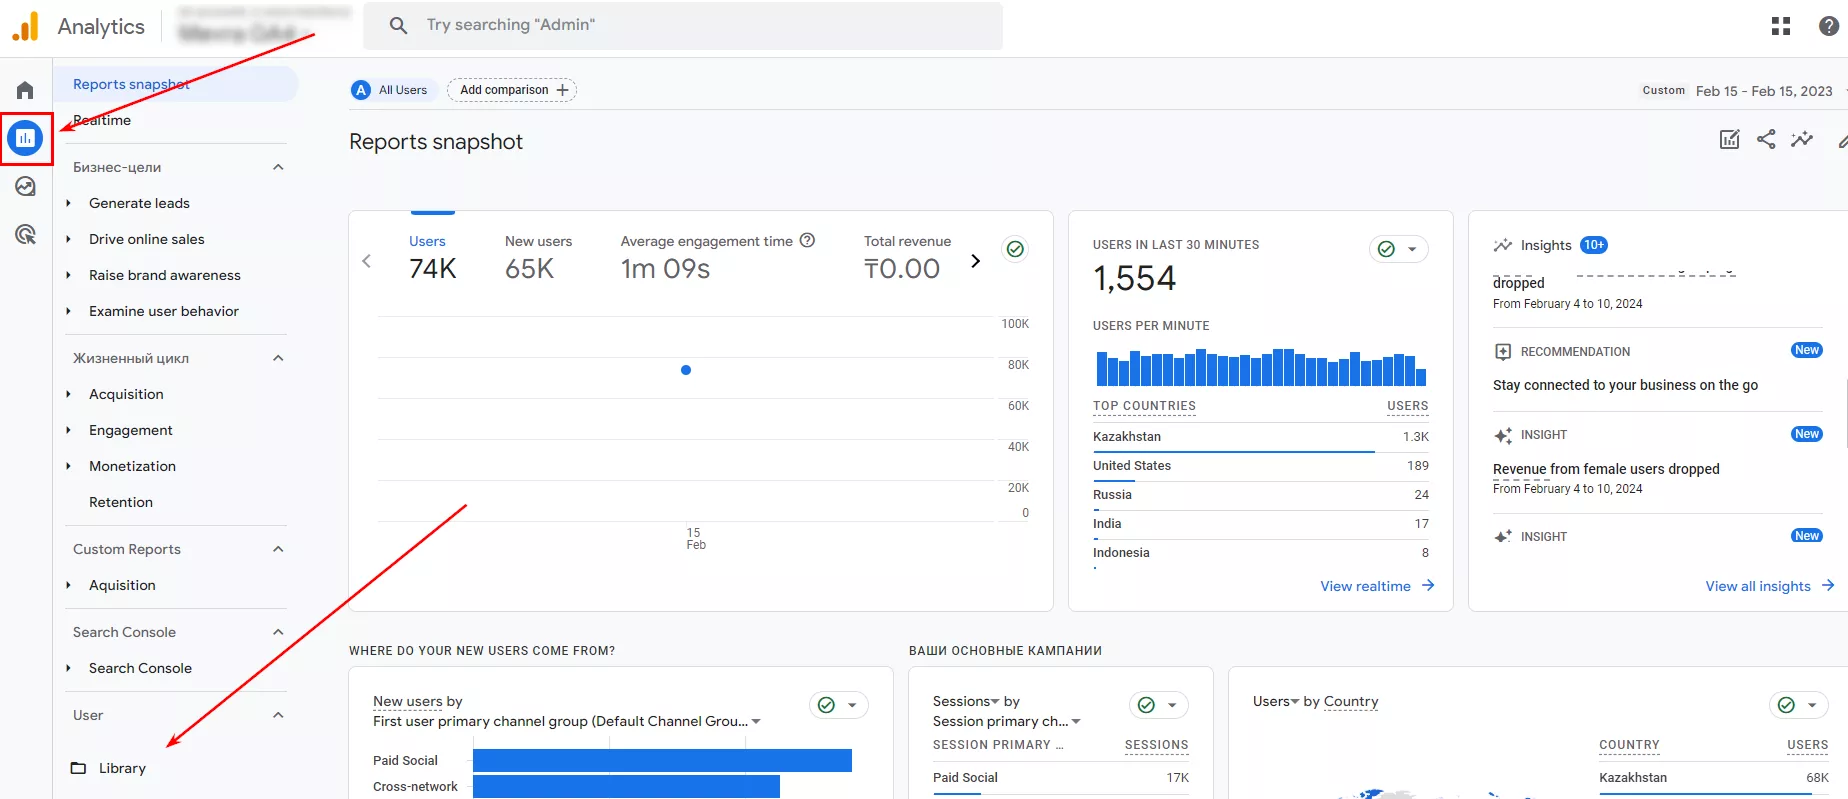
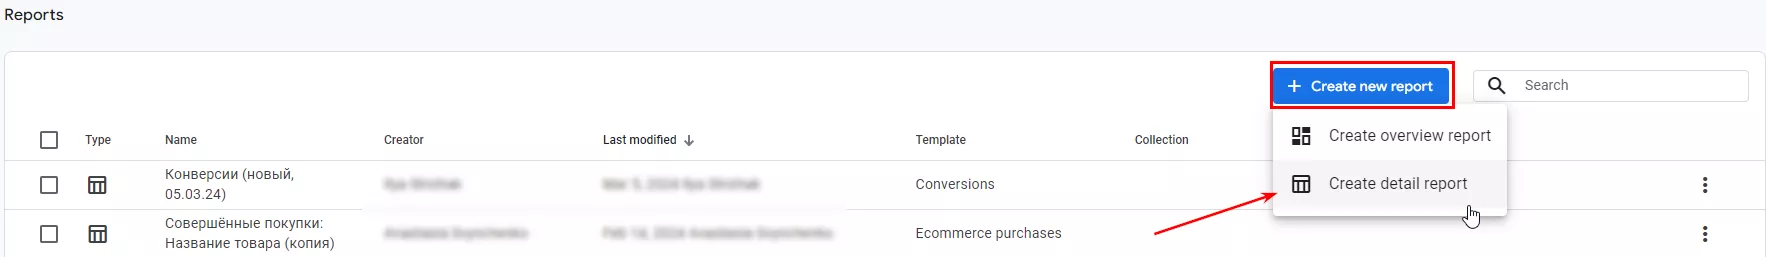
- From the menu on the right, click Create detailed report.
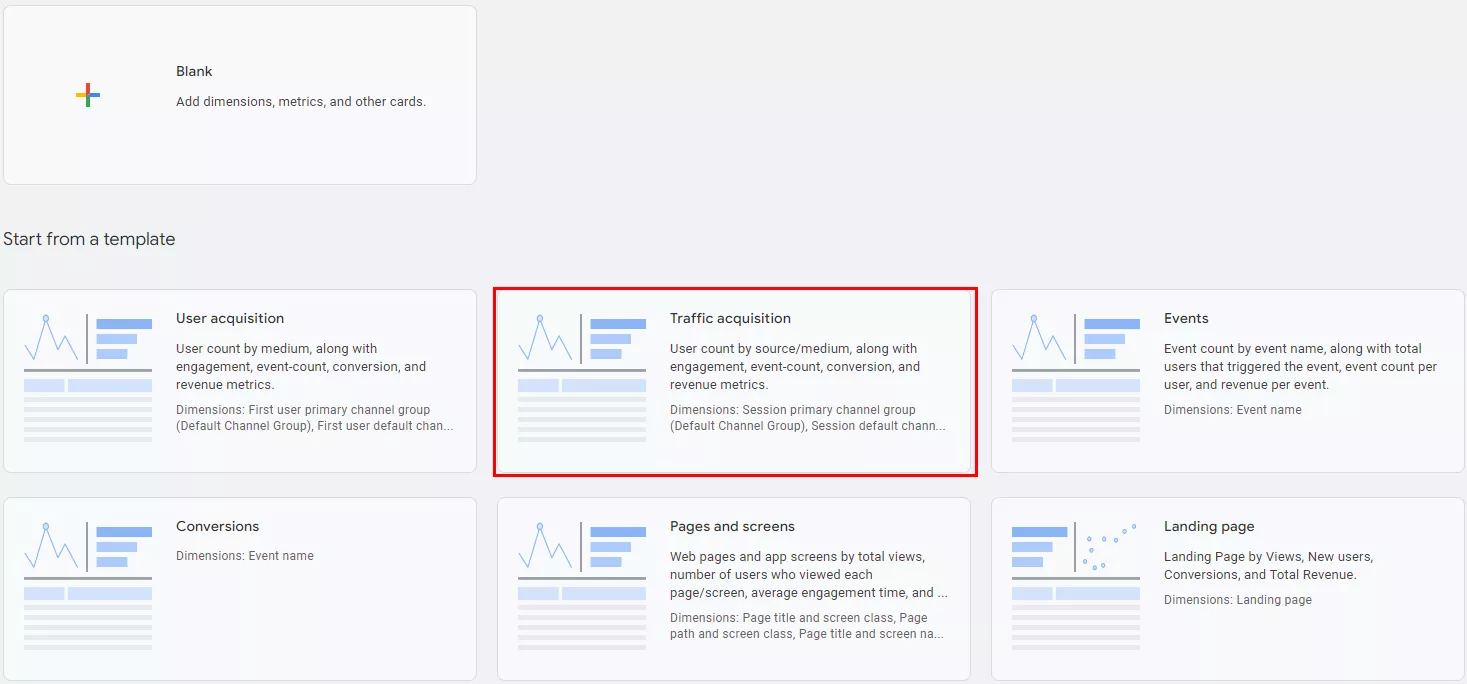
- Select the Traffic acquisition template.
- Go to report customization from the menu on the right.
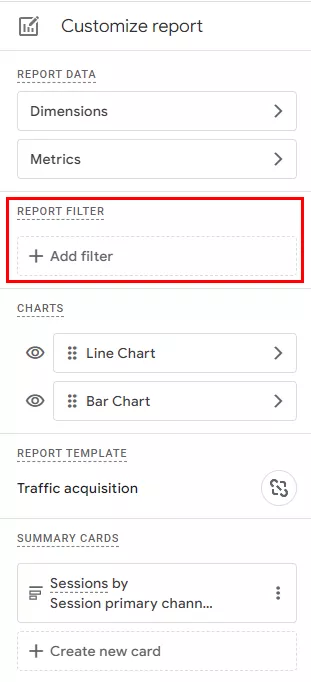
- Set the filter first user source/medium exactly matches facebook/cpc.
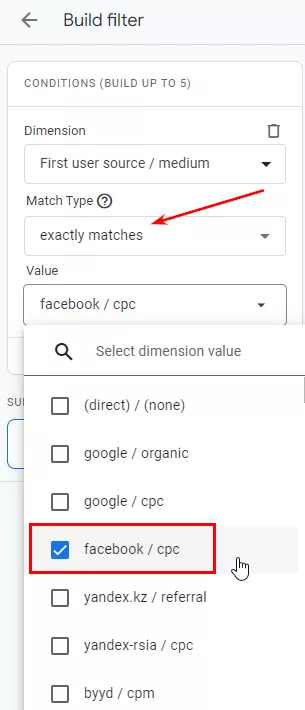
- Click Apply and get a summary of the facebook/cpc channel. To break down the stats into campaigns, select Session campaign.
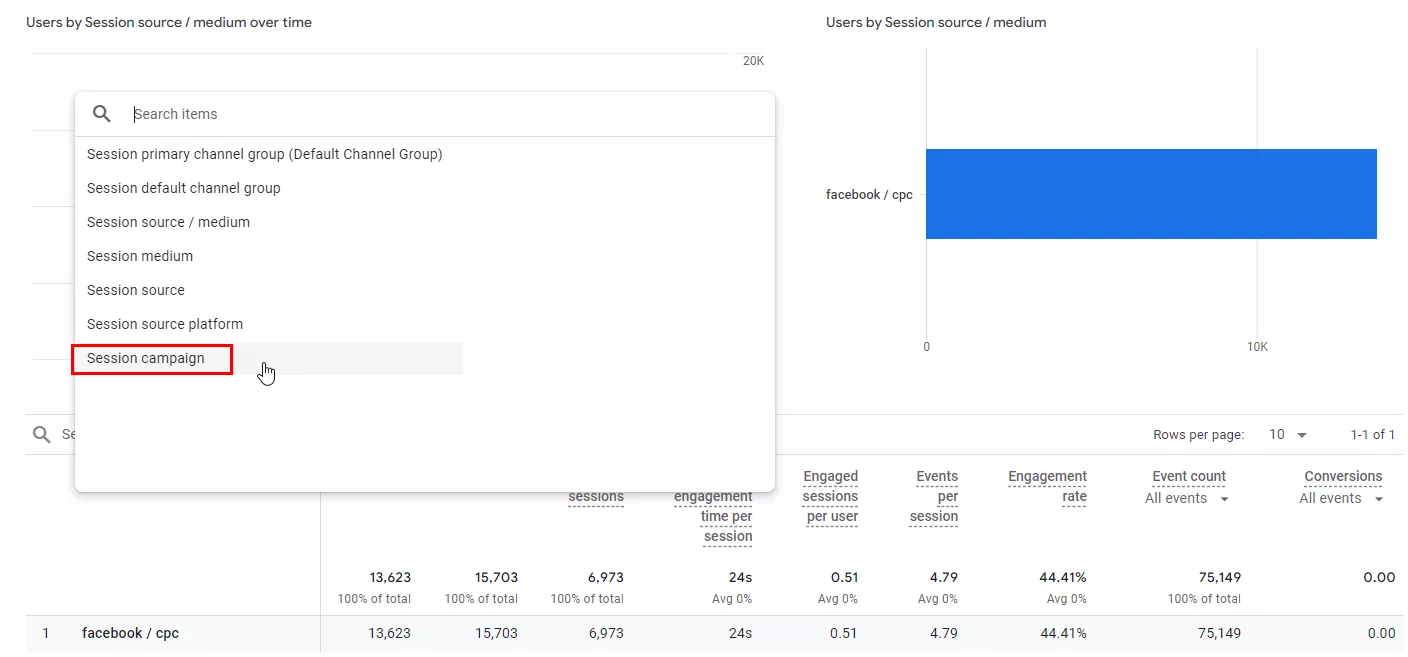
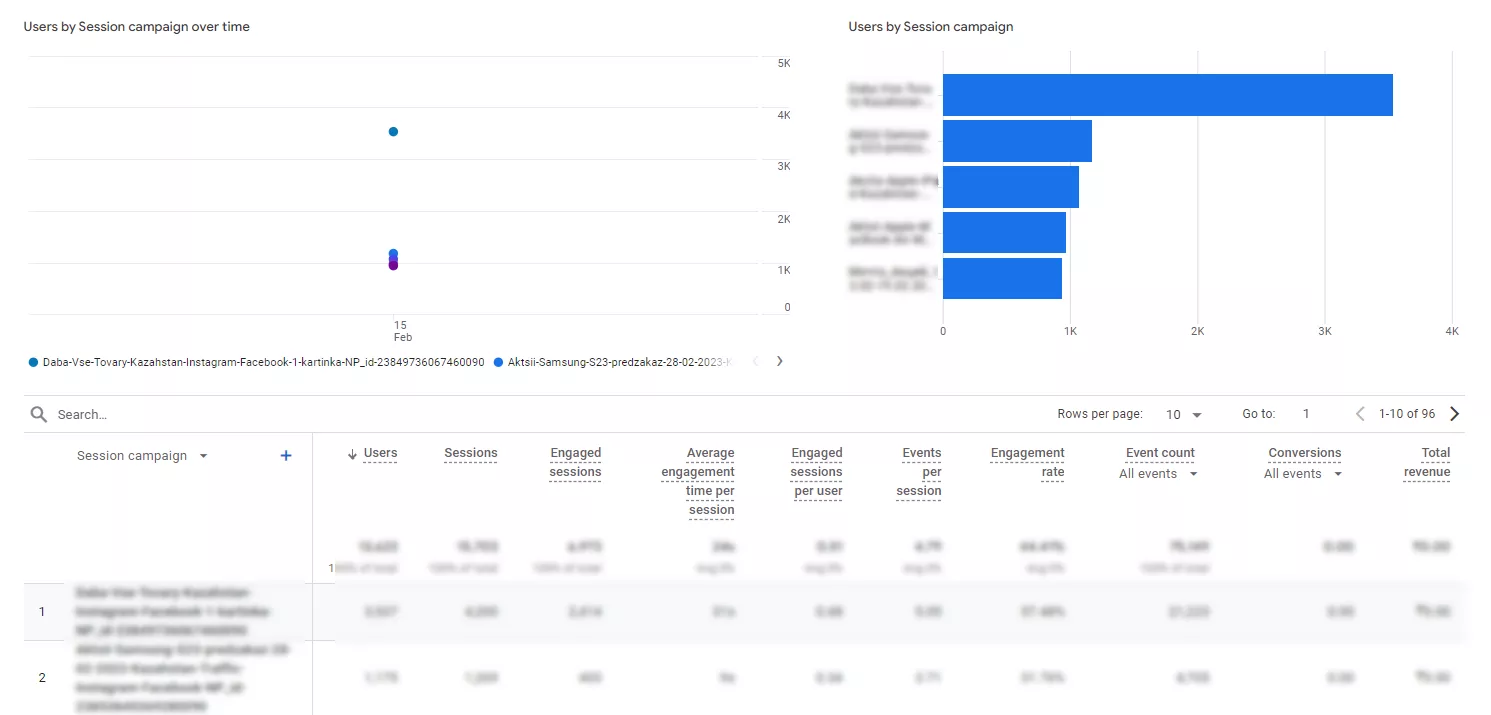
- The Facebook campaign report is ready.
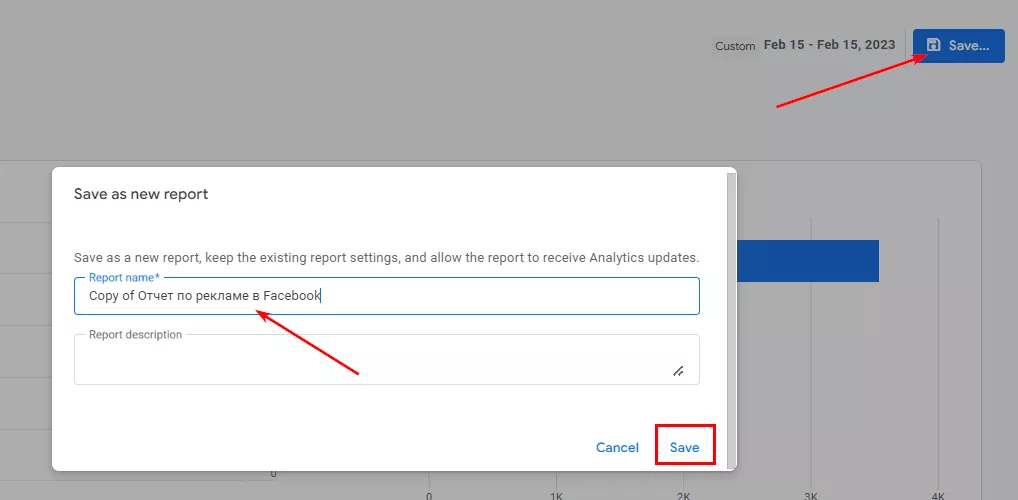
- Next, click Save.
- For the report to appear in the main menu on the right, you need to move it to the gallery. Add it to the created reports and name it, for example, Custom Reports. Next, click Change collection and move the created report to the Traffic sources collection. Save the changes.
Now, you can view stats on Facebook and Instagram campaigns at any time without additional effort. To make the report appear in the menu on the right, click Publish.
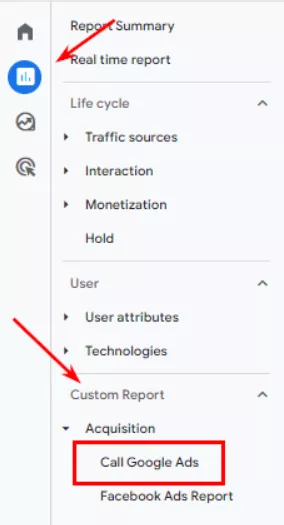
Google Ads report
Now, let me show you how to create a basic default report for Google Ads. Go to Life cycle, followed by Traffic sources, and then Review. This will open a detailed summary of the traffic source reports. Next, find the View Google Ads campaigns widget.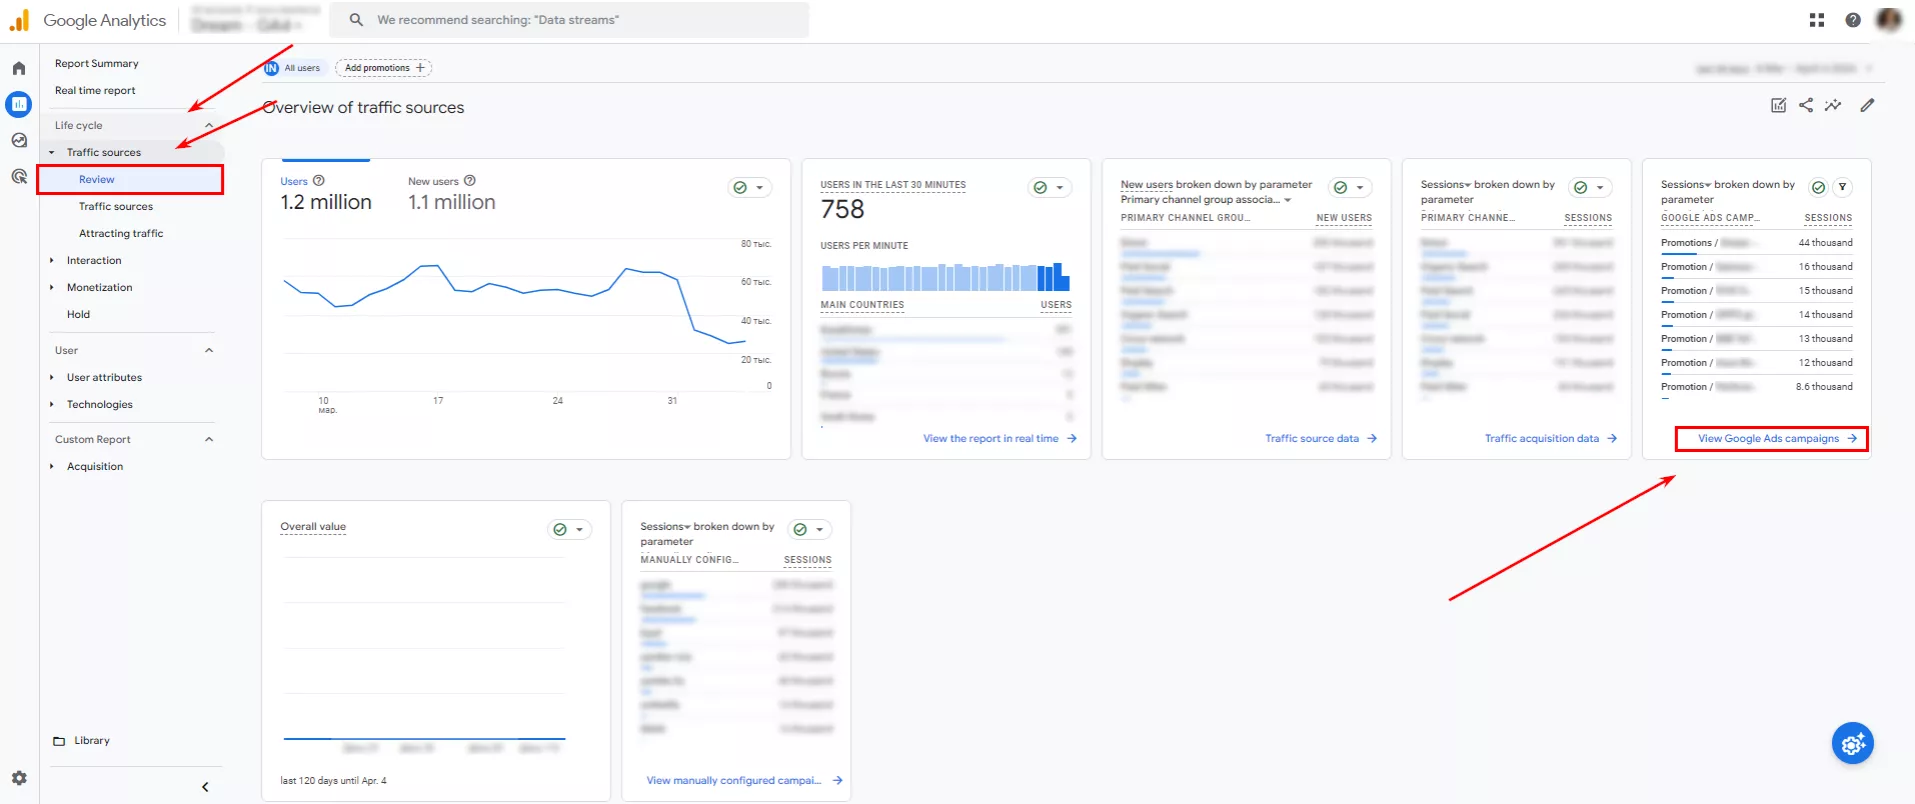
A template will open with a breakdown of your Google Ads campaigns, which you can then edit and save.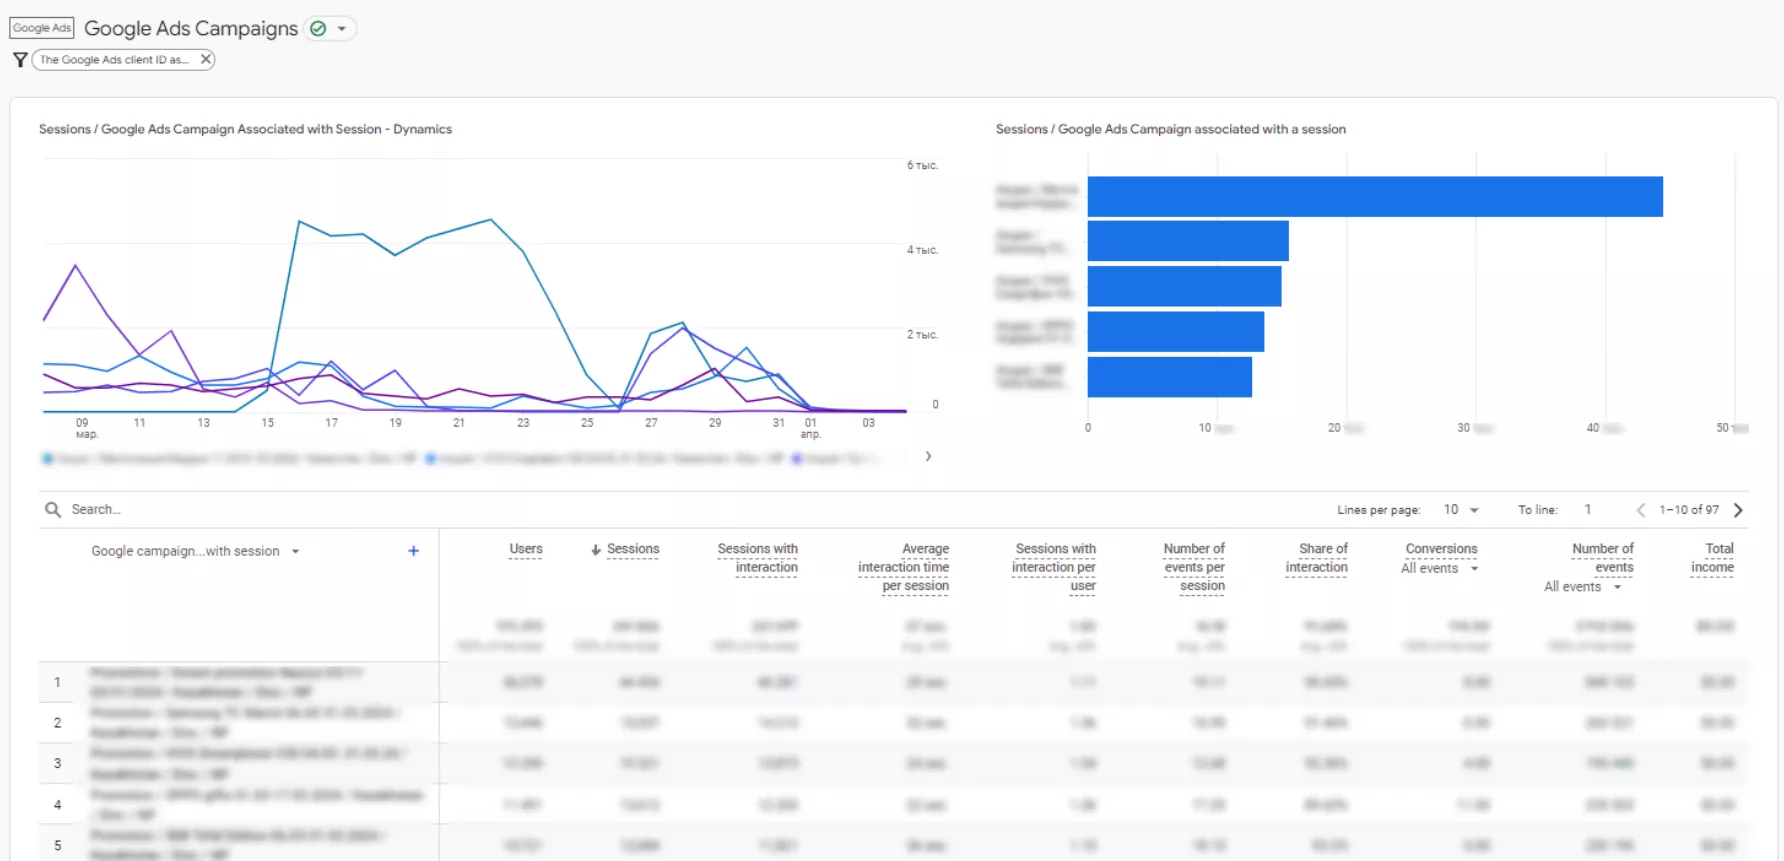
To edit, click on the pencil icon in the upper right corner.
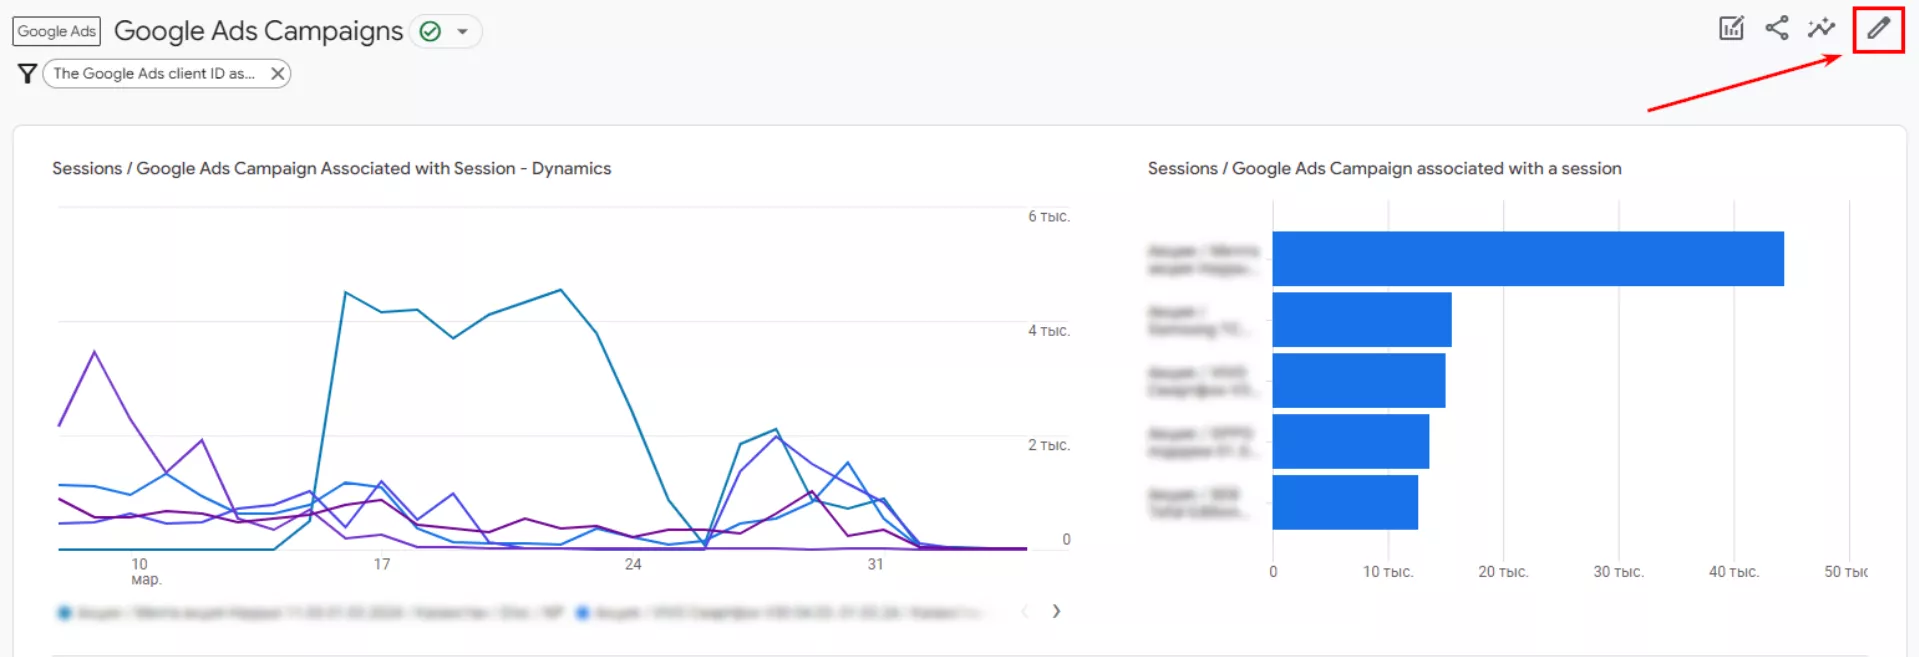
You can leave the template as it is or add more metrics if you need.
For example, you can swap metrics for convenience.
Then click Apply, Save, and add a name for your finished Google Ads report.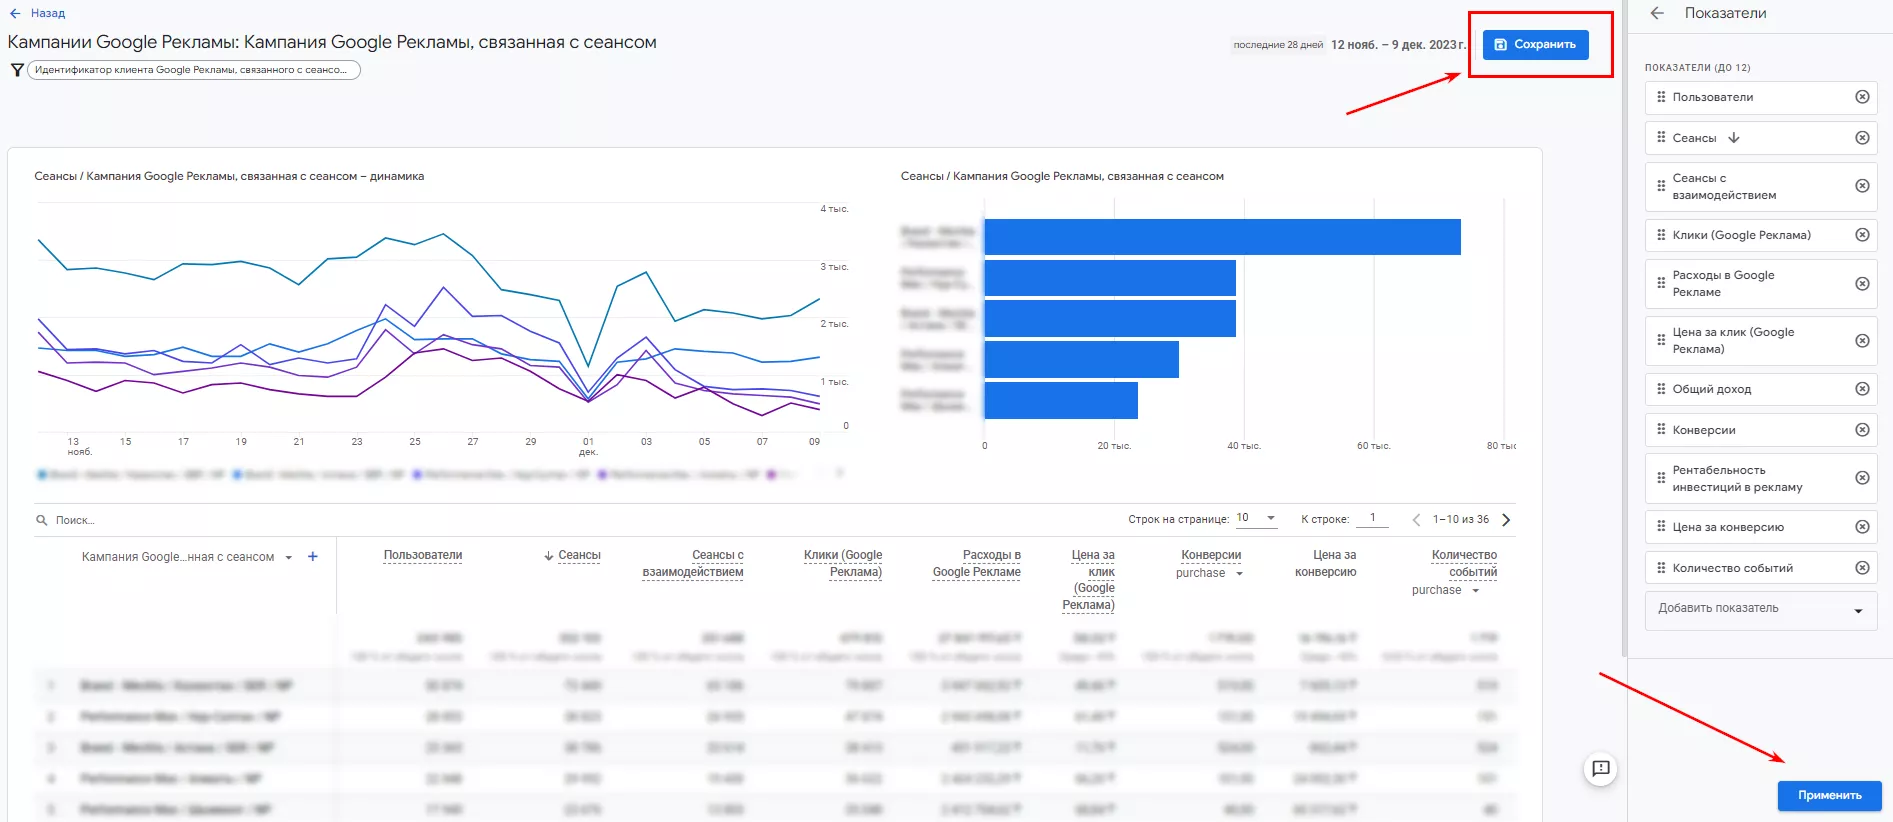
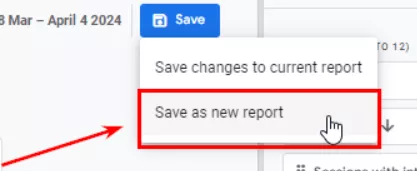
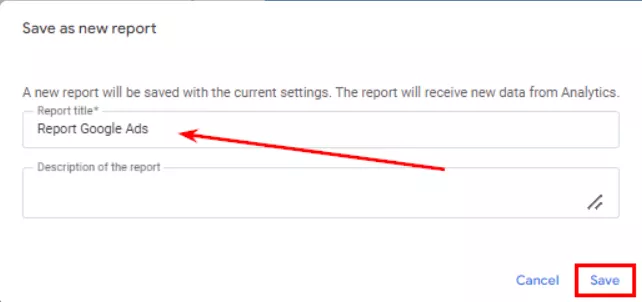
The saved report is now in the Library.
You can also add a report to a collection. No template is needed, as it can be done from scratch.
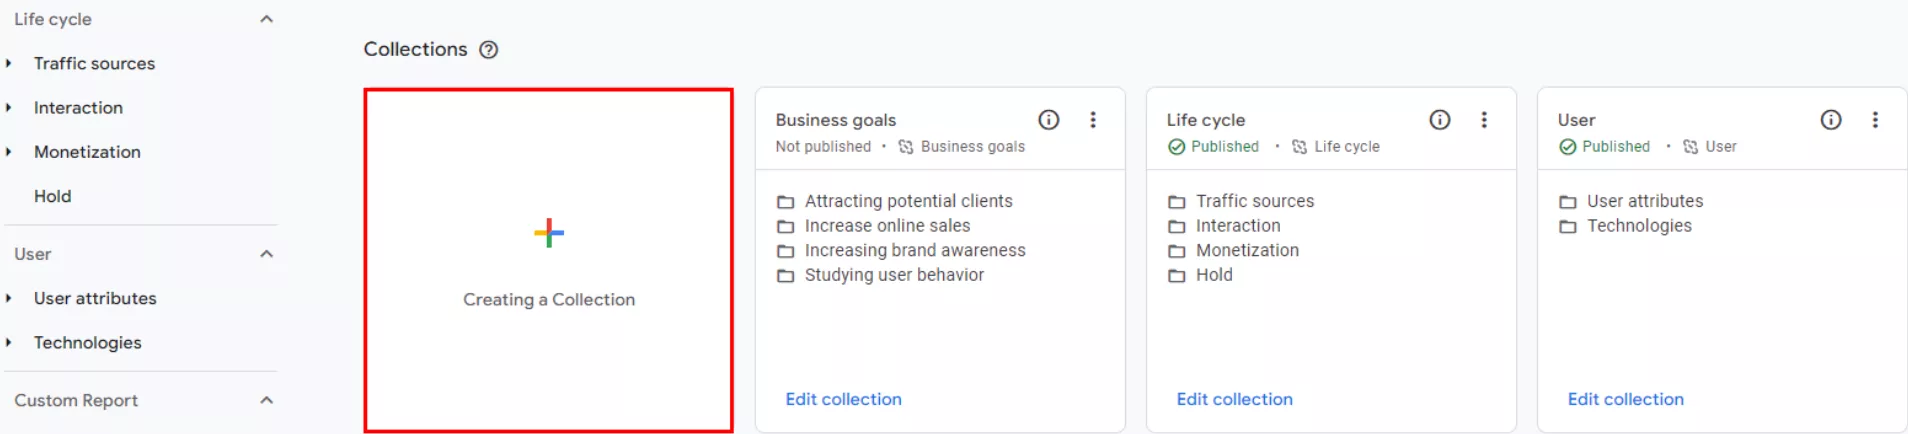
Go to the collection settings and set a name for the collection, e.g., Custom reports. Then, create a topic and name it.
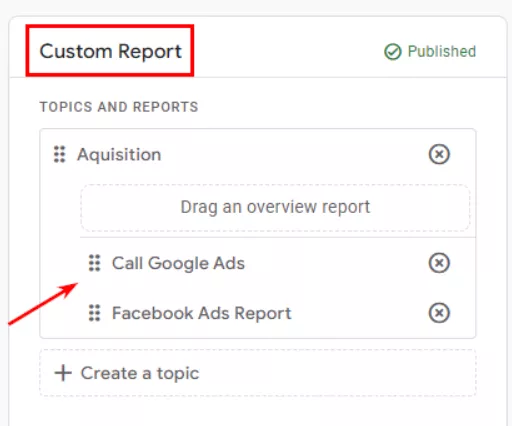
You can now add emoticons to your report titles. This is optional, but it could be useful as it allows you to visually highlight certain reports.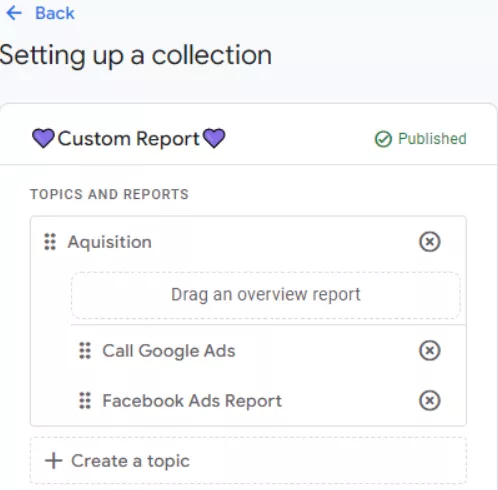
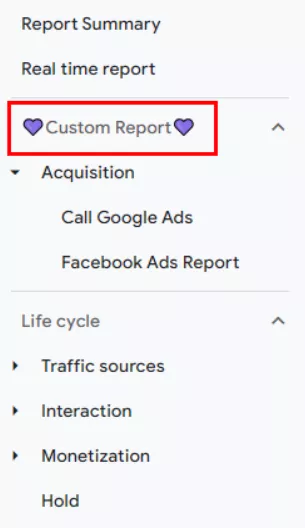
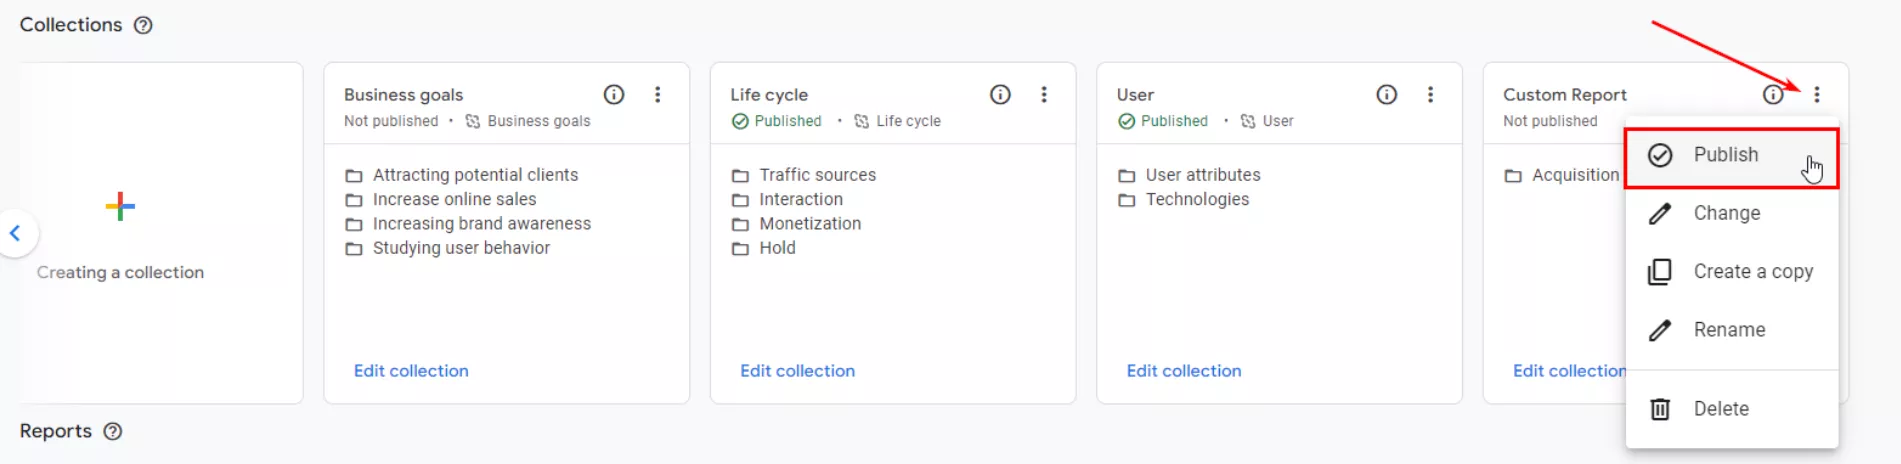
To quickly and easily find a new report, you can customize its appearance in the left navigation menu of the Google Analytics 4 interface. Click on the three-dot icon next to the collection and select Publish.

Once the status of the collection changes to Published, it appears on the left side of the report list.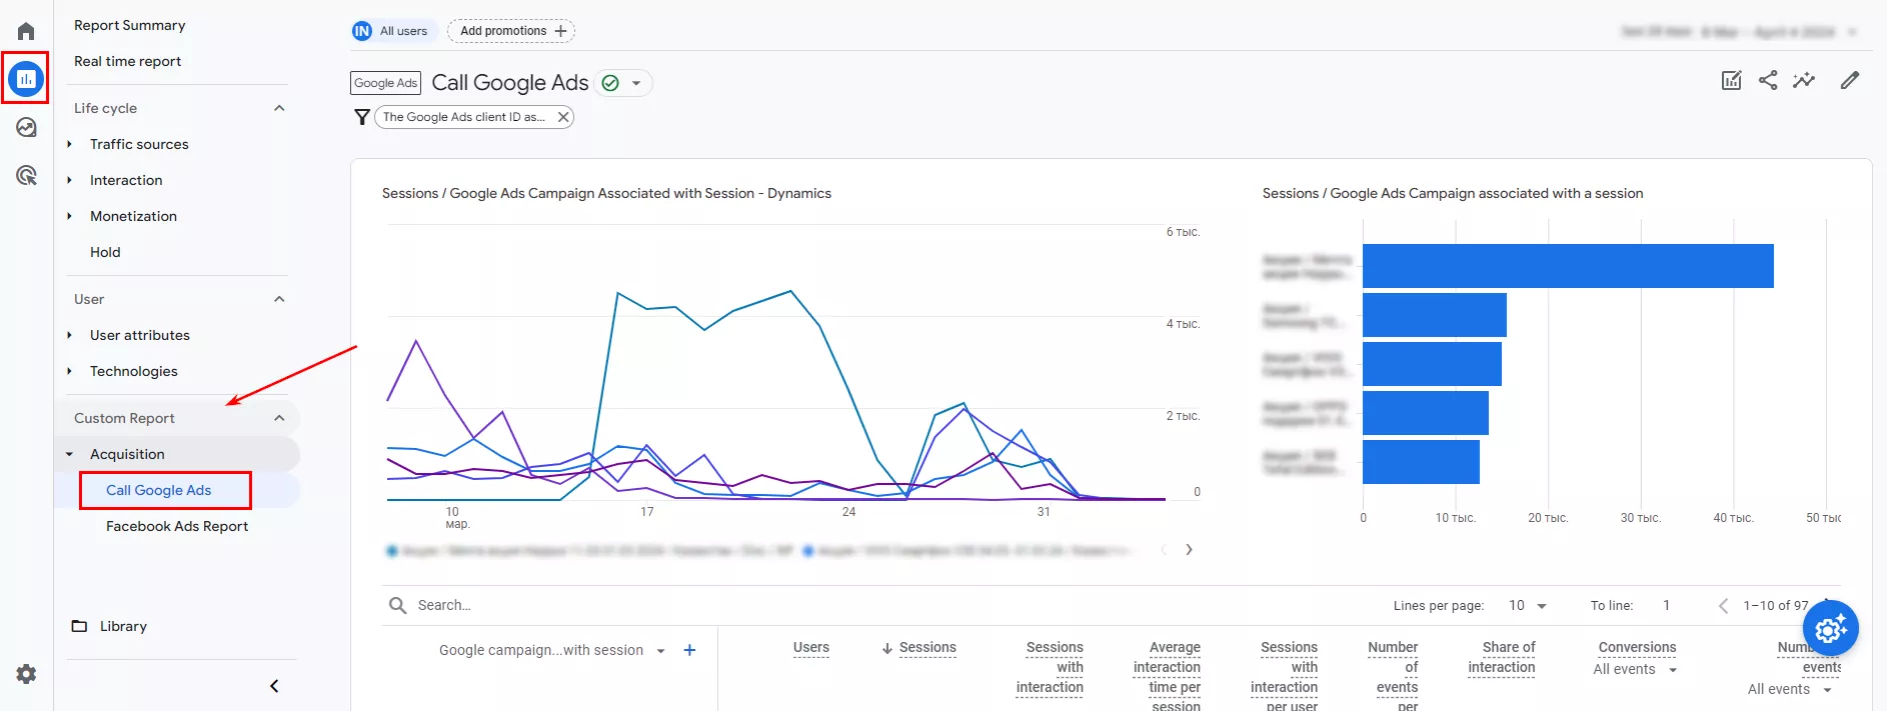
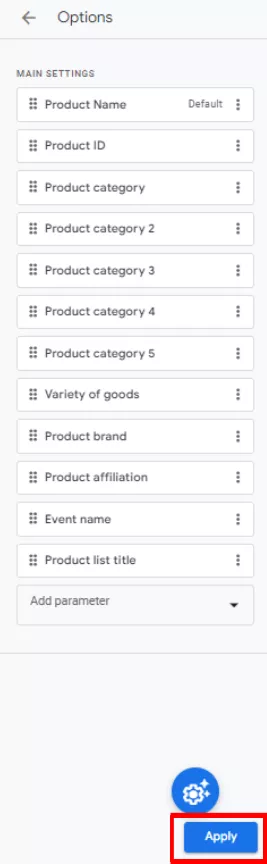
E-commerce report or product name report
This is a standard detailed report. It contains information about the products or services you sell in your online store.
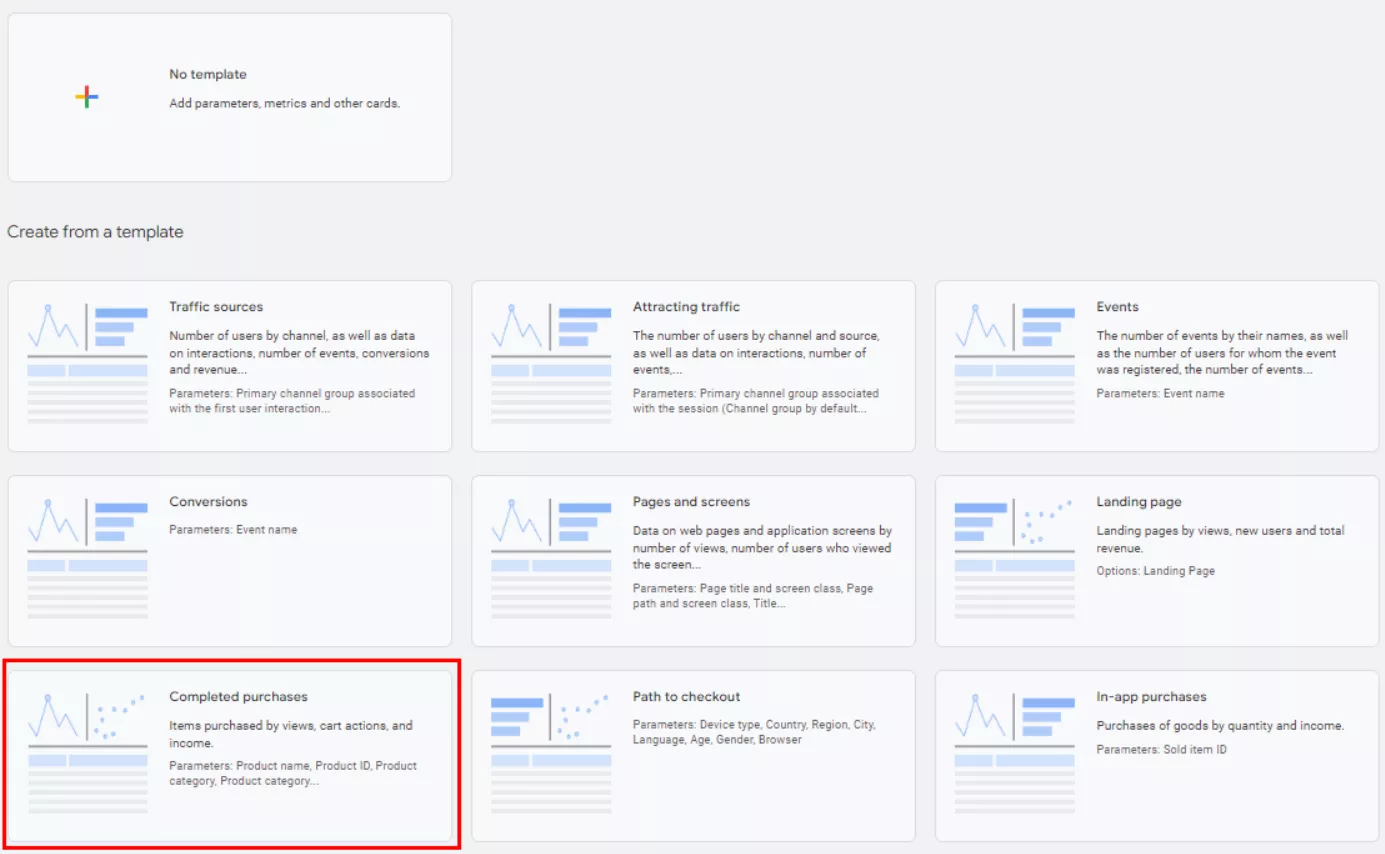
To check the products that have been purchased or added to the shopping cart, create a detailed report using the Completed purchases template.
- Go to Library and select Create detailed report.
- Go to the Completed purchases template.
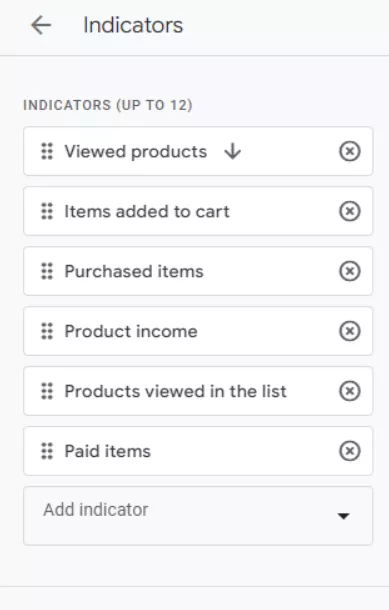
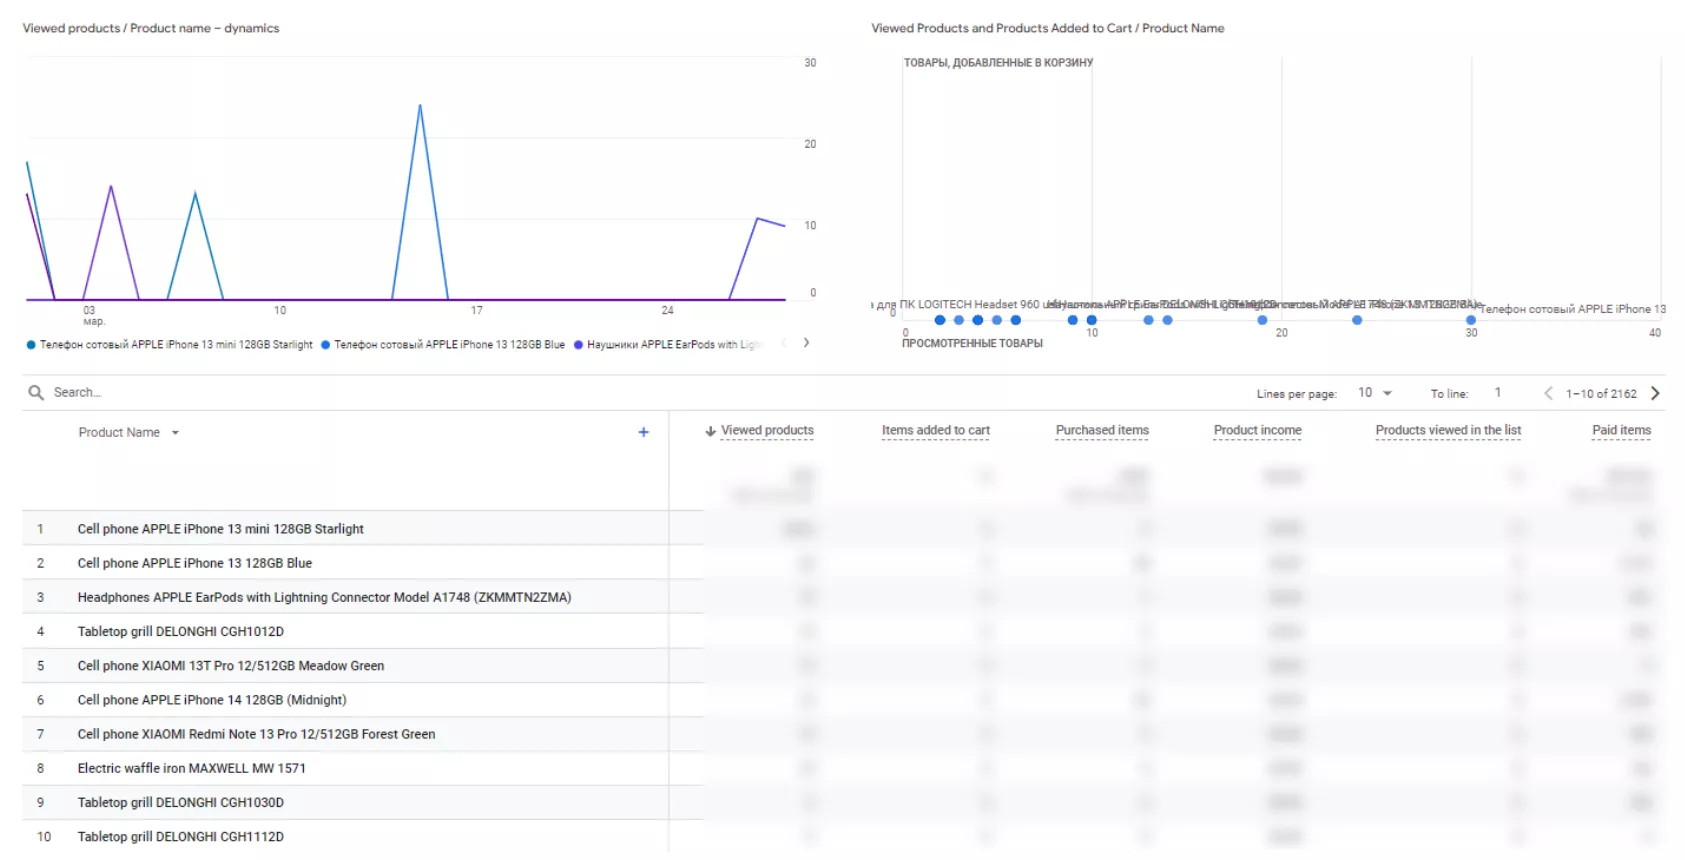
- It then opens a report with product names and detailed statistics on:
- Purchased items
- Items viewed
- Items added to cart
- Product income

You can also add metrics to the report.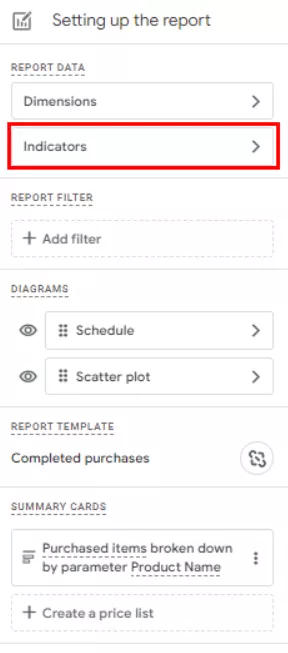
- The report is created. Save it.
Conclusions
- The new GA4 data model focuses on privacy. Compared to Universal Analytics, it has fewer standard reports, but now there are more customizations to extract useful information from website traffic data.
- Google Analytics 4 still has standard reports with basic metrics, while you can create a custom report to meet the goals and needs of any business. It also offers summary and detailed reports based on building logic.
- The functionality of Google Analytics 4 allows you to work with calculated metrics. These are manually created metrics that are calculated using formulas based on existing Google Analytics data.
- PPC uses three basic reports that can be manually created for specific tasks with the required indicators and parameters: Facebook reports, Google Ads reports, and e-commerce reports.
- GA4 reports will help you monitor traffic, analyze information, and learn more about users and their actions.
- The analytics possibilities are almost limitless. Creating your own GA4 metrics can be a powerful way for you to customize analytics and provide better value to customers.

 2
2
 2
2
 0
0
Recommended theme posts
Related Articles
Display Advertising Effectiveness Analysis: A Comprehensive Approach to Measuring Its Impact
In this article, I will explain why you shouldn’t underestimate display advertising and how to analyze its impact using Google Analytics 4
Generative Engine Optimization: What Businesses Get From Ranking in SearchGPT
Companies that master SearchGPT SEO and generative engine optimization will capture high-intent traffic from users seeking direct, authoritative answers
From Generic to Iconic: 100 Statistics on Amazon Marketing for Fashion Brands
While traditional fashion retailers were still figuring out e-commerce, one company quietly revolutionized how U.S. consumers shop for everything from workout gear to wedding dresses