The effective use of end-to-end analytics allows you to maximize your advertising budget and implement successful marketing strategies. In the long run, you will achieve a high level of profitability. In this article, I will explain end-to-end analytics, who needs it, and how it works.
What is end-to-end analytics?
End-to-end analytics is a tool that helps companies understand how their customers interact with them from start to finish. It allows you to make better advertising and service decisions by combining and analyzing data from multiple sources, such as online advertising and customer data.
- With end-to-end analytics, companies can measure the performance of their advertising campaigns and see which ones are working best. They will then understand how to spend their advertising budget better to attract more customers and increase profits.
- From a marketing perspective, end-to-end analytics plays a key role in monitoring the results of marketing strategies and the efficient use of advertising budgets. This approach involves collecting and integrating data from multiple sources, including Google Ads, Facebook, Google Analytics 4, CRM, app analytics services and other tools.
- End-to-end analytics gives marketers a comprehensive overview of the impact of different marketing campaigns and channels on customer behavior and conversions. By analyzing this data, they can determine which channels and advertising strategies are producing results and which need to be optimized.
Who will benefit from end-to-end analytics?
- Online stores. With end-to-end analytics, online store owners can understand customer behavior on the site, identify popular products and services, optimize the sales funnel, and improve the effectiveness of marketing campaigns. Subsequently, customer offers can be personalized to increase conversion rates.
- B2B companies. It helps B2B companies understand how business partners interact with products or services and identify opportunities to increase collaboration efficiency and improve customer relationships.
- Software as a Service (SaaS) companies. End-to-end analytics can track the user experience and analyze how customers use the software. This will allow SaaS companies to understand how to improve the product, attract new users, and retain existing ones.
- Retail chains and stores. End-to-end analytics is a tool for tracking customer data, sales, advertising campaigns, and more. It helps identify popular products, effective marketing channels, and lucrative investments.
- Financial institutions. It is useful for banks, insurance companies, and so on. It can analyze financial transactions, store information about customers and their behavior, detect fraud, and ensure a balanced approach to risk management.
- Social media platforms. End-to-end analytics helps platforms analyze user interaction with social media pages and ads. It reveals the content and ads that most engage their viewers and how to improve interactions with them.
In general, end-to-end analytics is a useful tool for any business looking to optimize operations, improve sales and customer satisfaction, reduce costs, and make informed decisions.
How end-to-end analytics works
The main goal of end-to-end analytics is to automate data analysis to understand how users interact with a brand, product, or service at all stages — from first contact to checkout.
The end-to-end analysis includes the following steps.
1. Data collection. All data related to customer interaction with the brand, products, or services is collected from a variety of sources:
- web analytics tools (Google Analytics 4);
- advertising sources;
- CRM systems and databases on the business side.
This data is uploaded to a single central repository.
2. Data aggregation. Data from multiple sources is aggregated into tables or data dashboards, where it is combined and stored in a structured format. This gives you an overall picture of how users interact with the brand across different platforms and channels.
3. Output reports and graphs. Once aggregated, the data is analyzed, and the results are presented in reports and visual charts. These will reveal the key trends, statistics, insights, and interdependencies in an easy-to-understand manner, which will help you make effective decisions.
Read more in our case study: End-to-End Analytics for Retail: How Netpeak Specialists Implement It.
Data aggregation tools for end-to-end analytics
There are many approaches to end-to-end analytics, and each has its own benefits and limitations. Let's look at some of them.
Manual end-to-end analytics
This approach is mainly used by small businesses or companies with small amounts of data. Data is collected and analyzed manually using spreadsheets, formulas, and macros. While manual analytics can be free of charge, it is limited in flexibility and requires manual report updating.
Services that provide end-to-end analytics
This type of service provides end-to-end analytics tools that are easy to set up and use. They offer a specific set of features and reports that make them ideal for midsize businesses.
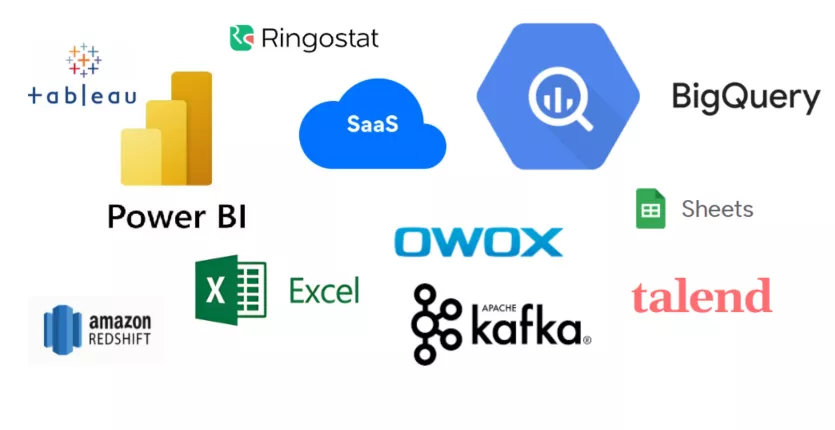
Owox
The Owox platform helps companies solve end-to-end analytics tasks but is not a full-fledged end-to-end analytics service. However, it has enough functionality to serve as a useful aggregator tool for data collection.
The main function of Owox is to collect data from multiple sources, such as websites, mobile applications, social networks, and advertising channels, and combine them into a single repository. This allows companies to get a complete picture of their customers, as well as their contact information, interaction history, preferences, and behavior.
However, for detailed and efficient end-to-end analytics, the company must customize the data collection process and link it to other analytical tools or CRM systems. This may require additional effort and technical support from Owox or other specialized companies.
Ringostat
Ringostat is a multifunctional call tracking, CRM, and analytics platform that helps companies automate data analysis and improve the efficiency of sales, marketing, and customer service.
One of the key features of Ringostat is end-to-end data analysis. It allows companies to get a complete set of information about their customers (contact details and interaction history) from CRM systems, track their sales performance and identify areas for improvement, and get a general overview of their business.
However, Ringostat can be somewhat limited in integrating with some tools and CRM systems as a SaaS approach. Synchronization is only available for a specific list of sources, and you are limited to the reports provided by the user interface.
Custom business intelligence (BI) solutions
These solutions are tailored to meet specific business needs. This is the most powerful and flexible of all approaches, but it can be costly to implement. Custom solutions often involve integrating various tools, such as Google BigQuery, OWOX, Power BI, and CRM systems.
They allow you to process large amounts of complex data and visualize it in various formats. The big advantage of customer BI solutions is flexibility, as you can create any report or visualization you want.
Such solutions allow you to use data to create advertising audiences, which makes them valuable for effective marketing strategies. Although developing a custom solution is more expensive, it will significantly increase your company's productivity and profitability in the long run.
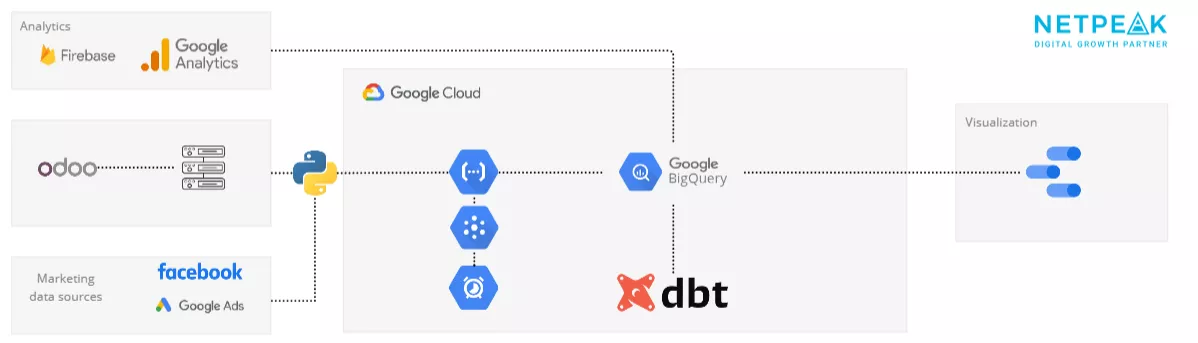
How to create a customized end-to-end analytics solution
In a custom analytics solution, a complex set of tools is needed, and each of them plays a specific role. For example, Google BigQuery is used as a central data repository, and tools such as Looker Studio, Power BI, and others are used to visualize the results. This approach allows you to optimally combine various tools for collecting, storing, processing, and further interpreting data in the form of visualizations.
There are several steps to creating a customized end-to-end analytics solution.
1. Set the goal.
You need to understand what you want to achieve with end-to-end analytics, whether it is to gain a better understanding of your customers, improve the effectiveness of your marketing campaigns, or increase customer satisfaction.
The goal is determined through a user survey, where clients are asked about their KPIs and the indicators and current reports they use in their work. Based on the answers to these questions, we determine the exact details and the next steps in implementing end-to-end analytics.
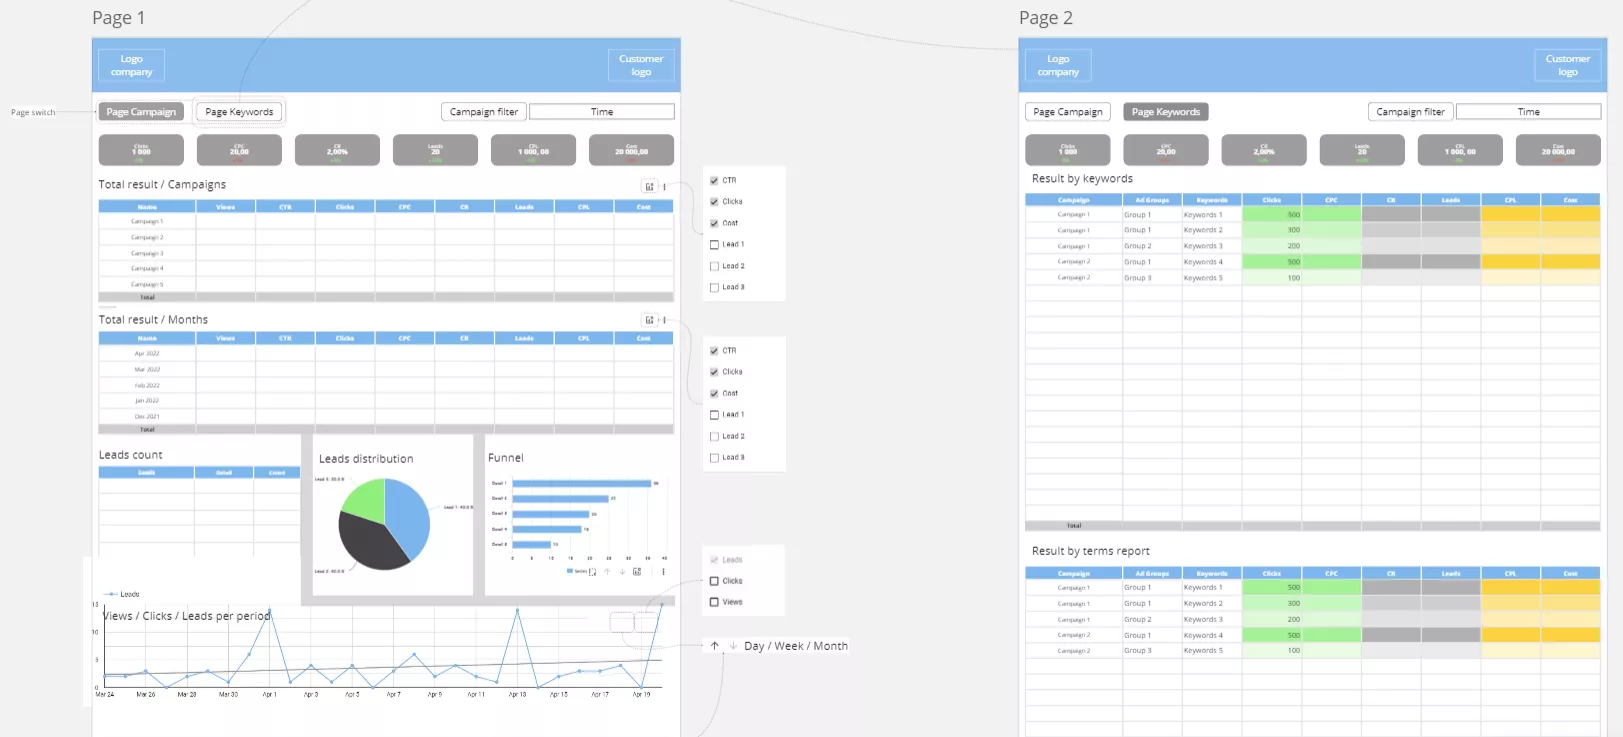
2. Design layouts.
An important stage is the design of dashboard layouts; these are interactive interfaces that help users quickly perceive information and analyze indicators. The dashboard layout design should take into account the needs of end users. The interface should be user-friendly and intuitive, allowing users to interact with data at different levels of detail.
3. Identify the data sources that need to be combined.
The next step is understanding what data needs to be combined to achieve the goal. For instance, you may want to use information from the CRM, e-commerce, and customer relationship management systems. Keep in mind that the collected data must be relevant and reliable.
4. Choose a method for combining data.
A centralized data repository will enable you to easily access and analyze information from multiple sources. Alternatively, you can use a data visualization tool to create graphs and charts to help you understand your data.
5. Create reports and dashboards.
Reports will help you visualize data and present it to others. Reports can be designed for different purposes, such as tracking marketing campaign effectiveness, identifying customer experience problems, or analyzing sales trends. On the other hand, dashboards will provide a more convenient visual representation of data for general overview purposes or monitoring specific indicators.
Benefits of a custom BI solution
1. Increase profitability.
By collecting data on costs and revenue, you can identify profitable or unprofitable areas and find ways to reduce costs. For example, with end-to-end custom BI analytics, you can:
- track the effectiveness of marketing budget allocations;
- determine which advertising campaigns are more cost-effective and successful;
- identify ineffective advertising solutions that are not delivering the expected results.
Knowing this information allows you to reallocate the budget to focus on winning strategies.
2. Understand your customers better.
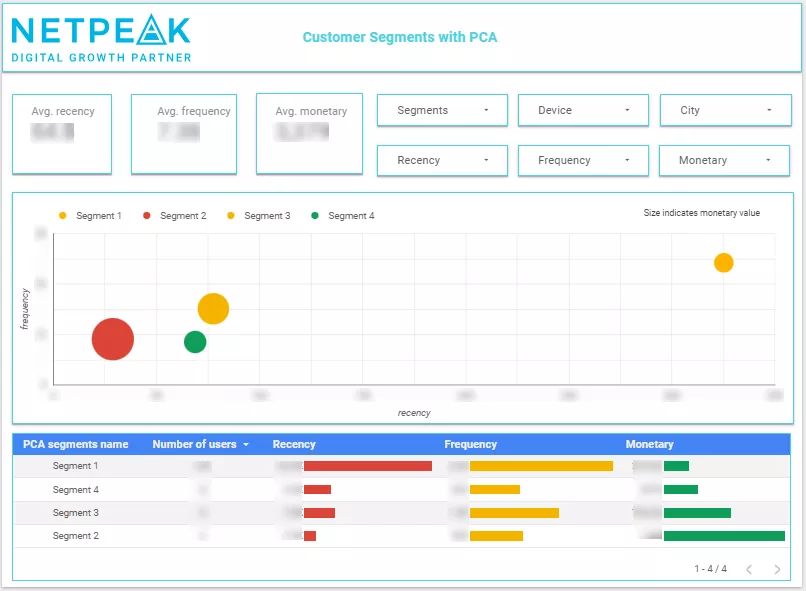
Not many people know that Google BigQuery is also used to analyze advertising audiences, namely in automatic RFM analysis.
RFM (recency, frequency, monetary) is a method used to segment customers based on their activity. The ease of understanding RFM analysis lies in the simplicity of the metrics: the time of the last purchase (recency), the number of purchases in a given period (frequency), and the amount spent (monetary). These metrics are simple to collect and understand.
Customer segmentation with RFM analysis uses customer activity to divide them into groups.
- Active customers are those who make frequent purchases and spend a lot of money.
- Dormant customers refer to customers who have not made a purchase in a long time.
- New customers are those who made a purchase but never returned.
Next, this data can be uploaded and used as advertising audiences. This would boost the effectiveness of advertising campaigns, improve customer service, and increase overall sales.
3. Increase conversion rates and improve customer service.
Two points are emphasized here because collecting and analyzing data from each stage of the customer interaction process can help identify weaknesses in the purchasing journey. If you have a low conversion rate at one of the stages, you should analyze possible problems or issues that customers are facing. This will allow you to:
- make a decision on how to resolve the issues;
- optimize the sales funnel to increase the conversion rate;
- improve the quality of customer service.
4. Implement real-time decision-making.
End-to-end analytics allows you to receive and analyze data in real-time, so you can promptly make informed decisions based on the data.
5. Improve strategic decisions.
Using the data obtained through end-to-end analytics, companies can build more effective development strategies to increase competitiveness and ensure market success.
These benefits help companies automate their processes, attract more customers, increase customer loyalty, improve the quality of products and services, and optimize internal processes to ensure business efficiency and success.
How to use Google Analytics 4 with Google BigQuery
Using Google Analytics 4 together with Google BigQuery is a key strategy that will separate truly meaningful and useful data from unnecessary information.
Collecting and preprocessing data in GA4 before uploading it to GBQ allows for more accurate and comprehensive analysis. GA4 will automatically collect data from different sources, link them, and create more detailed and contextual reports that can be useful for further analysis in GBQ.
Since GBQ is a paid service, it is important to use it efficiently to avoid unnecessary costs. To do so, structure the data correctly, use optimal queries, and prioritize the quality of the analysis.
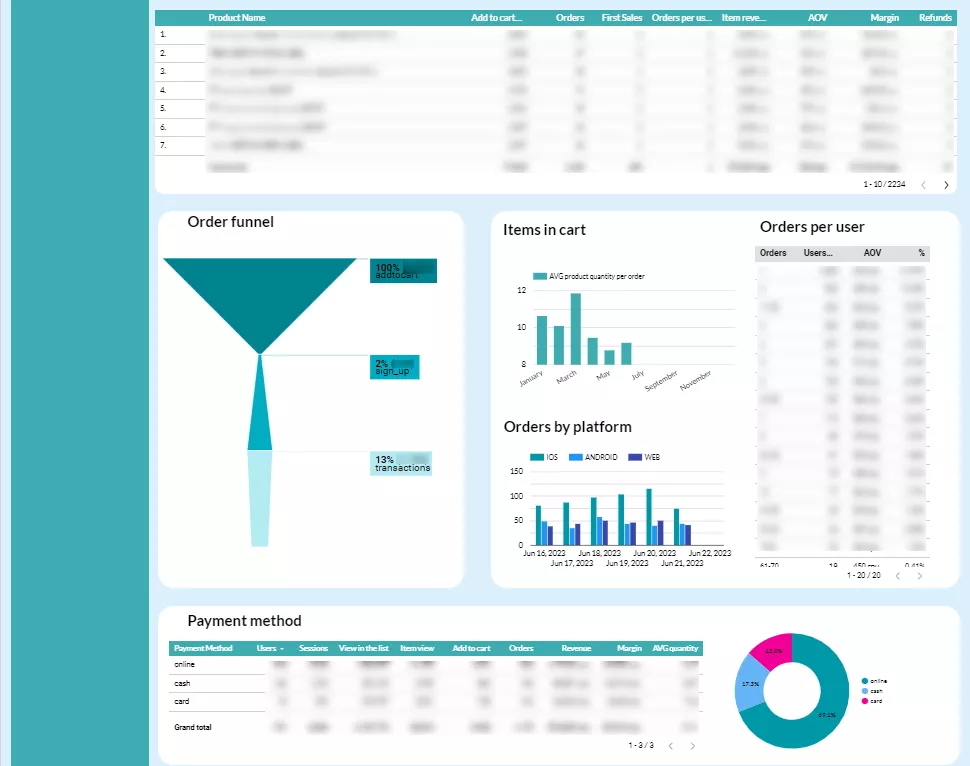
With end-to-end analytics tools, you can create a compact yet informative report that allows you to:
- see the most popular payment methods used by users;
- analyze the bestselling products;
- identify problematic items with high return rates;
- evaluate the seasonality of products to understand when to increase inventory levels;
- determine at what stage or on what platform there are bottlenecks in user interaction with the site, allowing you to optimize the interface and make it more user-friendly.
Working with these tools requires attention to detail, but the right strategy and best practices will give you the results you want while minimizing costs.
End-to-end analytics implementation costs and time
Often, end-to-end analytics tools are paid tools, which significantly affects the overall cost of the system. For example, Google BigQuery. But if you plan your work properly and use only the necessary functions, costs can be kept within $20 per month or even within the free limit.
At the same time, many factors can influence the cost of end-to-end analytics.
1. Skills and experience. Effective development of an end-to-end analytics system requires specialists who have a variety of skills, including:
- knowledge of SQL, Python, or other programming languages for data processing and analysis;
- the ability to use visualization tools to create clear and informative graphs and charts;
- project organization and management skills to ensure successful implementation and delivery.
2. Teamwork. Creating an end-to-end analytics system often requires a team effort that includes analysts, programmers, project managers, and more. The collaborative efforts of these specialists enable a full cycle of system development and support, which affects the overall cost.
3. Salaries. The skills and experience of specialists involved in creating an end-to-end analytics system are often expensive. So, remuneration for programmers, analysts, project managers, and other team members will significantly increase the overall cost.
Implementation timeframe
Custom end-to-end analytics projects can take anywhere from 2 to 6-7 months on average, depending on several factors.
- Technical requirements. If there are clear technical requirements, the team will start implementing them immediately. If the project is a turnkey project that involves many different business teams, it will take some time to synchronize with them and gain an understanding of the required deliverables.
- The number of data sources that need to be integrated. An experienced team will be able to do this more quickly, but the project's individual requirements always influence the amount of time needed.
- The number of reports needed. If you need to compile many reports, the team would have to do a lot of aggregation within the central data repository.
Conclusions
End-to-end analytics is an important tool for effective management decision-making. Its ability to combine data from multiple sources and provide real-time analysis allows companies to quickly identify trends, understand consumers, and respond to market challenges.
- End-to-end analytics is essential for online stores, B2B and SaaS companies, retail chains and stores, financial institutions, and social media platforms.
- The primary goal of end-to-end analytics is to understand how users interact with a brand from first contact to checkout.
- End-to-end analytics involves collecting data from multiple sources, aggregating it, and presenting it as reports and graphs.
- You can use manual end-to-end analytics, specialized services (Owox, Ringostat), and custom solutions to aggregate data.
- When building a custom analytics solution, you need to set the goal by surveying users, developing dashboard layouts, identifying data sources to combine, choosing a method for combining data, and then creating reports and dashboards.
- Benefits of a customized BI solution: increased profitability, better customer insight, increased conversion, improved customer service, real-time decisions, and improved strategic decisions.
- One of the best end-to-end analytics edits is to use Google Analytics 4 with Google BigQuery.
- The cost of implementing analytics is affected by the fact that effective tools can be paid for, as well as the need to involve a number of specialists.
- The implementation timeframe is affected by the presence or absence of technical requirements, the number of data sources to be integrated, and the number of reports required.
To get a complete picture of your advertising performance across all platforms, our Business Intelligence & Analytics Services can help you unify your marketing data and uncover growth opportunities.

 2
2
 2
2
 0
0
Recommended theme posts
Related Articles
Display Advertising Effectiveness Analysis: A Comprehensive Approach to Measuring Its Impact
In this article, I will explain why you shouldn’t underestimate display advertising and how to analyze its impact using Google Analytics 4
Generative Engine Optimization: What Businesses Get From Ranking in SearchGPT
Companies that master SearchGPT SEO and generative engine optimization will capture high-intent traffic from users seeking direct, authoritative answers
From Generic to Iconic: 100 Statistics on Amazon Marketing for Fashion Brands
While traditional fashion retailers were still figuring out e-commerce, one company quietly revolutionized how U.S. consumers shop for everything from workout gear to wedding dresses