End-to-End Analytics for Retail: How Netpeak Specialists Implement It
Picture a Google Analytics report in one window, Google Ads in the second, and CRM data in the third, and the whole process managed by a marketing specialist trying to put it all together in one spreadsheet. Can you imagine this marketer’s nightmare? This is where end-to-end analytics comes in: one integrated system to efficiently replace all those multiple windows. It allows you to automate processes, allocate budgets properly, and speed up management decision-making.
Let’s talk about the steps, benefits, and processes of end-to-end analytics using one of our client case studies.
Goals of using end-to-end analytics
In this project, our client was a startup that provides retail services through an app and website. The client’s main requirements were to correctly allocate the budget between advertising channels and get automated reports from all the analytics tools involved.
Why are these requirements important?
Getting the marketing budget right
Companies are sometimes concerned that they are allocating their budgets to the wrong channels, not allocating enough funds to marketing, or not fully understanding the effectiveness of the channels they are using. Often, businesses simply cannot analyze these aspects using existing analytical tools.
Process automation and time savings
If you have a system that keeps track of all your analytics, your team doesn’t have to spend time creating manual reports. Another advantage is that automated reports are updated faster than manual reports, at least every day, if not several times a day. Think about automation like streaming data, i.e., it will allow you to respond to a request instantly.
Better decision-making speeds
With end-to-end analytics, you can react faster: if something goes wrong, you will see the problem earlier and fix it without waiting for a weekly report. This applies to all management decisions, not just marketing, but also logistics, HR, or inventory accounting. All employees will have an environment where they can see the results of their work and report any issues to the manager.
Creating personalized recommendations for users
When you have a common environment that contains all the data with ease, you can segment the information and conduct user research with ease.
For example, with a database and a history of user actions, you can build a recommendation system on your website to make personalized offers to your customers. Essentially, you can process a list of products and pass it to the website or app developers. As a result, the user will see personalized offers and recommendations on the website.
Alternatively, you can use product segmentation. Based on the purchase histories of different customers, you can determine what they buy most often and offer to complement their purchases with those products at checkout.
Stages of implementing end-to-end analytics
Our client adopted a data-driven approach: they needed analytics from the start of their business, so they decided to implement end-to-end analytics.
There are three main stages to this process.
Stage 1: Database closure
Database closure here refers to the customization of current analytical systems.
Let me remind you that we were working with both app and website data in this project.
The client used Google Analytics 4 to get data from the website and the app. Here’s how it works: GA4 has a Firebase module for the app, and we set up the analytics with it. The same Google Analytics 4 is also used for the website, and this is the one that combines the data.
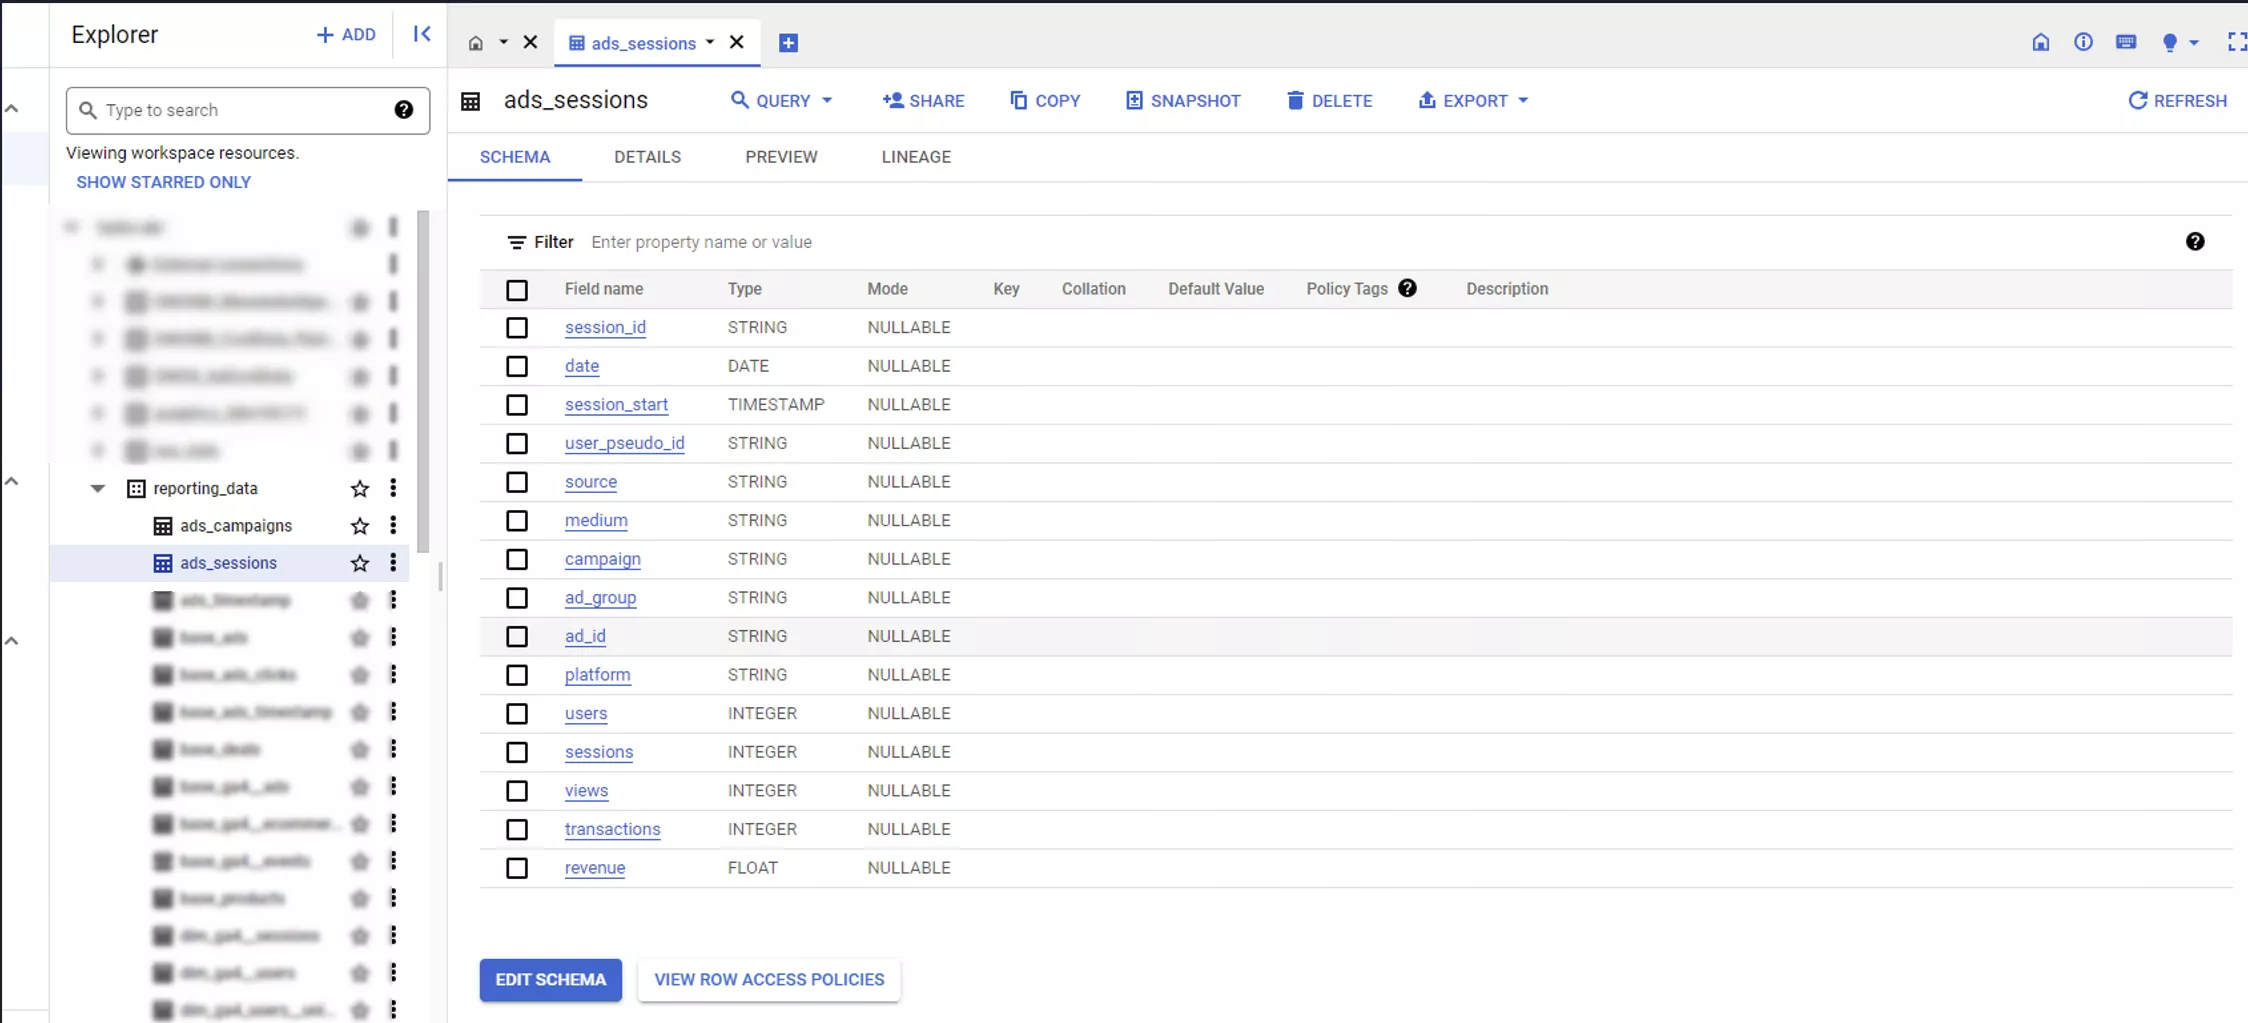
Closing the database means setting up all the necessary e-commerce events for the website and app and, therefore, for the Google Analytics 4 account itself.
E-commerce events include all user actions on your website or app. This data allows you to track and analyze in detail information about purchases, financial transactions, and user behavior in general.
We set up all the events for the website and the app, such as product clicks, product views, add to cart, checkout steps, and transactions. We also created a document containing technical requirements for the front-end developer. He implemented it on the website, and we verified that the event-tracking functionality worked correctly.
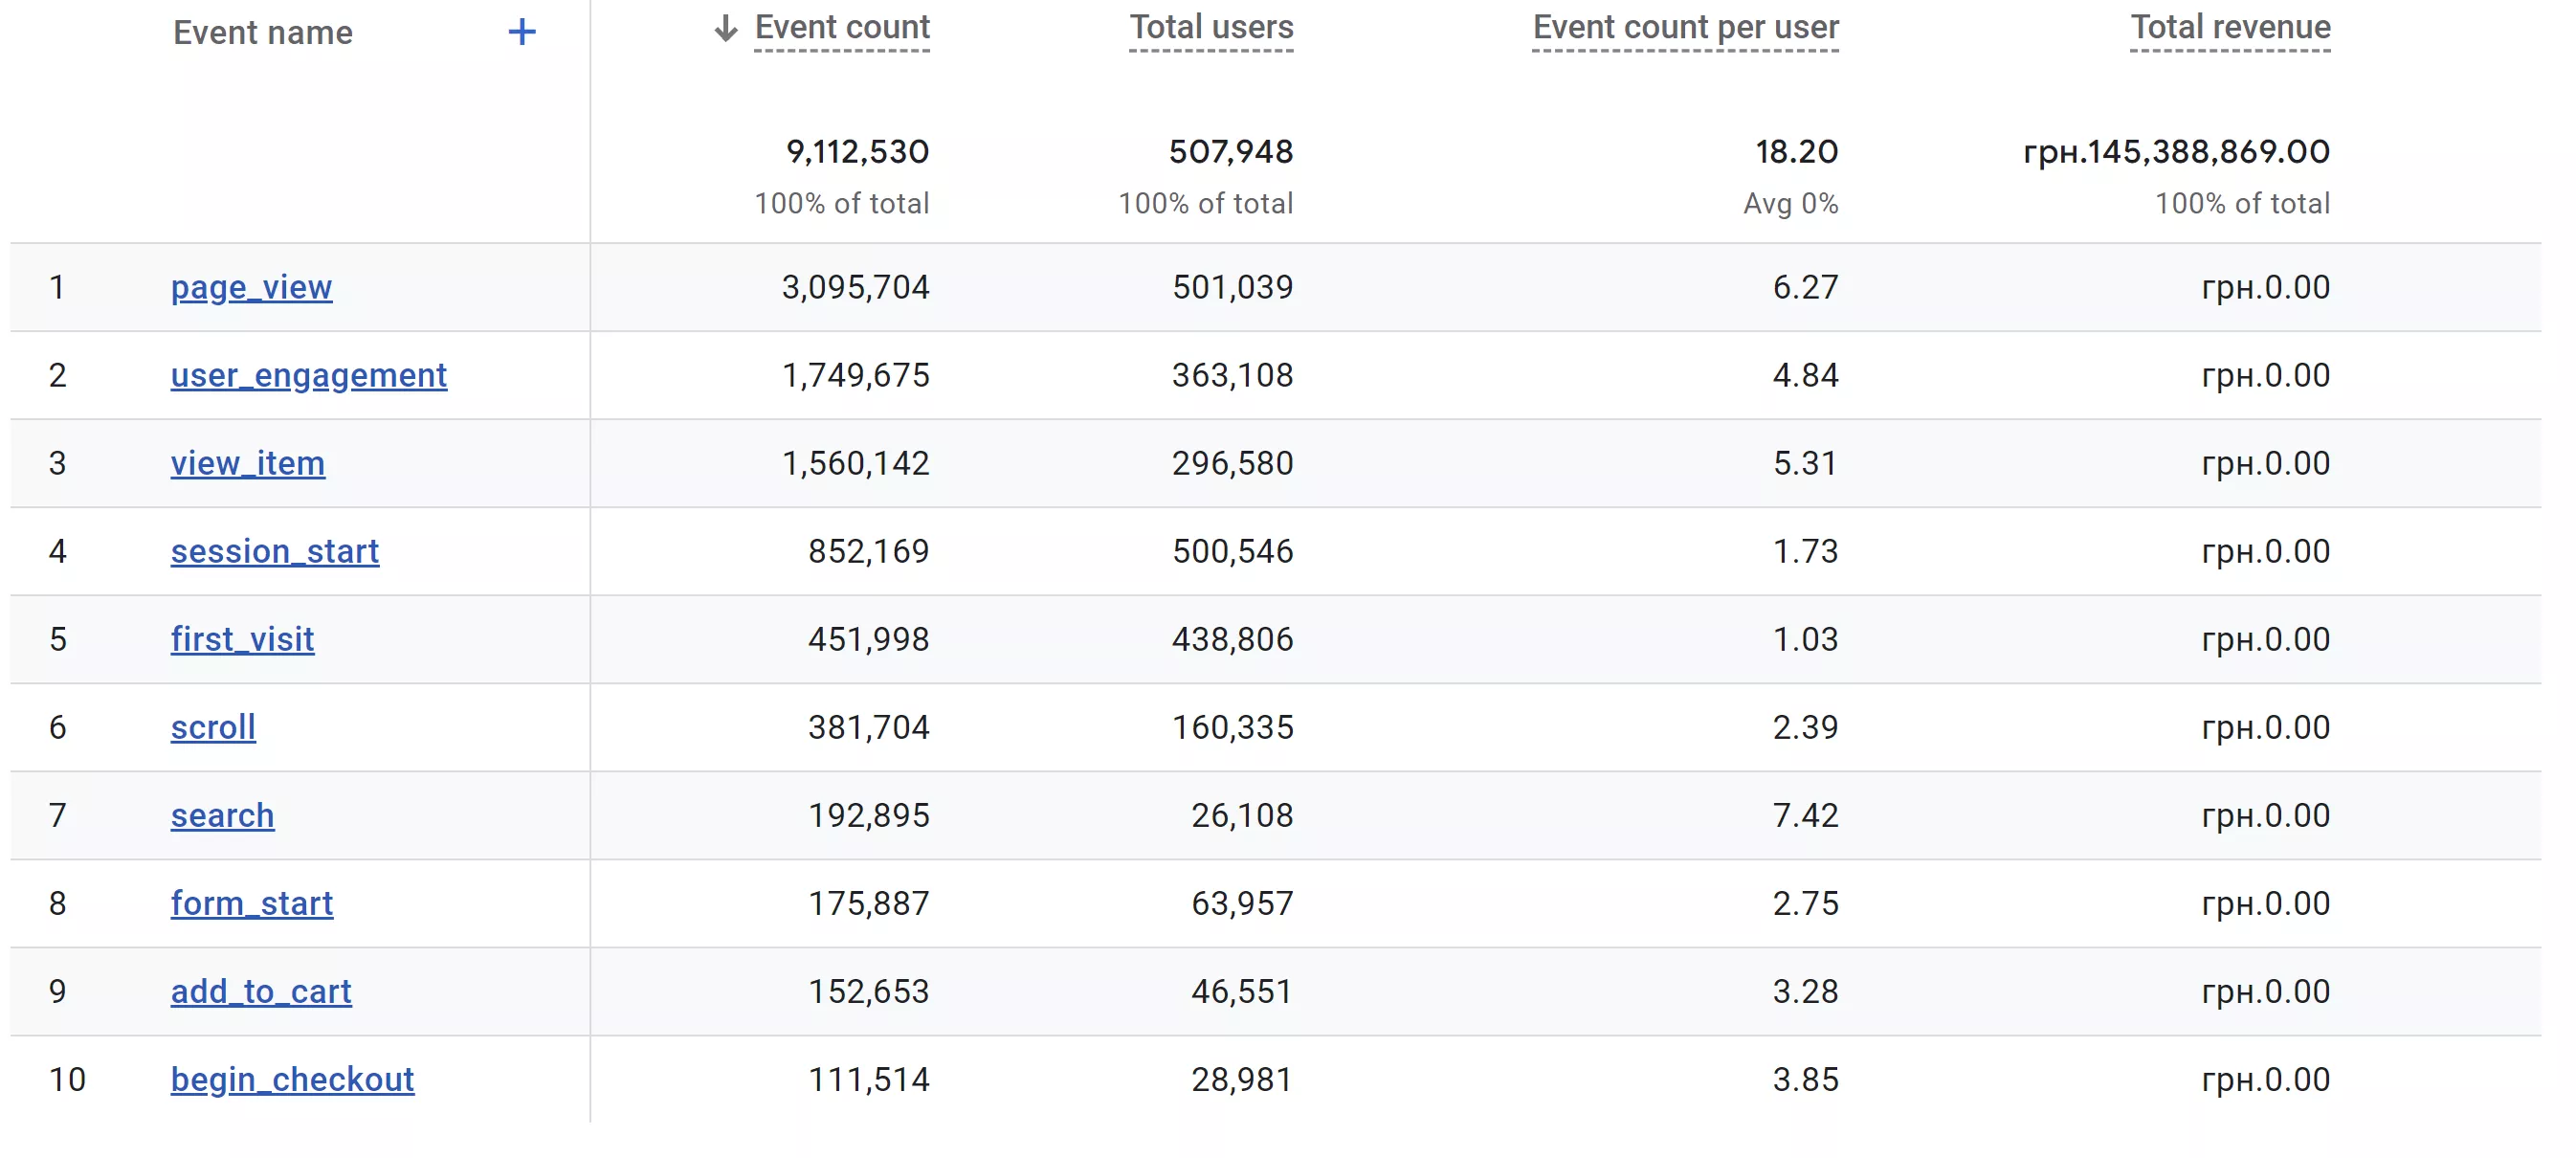
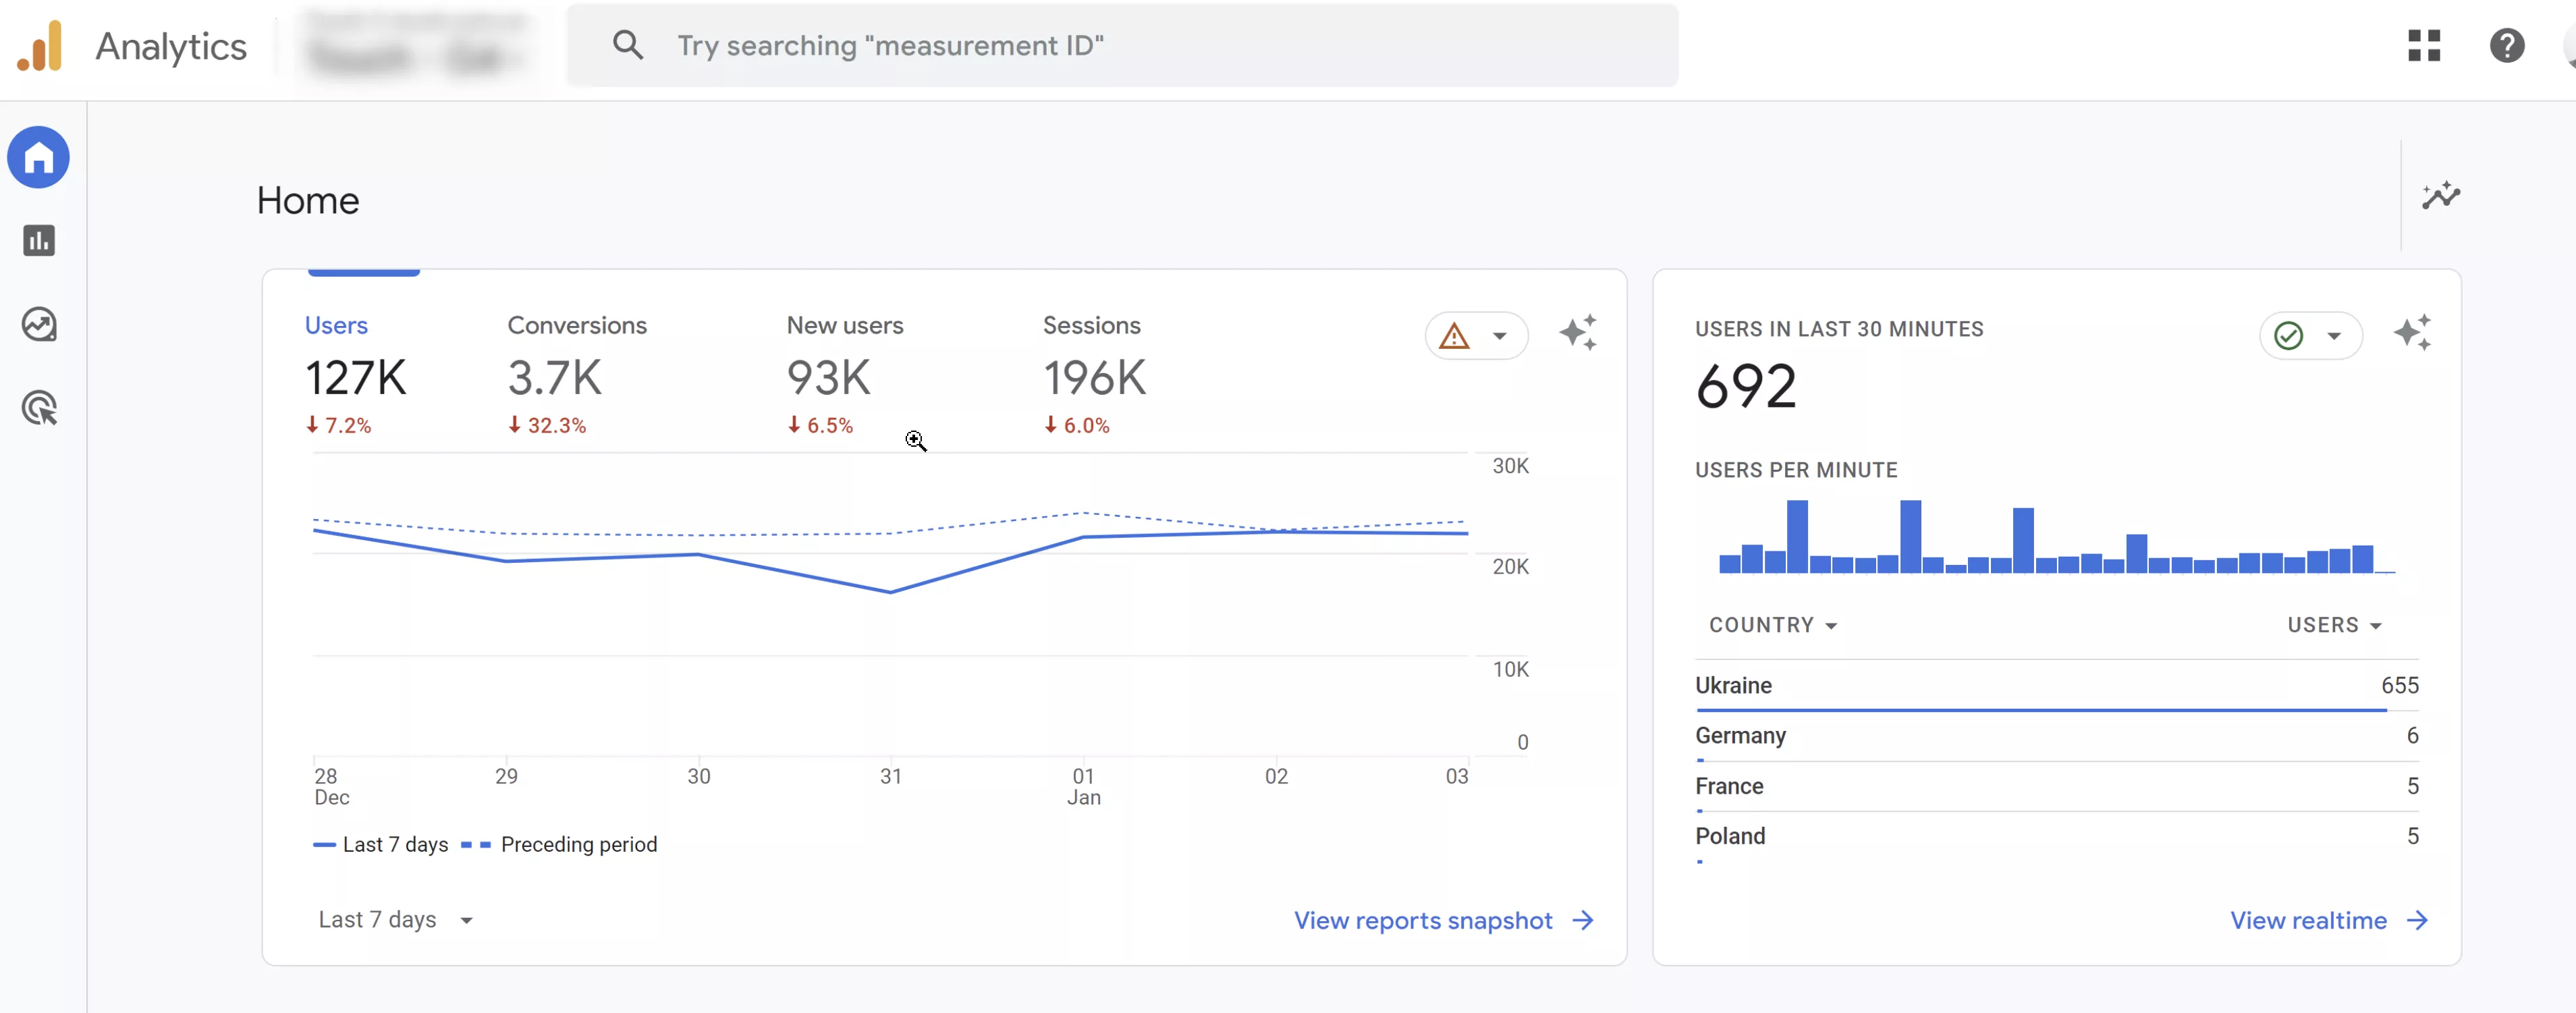
The screenshot shows a GA4 report based on the results of e-commerce events setup
Stage 2: Creating an analytical solution design
This stage can be roughly divided into two steps.
1. Selecting tools to create a report layout
Why does tool selection matter?
- The end result of end-to-end analytics must meet the client’s objectives.
- The data representation in the reports should be flexible and scalable enough to allow us to add data sources and reports.
- It allows us to use the reports for a long time without redesigning the entire layout architecture.
We also have to consider the predictive aspect, which means we have to anticipate future changes in the tool’s functionality and how that will affect our decisions. For example, while we were preparing the report design, the Universal Analytics service was still active. But we already knew that the tool would be unavailable in the near future, so there was no point in using it.
You must plan ahead to ensure that the analytics solution will work for years to come while still meeting the current trends in data engineering and data analytics.
For our client, we chose the following report structure:
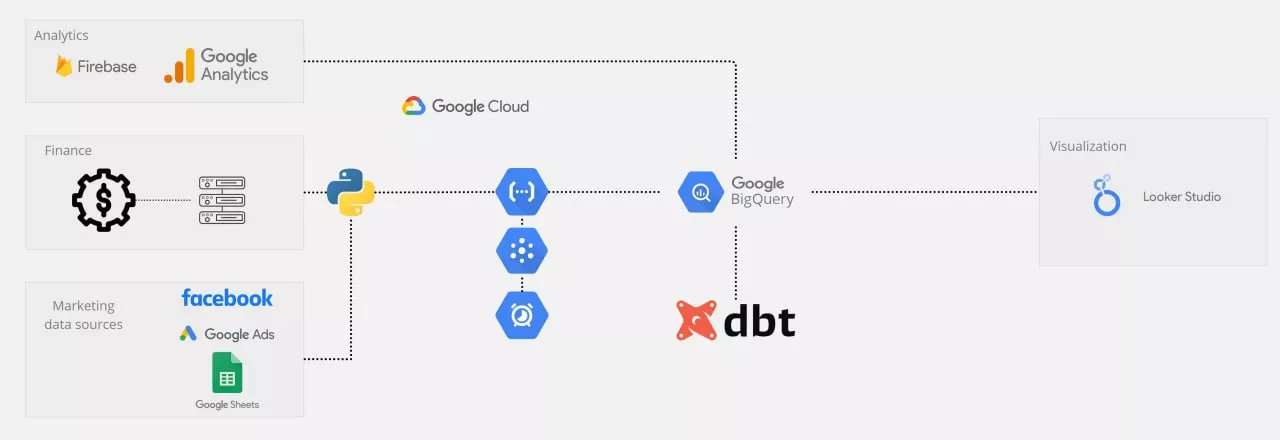
- Google BigQuery is a cloud database built specifically for analytical purposes. It acts as a central data warehouse and requires no support, scaling on its own as needed.
- You can export raw app and website data from Google Analytics to this database on a daily basis for free.
- For advertising sources, we created a special connector in the form of a Python code that exports data from Google Ads and Facebook on a daily basis.
- For the financial data program, we provided an intermediate integration, which was a server that received the necessary reports daily. Then, a separate connector collected them into the central data warehouse.
- Next, all the data was combined and aggregated in the storage. To do this, we used the DBT service, which allows you to effectively manage a project that contains a lot of SQL (a programming language for user interaction with databases). Finally, the data was connected to the Looker Studio visualizer, where the final reports were generated.
This setup can be used for years. As an added perk, all of these tools cost no more than five dollars a month to maintain.
2. Report design approval
Our next task was to get enough information from the client so that we could develop an intuitive and useful design for the report. This can be easily achieved through effective communication and workshops.
To do this, we provided the client with a comprehensive survey that was divided into sections. It includes questions about annual, monthly, or weekly KPIs. The document also helps us understand the type of reporting the client does, what information is sufficient, and what information is insufficient to make a decision.
The client’s team answered the questions according to their areas of specialization. We then met to go over all the answers in detail.
Once we had all the necessary information, we created report layouts in Miro Board. This is where we designed the look and feel of the reports.
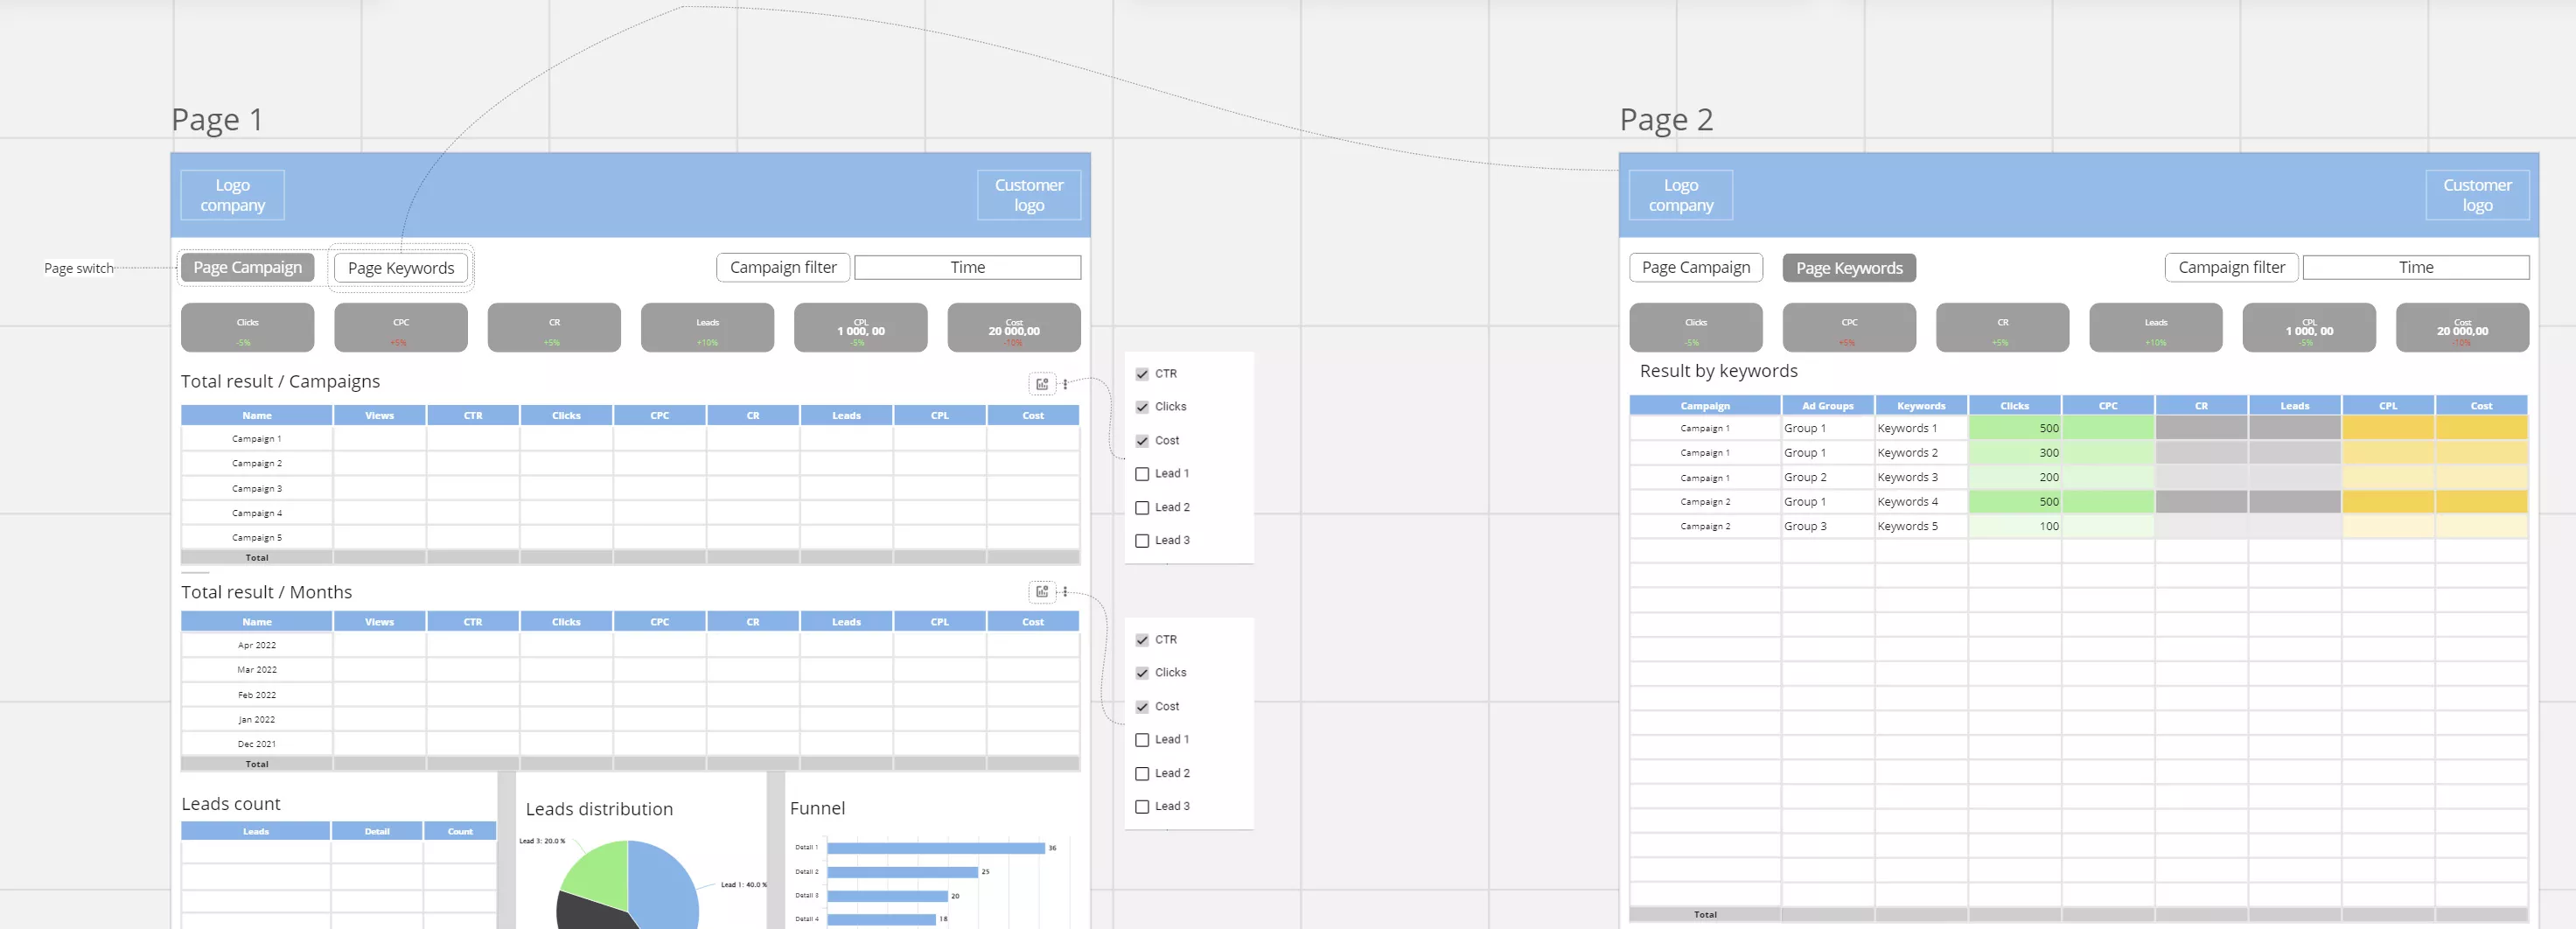
Finally, all the information was collected in the final technical requirements document, including detailed solution diagrams, tool blocks, and data export paths described by the KPIs.
Stage 3: Implementation
We integrated Google Ads, Facebook, and Google Analytics 4 with Google BigQuery.
Then, within Google BigQuery, we combined and aggregated everything into single data windows. These pre-built dashboards contained all the KPIs and indicators we agreed upon with the client.
The biggest challenge at this stage is building attribution. The fact is that all data is exported based on the last click. However, it is a common assumption that analyzing advertising channels and activities by last click is wrong. This is because after viewing an ad, users may perform a few more actions, even click out of the ad, and eventually become customers through a number of channels.
Therefore, it is necessary to:
- define the parameters by which an ad channel is considered to have generated a conversion;
- determine how to allocate the conversion value across all channels in the user’s history.
In this case, we were asked to use the standard Last Non-Direct Click model, meaning the value is given to the last indirect channel. This is the principle we built into the data aggregation stage. However, this issue can be approached more flexibly, and attribution models can be developed for specific cases and businesses.
In the final stage, we connected the visualizer and prepared reports for the client on all previously agreed points and indicators.
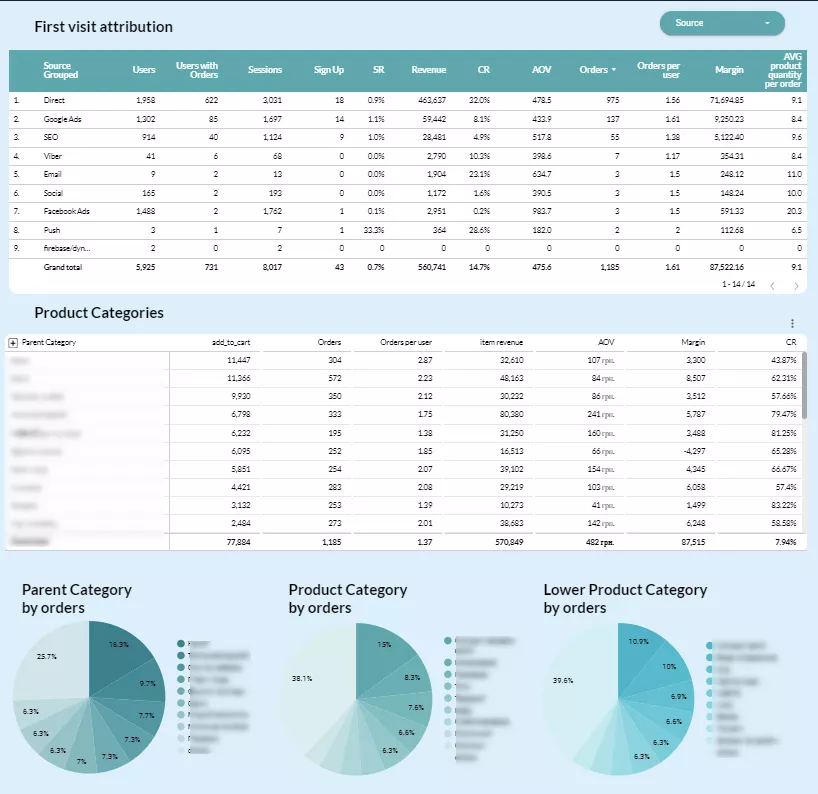
Benefits of end-to-end analytics
The main advantage of end-to-end analytics is that it shows businesses which marketing channels and tools are effective and which are ineffective. Ad campaign optimization can help you save costs or redirect spending from ineffective tools to useful ones.
In this case, our client received a customized margin transfer with each purchase. This provides expanded opportunities for ad campaign optimization and setup. By transferring margin to advertising accounts, you can set up ad campaign training and optimization that is based on the profit the company receives from the sale instead of conversions.
Another benefit is that the central marketing data warehouse allows you to segment customers and create audiences based on any parameter available to your business. You can also transfer these audiences back to the advertising accounts to target them or search for similar users.
What else can end-to-end analytics do?
- Save time and money.
- Monitor contractors or vendors.
- View reports in one interface.
- Get reports quickly for any time interval.
- Analyze in-depth data.
Based on our experience, a detailed approach to cooperating with clients will facilitate the work process. With strong communication and collaboration, end-to-end analytics can be implemented within three to four months.

 2
2
 2
2
 0
0
Recommended theme posts
Related Articles
How to Set Up Consent Mode in GA4 on Your Website with Google Tag Manager
Let's explore how to properly integrate consent mode in GA4, configure it for effective data collection, and at the same time comply with GDPR and other legal regulations
Display Advertising Effectiveness Analysis: A Comprehensive Approach to Measuring Its Impact
In this article, I will explain why you shouldn’t underestimate display advertising and how to analyze its impact using Google Analytics 4
Generative Engine Optimization: What Businesses Get From Ranking in SearchGPT
Companies that master SearchGPT SEO and generative engine optimization will capture high-intent traffic from users seeking direct, authoritative answers