Web analytics is measuring, collecting, analyzing, and reporting web data to understand and optimize web usage. It shows how users interact with the site and helps you make informed decisions to improve efficiency. For digital marketers, web analytics is the key to understanding a web resource.
However, web analytics can be a complex topic with many different elements to consider. For instance, how exactly do you collect analytics data? What indicators should you consider? What are the different types of web analytics? What are the key steps of an analytics strategy?
I will address these questions in detail in this article, so let's get to it.
- What is web analytics?
- Types of web analytics.
- Web analytics strategy steps.
- Basic tools.
- Common metrics and performance indicators.
- Examples of web analytics successful use.
What is web analytics, and why do you need it?
Web analytics will help you get detailed information about the number of visits, unique users, the amount of time users spend on the site, and much more. It allows you to:
- identify traffic sources that bring visitors;
- analyze visitor behavior and their reactions to certain site elements;
- identify the most popular pages and those that get no traffic at all;
- understand how users navigate between website pages and what motivates them to perform a targeted action.
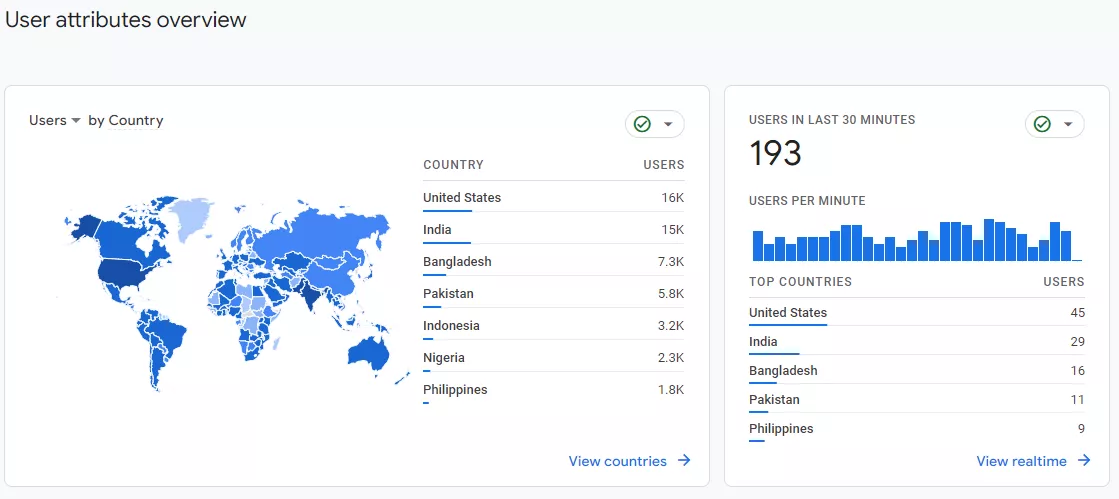
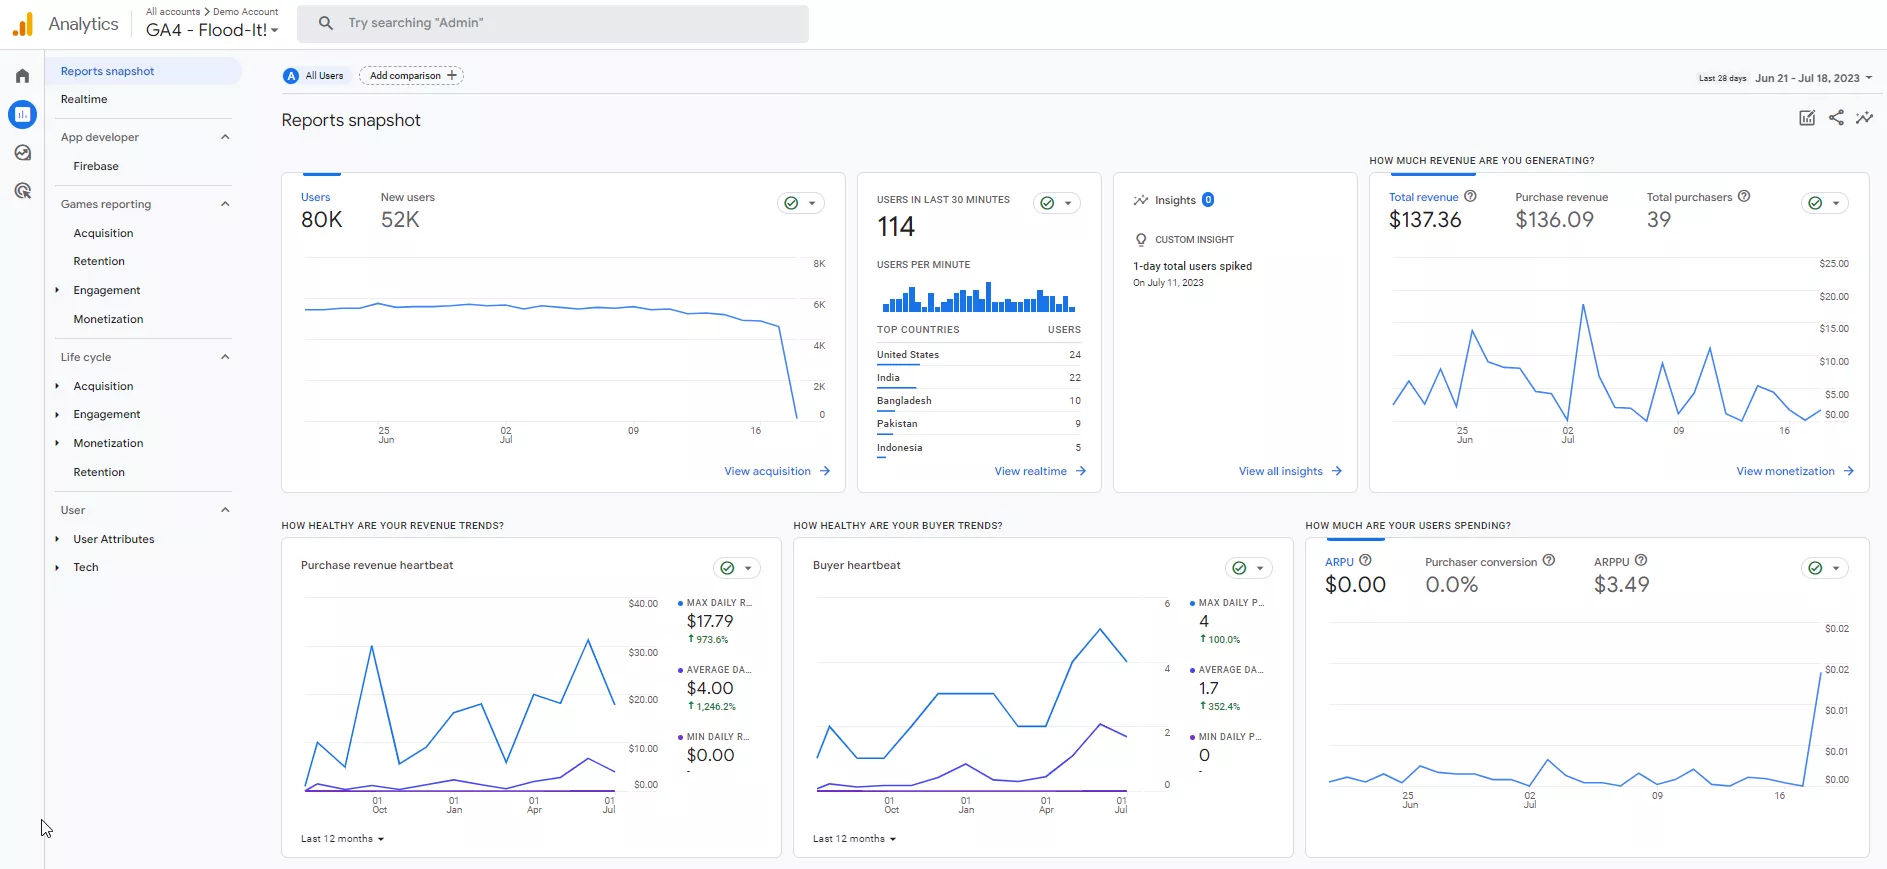
Distribution of users by country and the number of users in the last 30 minutes on Flood-It!
Based on the data collected, you can analyze the website's effectiveness. In addition to identifying areas for improvement, it helps you understand visitor behavior and needs, and you can then make informed decisions to improve the web resource. This is web analytics, an integral part of effective online marketing and a successful web strategy.
Types of Web Analytics
There are different types of web analytics, each aimed at analyzing and using certain data for different purposes.
- Classic website analytics focuses on data analysis related to the website itself. It includes collecting and analyzing metrics such as visits, session duration, page views, page transitions, and other website functioning indicators.
- Marketing end-to-end analytics focuses on evaluating the effectiveness of marketing campaigns and website promotion. It allows you to track traffic sources, conversions, user interaction with marketing materials, and the impact of different marketing channels on website performance.
- Custom BI (business intelligence) systems develop specialized analysis tools for business needs. They help to solve specific tasks and identify strategic relationships.
Customizable business intelligence systems also allow you to create specialized reports, charts, diagrams, and other visual tools to meet the needs of your department or organization. Data visualization is an important part of web analytics.
Choosing an appropriate type of web analytics depends on your business goals and needs. For example, classic website analytics helps you understand how users interact with your website, while marketing analytics allows you to track the effectiveness of the ad campaign and traffic acquisition channel. Reporting and data visualization help make the compiled information clearer and more convenient for analysis and decision-making.
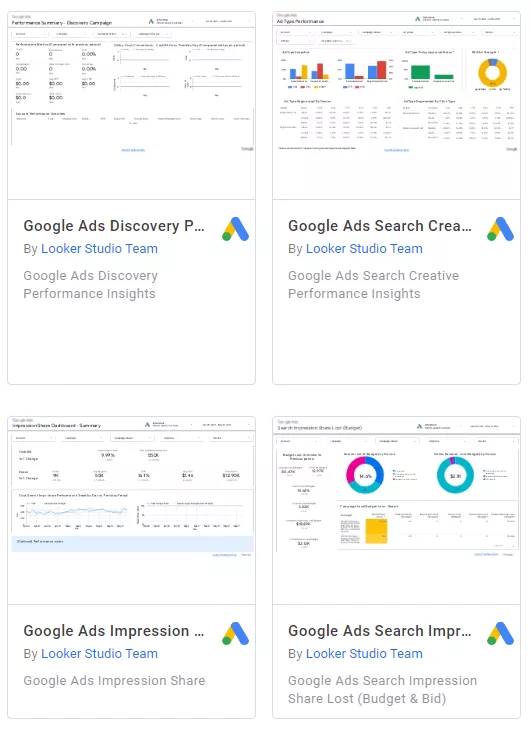
Examples of Looker Studio templates for Google Ads data visualization
To get a complete picture of your advertising performance across all platforms, our Business Intelligence & Analytics Services can help you unify your marketing data and uncover growth opportunities.
Web analytics strategy steps
A comprehensive web analytics strategy involves different stages. Here's a closer look at these stages:

1. Data collection.
The first step is to collect the necessary data about your website visitors. This usually involves installing an analytics code (Google Analytics) on your website pages to track user actions, including page views, clicks, conversions, and other important events.
2. Conversion tracking setup.
By setting up conversion tracking, i.e., tracking of targeted user actions on the site, you can analyze conversions and evaluate website effectiveness. A conversion can be a purchase, filling out a form or a subscription, and so on.
3. Basic reporting setup.
After collecting data and tracking conversions, you need to set up basic reporting. This step includes identifying key performance indicators (KPIs) and tracking metrics that will allow you to evaluate the effectiveness of your website and marketing efforts.
4. Combining data from different systems.
Web analytics often requires combining data from different sources, such as data from third-party advertising systems, CRM systems, or other tools. This allows you to get a more complete picture of user interaction with the site and evaluate the effectiveness of marketing campaigns.
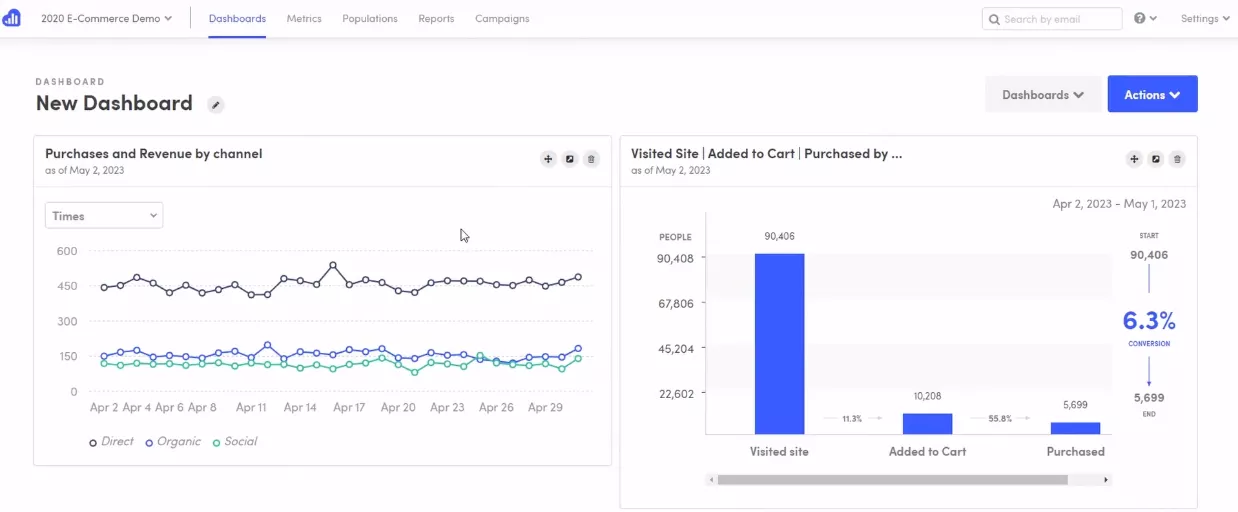
5. Creating dashboards and visualizations.
Visualizations can make data more understandable and help you draw more effective conclusions. These can be graphs, charts, pivot tables, and other visualization tools that take performance indicators into account and reveal key trends.
6. Creating hypotheses and A/B testing.
Hypotheses allow you to formulate assumptions about possible improvements on the site, while A/B testing allows you to try out different options and determine which works best based on the data collected.
These steps are especially important for websites based on dynamic technologies. For instance, Single Page Applications & Javascript SEO Services help ensure that even complex, JavaScript-driven websites are fully tracked, analyzed, and optimized for both users and search engines.
Top web analytics tools
To collect, analyze, and measure website and visitor data, specialists use a variety of programs and services. I'm going to tell you about eleven of the most common tools used for web analytics.
Google Analytics
It is the most widely used web analytics tool and is free. It provides various options for collecting, measuring, and analyzing data on web traffic, user behavior, conversions, and other key metrics. Thanks to Google Analytics, web owners can get valuable insights into the effectiveness of their websites and marketing campaigns.
Insights, in the context of web analytics, are in-depth knowledge that can be gained from analyzing website data. This data includes information about traffic, visitor demographics, their behavior on the website, and competitive analysis. Insights help improve marketing strategies and optimize the website.
The latest version of Google Analytics, GA4, allows you to collect event-based data from websites and applications. In addition to other updates, GA4 offers these features:
- the use of event data instead of sessions;
- settings to protect privacy;
- forecast indicators;
- integration with media platforms to improve the interaction with websites and applications.
Since July 1, 2023, standard Universal Analytics resources have stopped processing data, and Google Analytics 4 is now the only option for data collection and analysis.
Read more about GA4 in our blog:
- How To Prepare For Migration To Google Analytics 4
- Universal Analytics vs. Google Analytics 4 Difference
- How to Set Up Google Analytics 4 with Google Tag Manager
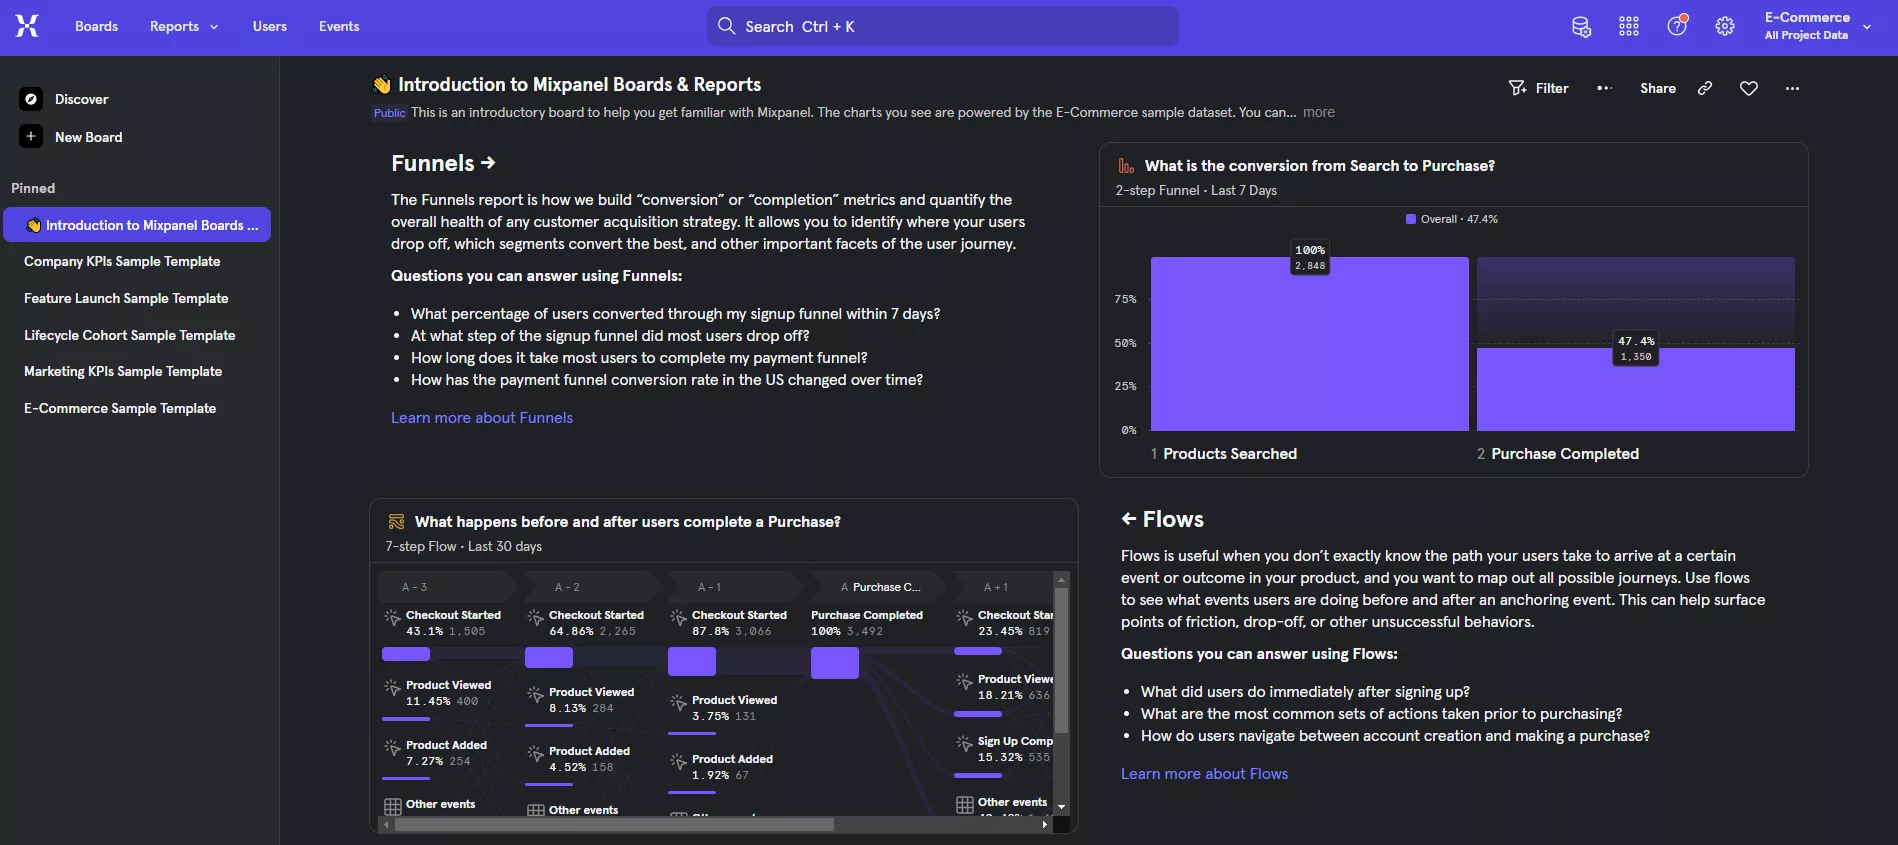
Mixpanel
Mixpanel is an event analytics service company that tracks web and app analytics. It allows you to build interaction funnels and track conversions.
Mixpanel focuses on finding insights to improve your digital product development strategy compared to Google Analytics.
It offers different tariff plans for different types of products:
- STARTER is designed for those looking to determine the relationship between the product and the market. This free plan allows you to track a limited number of monthly events.
- GROWTH ($20/month) is designed for those analyzing data from a larger audience.
- ENTERPRISE ($833/month) is aimed at large companies that want to provide their teams with advanced capabilities.
Kissmetrics
Kissmetrics is a tool that focuses on marketing analysis and user retention. It allows you to track user activity on the website and analyze user interaction with marketing campaigns.
Kissmetrics does not have a free tariff plan and offers the following rates:
- SILVER is recommended for small businesses looking to grow ($199/mo).
- GOLD is for medium-sized businesses planning to scale ($499/mo).
- PLATINUM is for agencies, large teams, and corporations (price on request).
Each plan includes a certain number of customizable events and a specific number of seats (service users). The service also offers:
- a number of different reports;
- analysis of user activity;
- the ability to save data;
- integrations;
- data export;
- technical implementation support.
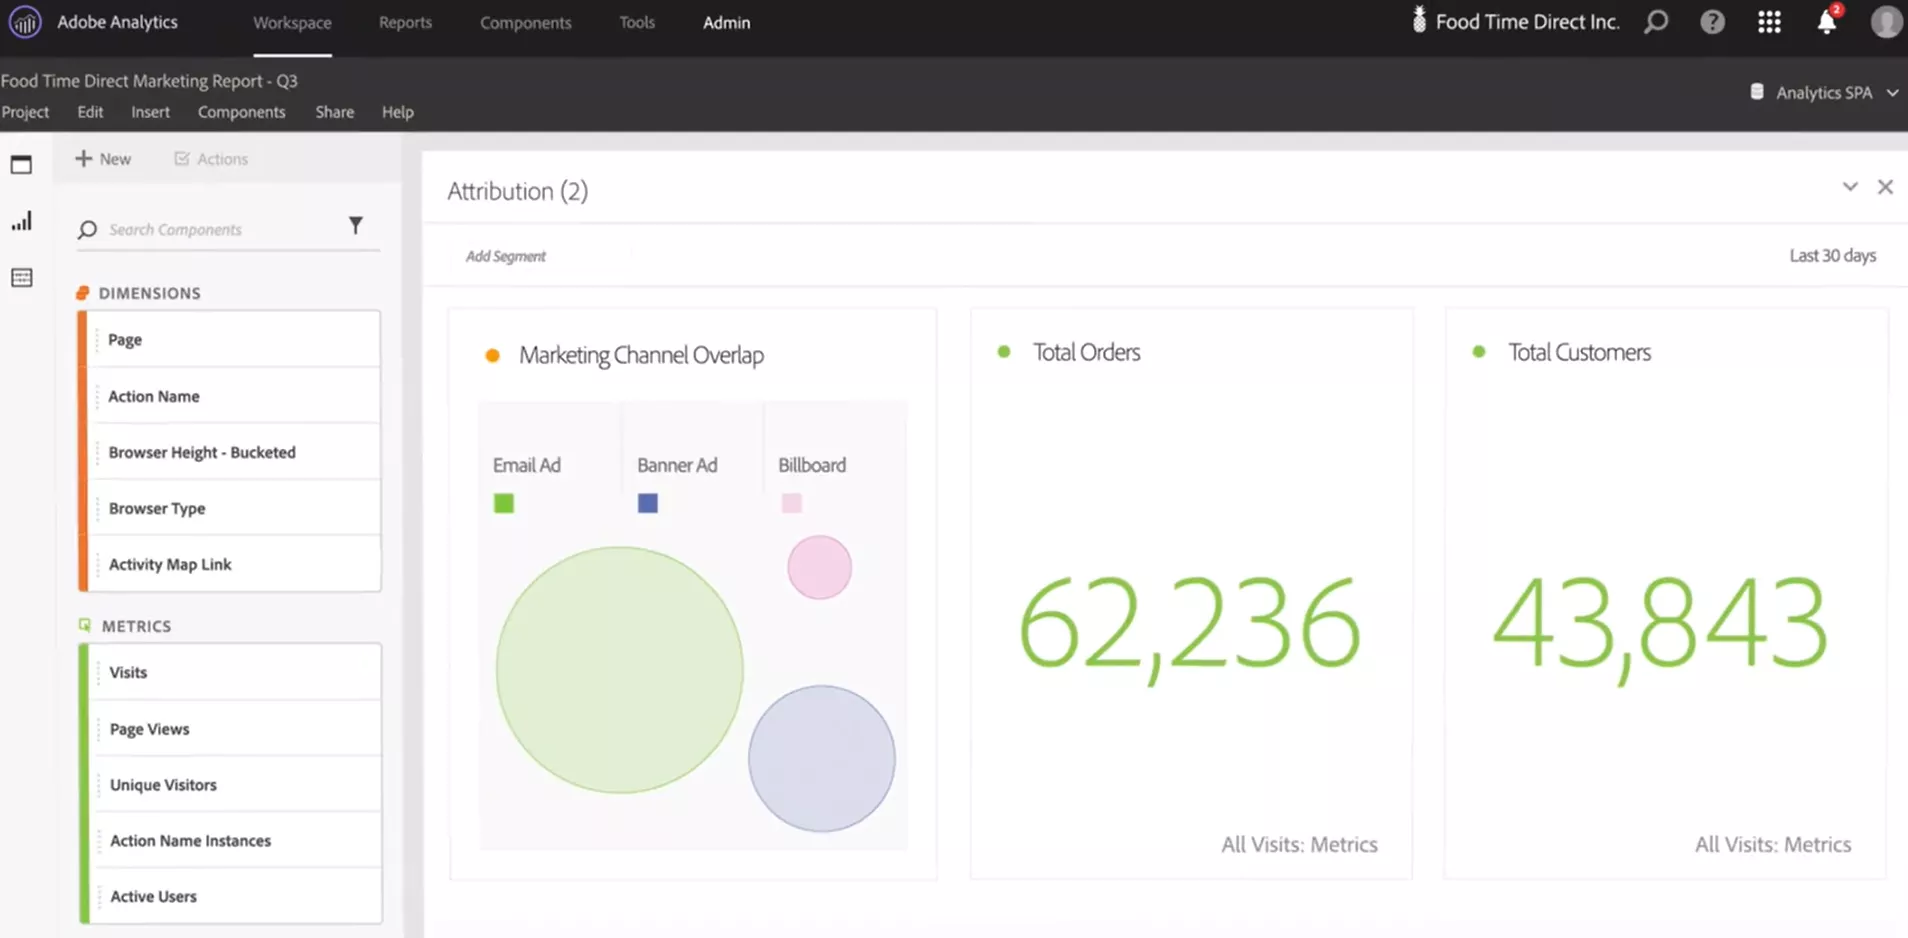
Adobe Analytics
Adobe Analytics is a powerful web analytics and marketing analysis tool that provides in-depth analysis and helps companies make strategic decisions. It allows you to collect data from various channels, understand customer behavior and needs, and predict and model customer behavior.
Adobe Analytics distinguishes itself from FA4 by its advanced capabilities for predicting customer behavior.
You can get access to an Adobe Analytics demo, as well as a wide range of tariffs and individual services, for example:
- access to workspace analysis, reports, and quick insights;
- API, voice assistant, and cross-device analysis;
- AI/ML-based Segment IQ and the ability to create unique segments, etc.
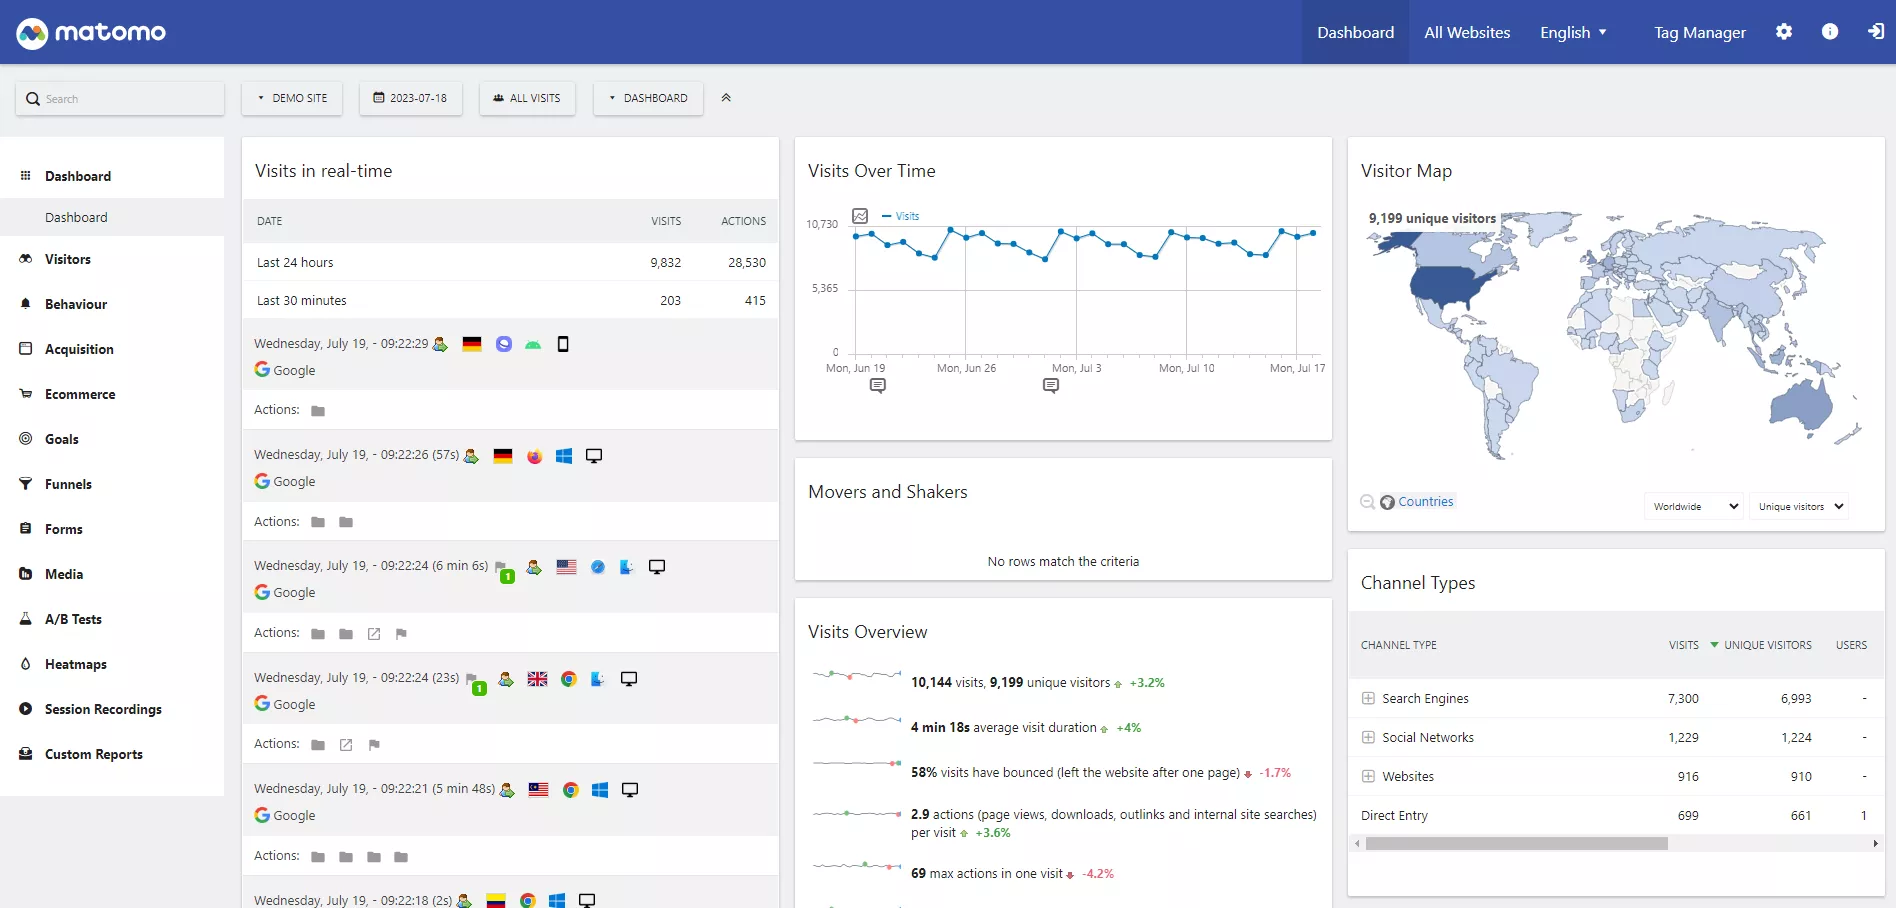
Matomo (Piwik)
Matomo, formerly known as Piwik, is an open web analytics tool that gives you full control over your data. It allows you to collect and analyze data on visitors, page views, and conversions. You can also customize reports and monitor the effectiveness of ad campaigns.
Matomo is smaller in scale and has fewer real-time data processing capabilities than GA4. However, both services have their advantages:
- GA4 offers a deeper analysis of user behavior based on events and has better integration with the Google ecosystem.
- Matomo provides more control over data, higher levels of confidentiality, and thus more flexibility in customizing analytics.
Matomo offers two tariffs:
- On-Premise. It's free but requires technical knowledge and installation on your own server. It comes with community support or a paid support subscription.
- Cloud. The price starts at €19/month, with the possibility of choosing additional traffic indicators for an additional fee. Offers easy installation in the cloud, email support, a limit of 30 websites, and data retention for 24 months.
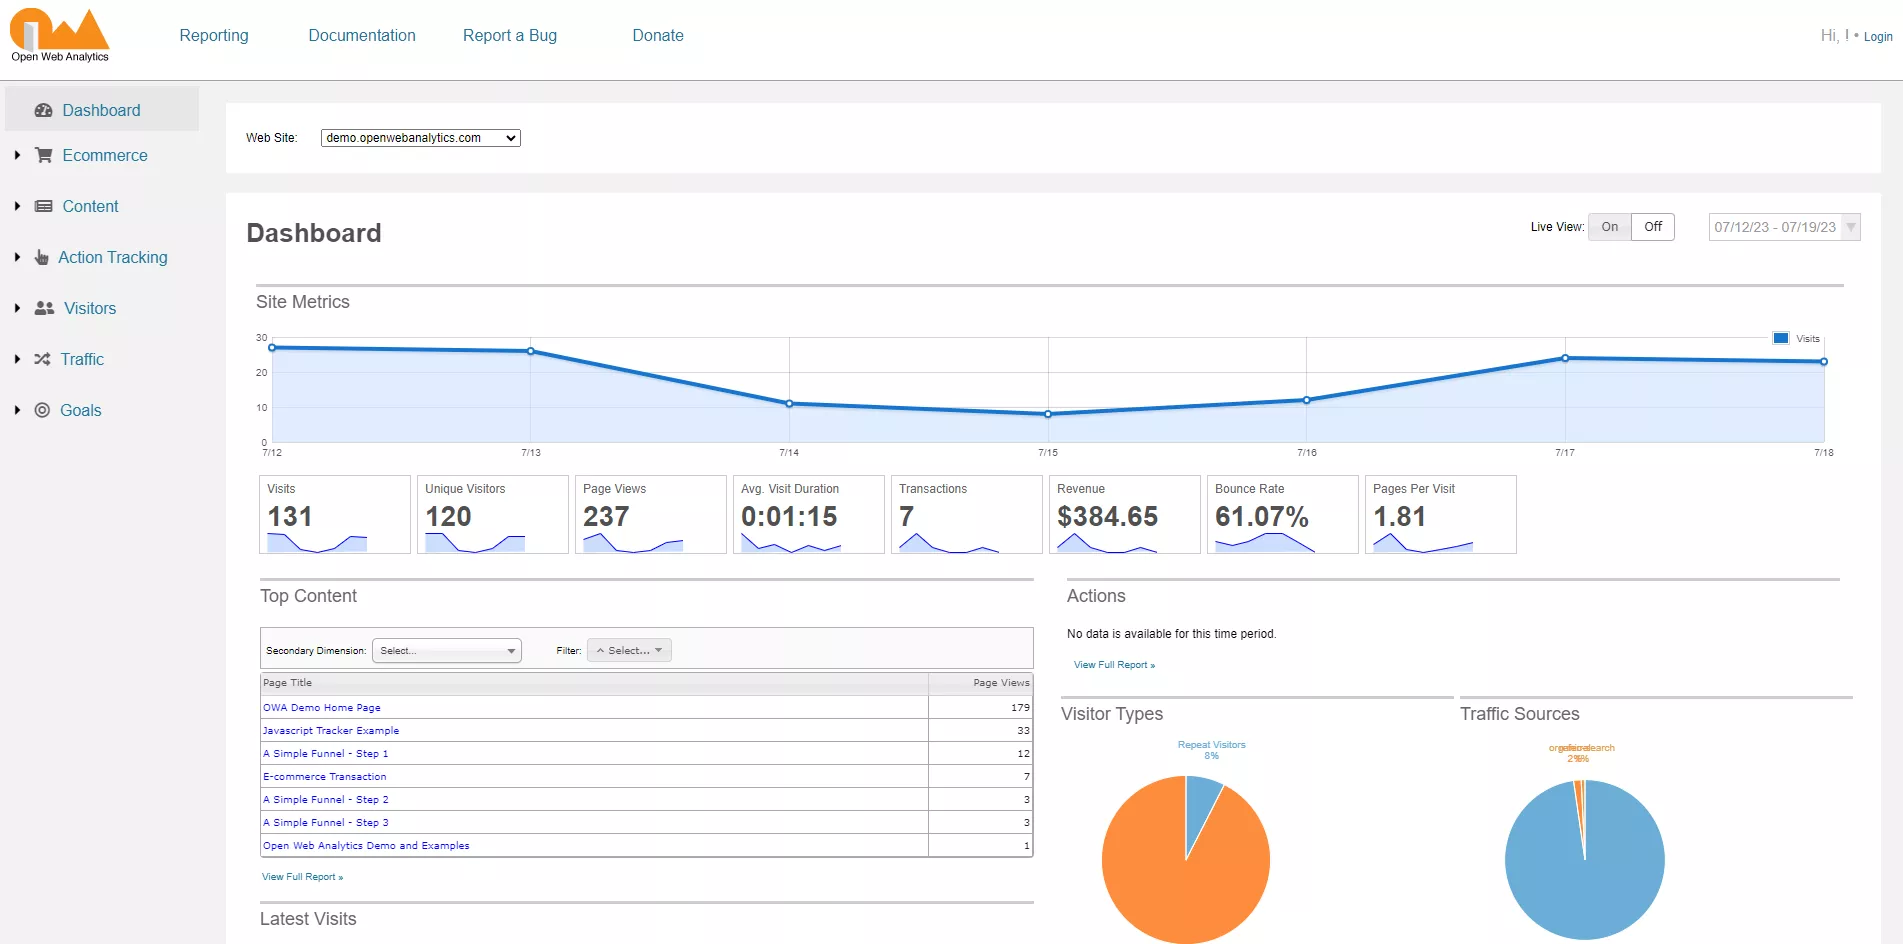
Open Web Analytics
Open Web Analytics (OWA) is another tool that provides detailed information about website visitors, their behavior, and conversions. It allows you to customize your reports and monitor ad campaign outcomes.
OWA is an open-source framework that is distributed under the GPLv2 license. It provides developers with simple ways to add web analytics to their websites using simple JavaScript and PHP-based APIs. OWA also supports tracking for websites built on popular content management systems, such as WordPress and MediaWiki.
Compared to GA4, which has various features and in-depth analysis, OWA is less versatile and may be more limited in features, especially in integrating with other Google services.
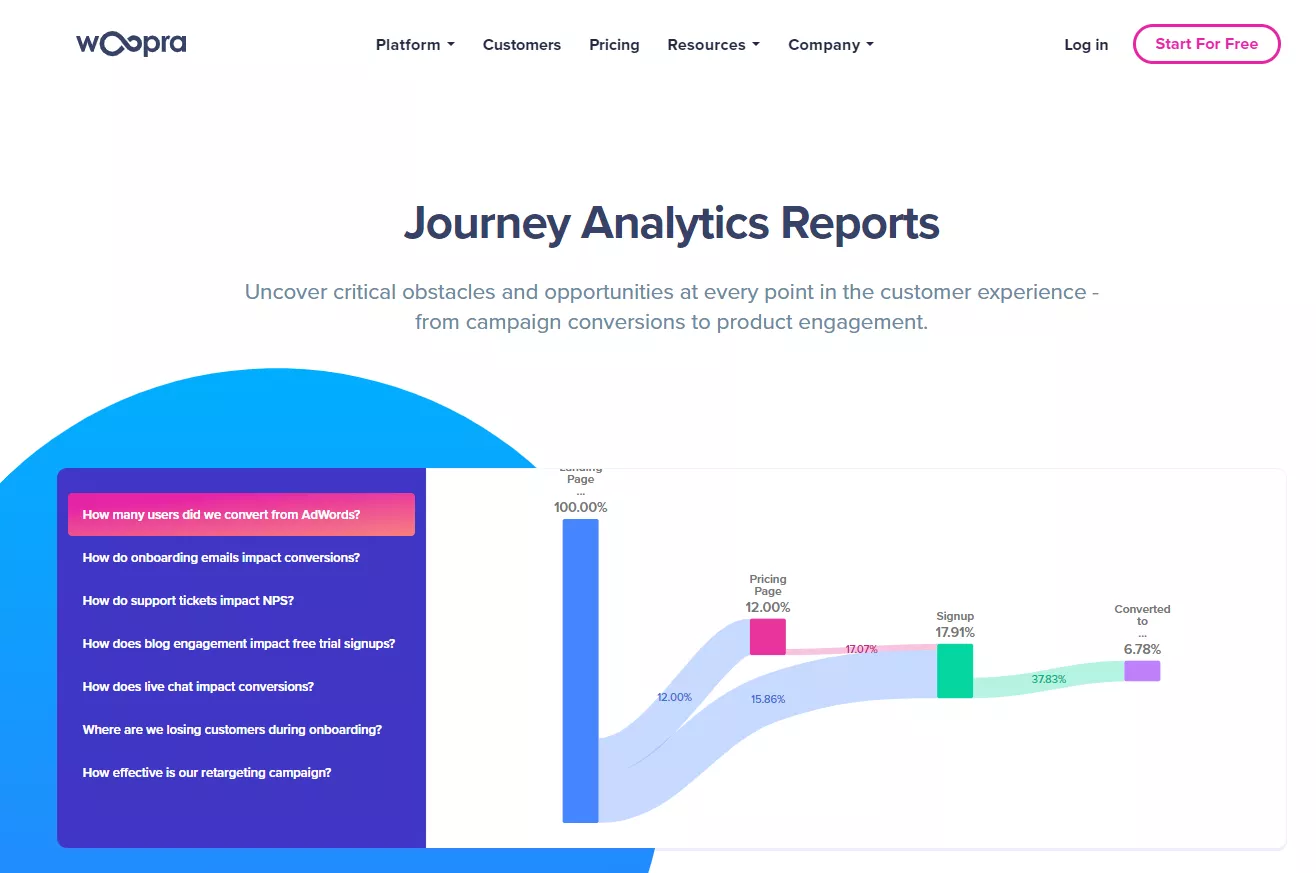
Woopra
Woopra tracks and analyzes website visitors' data, interactions, and behavior. It has the ability to measure marketing campaign effectiveness and track conversions.
Woopra focuses on user interactions on your website and the analysis of marketing campaigns and conversions. However, compared to GA4, Woopra provides a more superficial analysis of events.
Woopra has several tariff plans available:
- Core is a free tariff plan with a limited number of actions per month and limited data storage.
- Pro ($999/mo) is a paid plan with increased actions per month, extended data storage, advanced analytics, automation, and support.
- Enterprise (customized) is an enterprise plan for large volumes of actions per month, including synchronization with data warehouses, special features, and support.
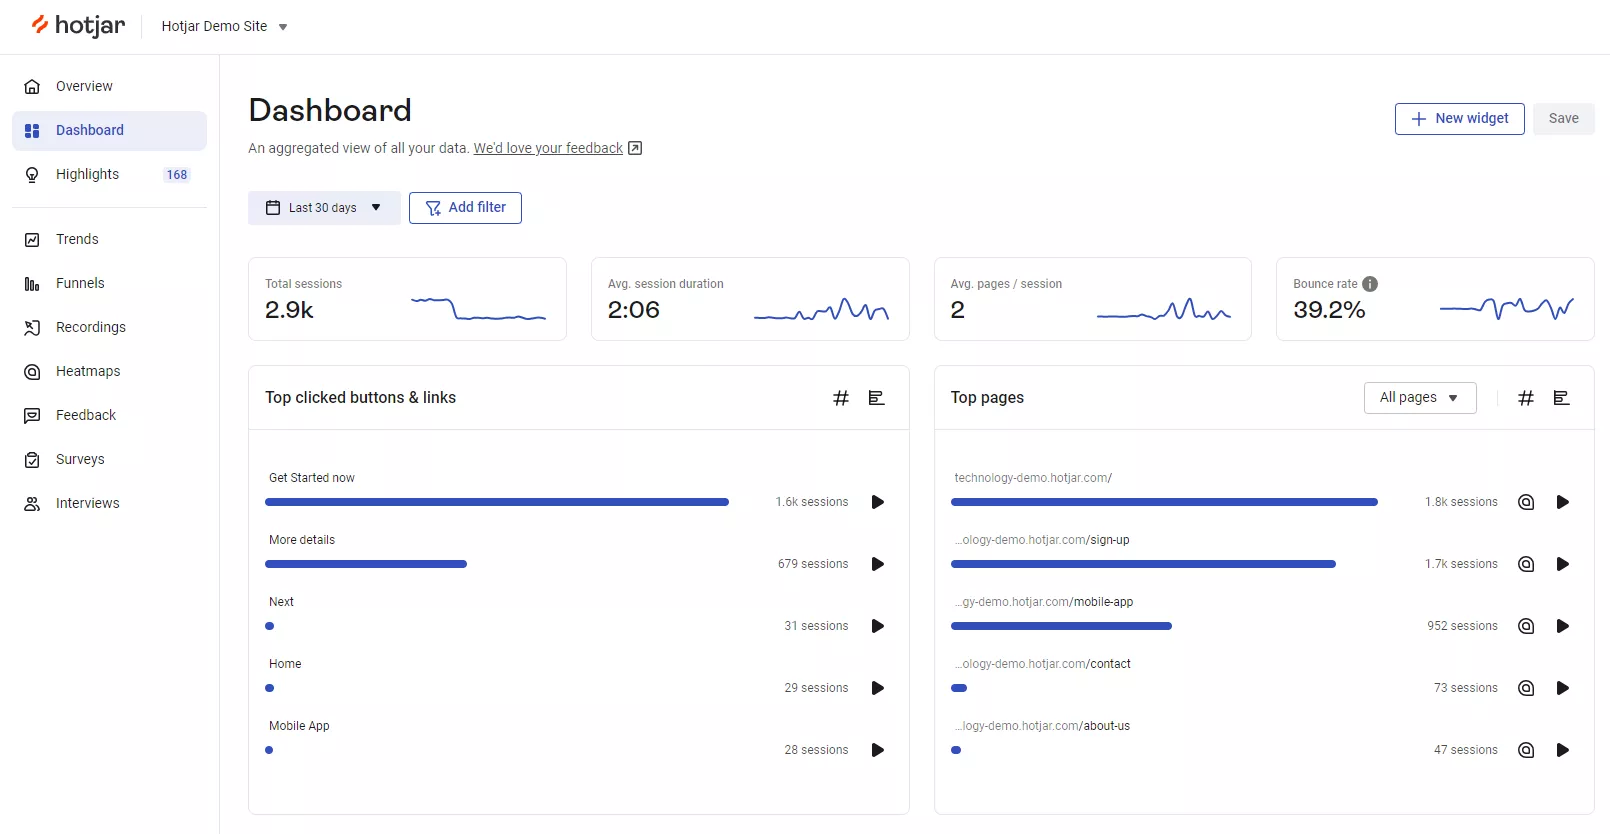
Hotjar
Hotjar is a platform that gives insights into the digital user experience. Through the use of tools for behavioral visualization, user surveys, and feedback, Hotjar evaluates how users interact with a website and suggests ways to improve their experience.
Compared to GA4, Hotjar does not provide a deep analysis of user behavior, but it has more visualization options and surveys.
Hotjar offers different tariff plans for user experience analysis. They include:
- Basic: A free plan that allows you to visualize user behavior and get feedback.
- Plus: A €39/month plan with additional features for teams and data collection.
- Business: A €99/month plan ideal for growing companies with increased data and analysis.
- Scale: A €213/month plan for experts with high traffic and advanced analysis capabilities.
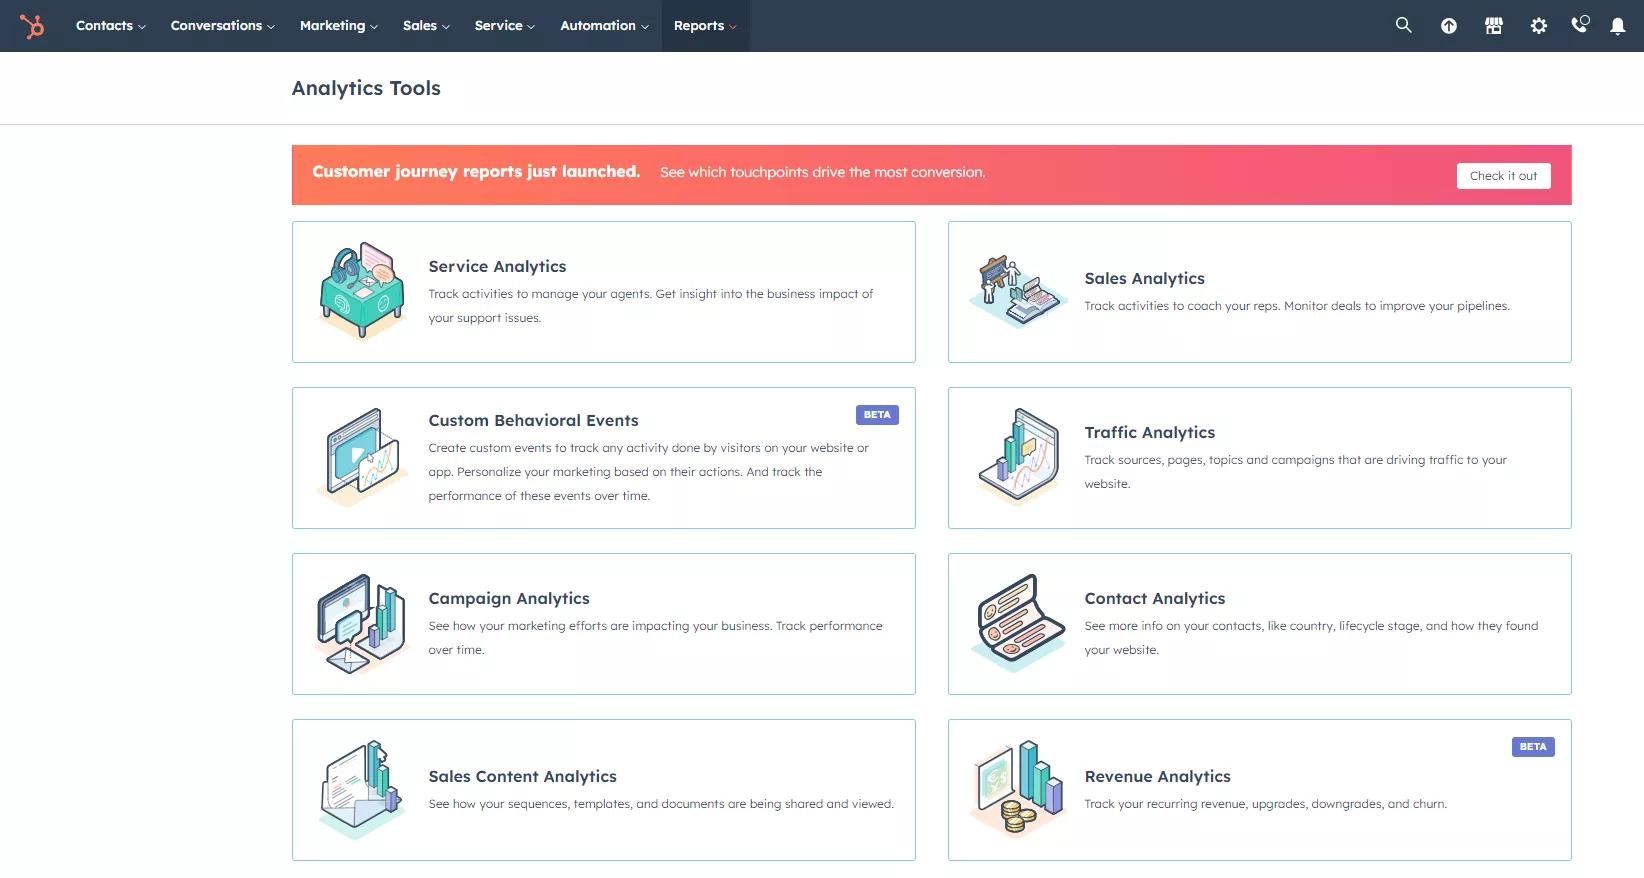
HubSpot
HubSpot is an all-in-one tool that includes web analytics, marketing, sales, and CRM tools. It allows you to track and analyze web traffic data, collect leads, and effectively manage marketing campaigns.
Both HubSpot and GA4 provide web traffic analysis and user experience capabilities. However, HubSpot goes beyond analytics by offering an integrated marketing, sales, and CRM platform.
HubSpot offers several plans:
- Starter (from $18/month) includes basic marketing tools for lead acquisition and conversion.
- Professional (from $800/month) provides an extended set of tools for automation, reporting, and campaigns.
- Enterprise (from $3,600/month) is the most powerful plan with advanced control and flexibility.
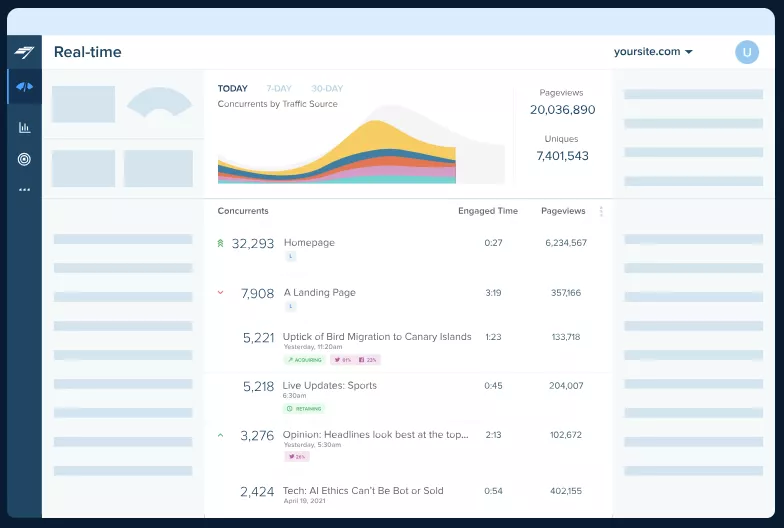
Chartbeat
Chartbeat allows you to track and analyze user behavior in real-time, understand how they interact with content, and improve website traffic.
Both Chartbeat and GA4 focus on analyzing user behavior, but Chartbeat is designed to provide instant, real-time information, while GA4 provides a broader data analysis that explores patterns and trends in depth.
The basic tariff plan on Chartbeat costs $12,490 per year and includes automatically generated insights, access to APIs, the ability to manage and share reports, and much more.
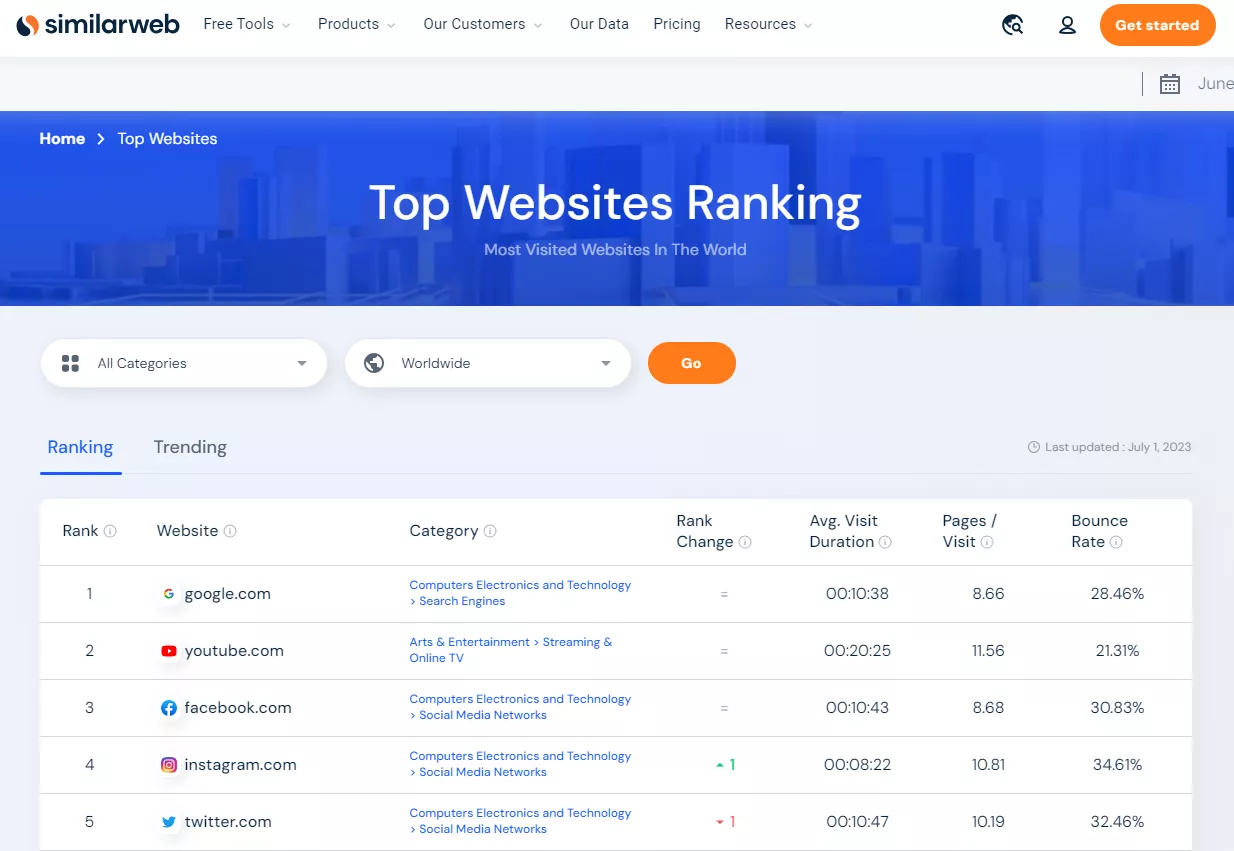
SimilarWeb
SimilarWeb is a tool for web traffic analysis and competitor research. SimilarWeb provides deep insights into web traffic, keywords, traffic sources, and competitors, helping you understand the market and analyze the competition.
SimilarWeb has different tiers in its pricing plans, including Starter ($125/month), Professional ($333/month), Team (individual), and Enterprise (individual). Each plan has different limits on the number of websites, keywords, historical data, and other features.
All tariffs are valid as of August 2023.
These tools help brands gain valuable insights, analyze data, and make informed decisions to improve performance and achieve success. Each of these tools has its own characteristics and can be useful in different areas of web analytics.
The key web analytics metrics
The main purpose of using metrics is to understand user behavior, measure performance, and identify opportunities for website improvement. The most commonly used
- Sessions indicate the total number of visits or sessions on the website. Counts all visits, including repeat visits over a certain period of time.
- Users indicate the number of unique users who have visited the website. It counts only the number of different users on the site during a given period, regardless of the number of visits they made.
- Exit Page indicates the page from which users leave the site most often. This metric can help identify problematic pages that do not interest users or do not provide the necessary information.
- Conversion Rate measures the percentage of visitors who perform a targeted action on a website, such as buying a product, filling out a form, or subscribing to a newsletter. It is one of the main website and marketing campaign performance indicators.
- Average Session Duration shows users' average time on the site during a session. It helps to determine how attractive and engaging the content on the site is for visitors.
- Bounce Rate indicates the percentage of visitors who immediately leave the site after viewing one page. A high bounce rate can indicate insufficiently engaging content, difficult navigation, or other problems on the site.
- Click-through rate (CTR) measures the percentage of visitors who click on a certain element or link on a website. It helps to evaluate the effectiveness of advertising banners, buttons, or links.
These are just a few examples of the most widely used web analytics metrics. The choice of metrics depends on the goals of your business and the specific tasks you want to accomplish with web analytics.
Key performance indicators
The following metrics allow you to correlate the collected data with a specific business impact:
- Conversion Rate (CR) measures the percentage of visitors who performed a targeted action on the website, such as purchasing a product, filling out a form, or subscribing to a newsletter. A high conversion rate indicates an effective website and marketing strategy.
- Return on Investment (ROI) evaluates the effectiveness of marketing and advertising expenses. It measures the ratio between marketing expenses and the profit received. A high ROI indicates that investments in marketing are profitable.
- Average Order Value indicates the average amount a customer spends when making a purchase on the website. It allows you to evaluate the effectiveness of sales strategies and identify opportunities to increase the average order value.
- Cost-to-Revenue Ratio measures the effectiveness of marketing and advertising expenses in relation to the profit received. It helps to evaluate how effectively the spending affects the company's profit.
- Average Revenue Per User (ARPU) measures the average revenue generated by each user on the website. It allows you to evaluate the effectiveness of monetization and user retention on the website.
- Average Session Duration measures the average time users spend on a website during a session. A long average time spent on the site indicates that visitors are active and interested in the site content.
Examples of successful web analytics
Web analytics aims to collect data from a website, analyze it, and use the results to improve a product or website. Let's look at how well-known brands do it.
Amazon
Amazon carries out a large amount of web analytics to improve the e-commerce experience:
- Personalized recommendations. Amazon analyzes a customer’s previous purchases, product views, searches, and other actions to provide recommendations that meet their individual interests.
- A/B and multivariate testing. By systematically conducting experiments with different variations of product pages, buttons, banners, and other website elements, Amazon determines which changes lead to improved conversions and user experience.
- Dynamic pricing. Amazon analyzes demand, competitive pricing, and other factors in real-time to dynamically adjust prices for its products.
- Improving the delivery experience. Amazon collects data on the speed and quality of delivery and user interaction with different delivery methods. By analyzing this data, Amazon optimizes the delivery process and its own costs.
- Inventory management. Amazon monitors the number of products in stock and their popularity to prevent situations where the product becomes unavailable. This helps ensure that goods are always available in accordance with demand.
To learn more about advertising on other marketplaces, read our article: The eBay Marketplace and How to Advertise on It
Google uses a proprietary web analytics tool, Google Analytics, to measure user interaction with its products and services. This data is analyzed to improve both internal strategies and external interactions.
In particular, Google analyzes the popularity of certain features and functions to improve them and provide a better user experience. Analytics data is also used to improve the effectiveness of marketing campaigns and optimize the customer experience.
Netflix, Airbnb, Spotify
These three highly popular companies have successfully used web analytics to improve the user experience:
- Netflix, a video streaming platform, analyzes users' views and interests to personalize recommended content.
- Spotify, a digital music service, learns music preferences to create customized playlists and recommendations.
- Airbnb, a travel booking site, analyzes user behavior on the platform to improve the search function and travel recommendations.
Read more on our blog:
- Case Study: Analytical Tool for Ticket Sales Service – Hundreds of Event Advertising Budgets Managed in Real Time
- How To Set Up Advanced E-commerce With Google Tag Manager
- Setting Up an A/B Test in Google Optimize: A Step-by-Step Guide
Conclusions
1. Web analytics is an essential tool for today's online businesses. It involves collecting, analyzing, and interpreting website and user behavior data. It helps companies improve website performance and marketing efforts and ensure customer satisfaction.
2. The key steps of a web analytics strategy are:
- collecting data from a website or web resource and tracking conversions;
- setting up basic reporting and combining data from different sources;
- visualizing the results in reports, charts, and diagrams;
- hypothesizing and conducting A/B testing.
3. There are various web analytics tools, all of which have their own unique capabilities and help collect different types of data. The choice of tools depends on the business needs and the amount of data to be analyzed.
4. The main web analytics metrics are conversion rate, return on investment, average order value, and bounce rate. They indicate the effectiveness of strategies and make the necessary adjustments to achieve the goals.
5. Web analytics is an ongoing process, and you need to systematically track and analyze data to achieve maximum results. The results of web analytics act as the basis for strategic decisions and the continuous improvement of website performance and marketing efforts.
To ensure the collected data truly reflects your site’s potential and is not distorted by hidden technical errors, complement your analytics efforts with an In-depth Technical SEO Audit — this will help uncover critical issues affecting performance and provide actionable insights for further growth.

 2
2
 2
2
 0
0
Recommended theme posts
Related Articles
How to Set Up Consent Mode in GA4 on Your Website with Google Tag Manager
Let's explore how to properly integrate consent mode in GA4, configure it for effective data collection, and at the same time comply with GDPR and other legal regulations
Display Advertising Effectiveness Analysis: A Comprehensive Approach to Measuring Its Impact
In this article, I will explain why you shouldn’t underestimate display advertising and how to analyze its impact using Google Analytics 4
Generative Engine Optimization: What Businesses Get From Ranking in SearchGPT
Companies that master SearchGPT SEO and generative engine optimization will capture high-intent traffic from users seeking direct, authoritative answers