Google has ceased its support for the third version of Google Analytics (Universal Analytics) since July 1, 2023. Following the decision, ultimately, the only way out will be to work with Google Analytics 4, officially out of beta in the fall of 2020. While switching from Google Analytics 2 to Google Analytics 3 implies minor changes with relatively the same functionality, GA 4 is a substantial leap in development. It offers a new data collection structure, which entails several further changes. Let’s take a look at the main ones.
- Different types of hits
- Events
- Sessions
- Custom dimensions & metrics
- Comparison of data in Universal Analytics and Google Analytics 4:
As a reminder, support for Universal Analytics will end on July 1, 2023. Even though further data collection will not be possible, data storage and display in the Universal Analytics interface will be available for another six months. For users of the paid version of Analytics 360, the period will be extended for another quarter.
As you can see, there is some time remaining. Suppose Google Analytics is an essential part of your toolkit, which can help you analyze the effectiveness of your channels and make investment decisions. In that case, you need to install the new version right away. The tool allows you to accumulate the right amount of data by the X date.
Different types of hits
Types of hits* in GA 4, as such, completely replace the concept of "Event."
Universal Analytics has various hits: pageview, event, social, transaction/e-commerce, user timing, exception, and app/screen view. In Google Analytics 4, all of these correspond to an event.
|
Hit type (Universal Analytics) |
Hit type (Google Analytics 4 ) |
|
Page View |
Event |
|
Event |
Event |
|
Social |
Event |
|
Transaction/e-commerce |
Event |
|
User timing |
Event |
|
Exception |
Event |
|
App/screen view |
Event |
The new terminology is better in terms of morphology because either browsing a page, clicking a button, or adding an item to the cart – are all events committed by users.
User interaction with the site earlier looked like this:
User → Session → Hit → Pageview / Event / Social
In Google Analytics 4, the new interaction structure can be shortened to:
User → Event
What advantages does the enhancement bring in?
First, it allows connecting multiple data streams simultaneously from mobile apps and desktop browsers. As a result, a set of views (the bottom level of the account) is no longer needed, which is what one can see in the Google Analytics 4 layout (Account – Resource).
Additionally, the GA 4 event data collection model is different.
Events: a new approach to understanding, structure, and definition
Events in Google Analytics 4 are not identical to events in Universal Analytics.
In Universal Analytics Help, an event is a user interaction with content other than page loading (browsing).
In GA 4, an event is a specific user action on a website or in an app at a particular time (page view, sending a form, adding an item to the cart, etc.).
There are four types of events in the new analytics:
- Automatically collected events – these are collected by Google after the meter is set up on the page.
- Enhanced event - also events that Google collects automatically, but first, users must confirm their consent in the interface.
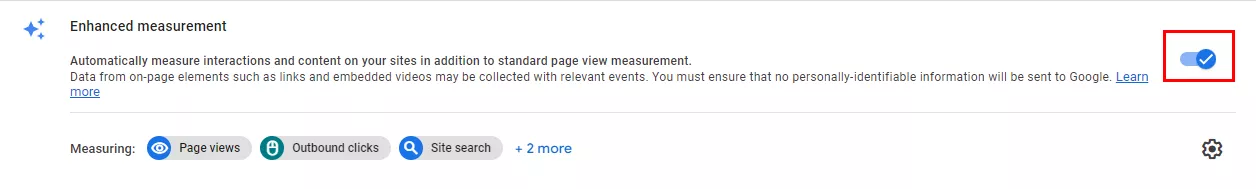
- Recommended events – a list of events predefined in Google Analytics 4, CJ, and SNBQ for various activities with standard names and a set of parameters.
- Custom events – the ability to set custom events and their parameters for individual business needs.
Universal Analytics and Google Analytics 4 use different methods to define events. In Universal Analytics resources, these are mandatory descriptors (category, action) and non-mandatory (label, value).
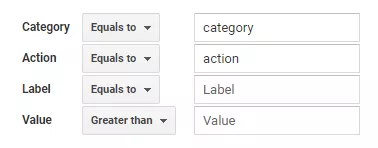
Google Analytics 4 has no types of requests (sets of descriptors). Instead, a model similar to Firebase Analytics is employed based on events and their parameters. There can’t be more than 50 unique parameters, but I’ll discuss them in the next section. Here is an example of how this can be implemented with GTM:
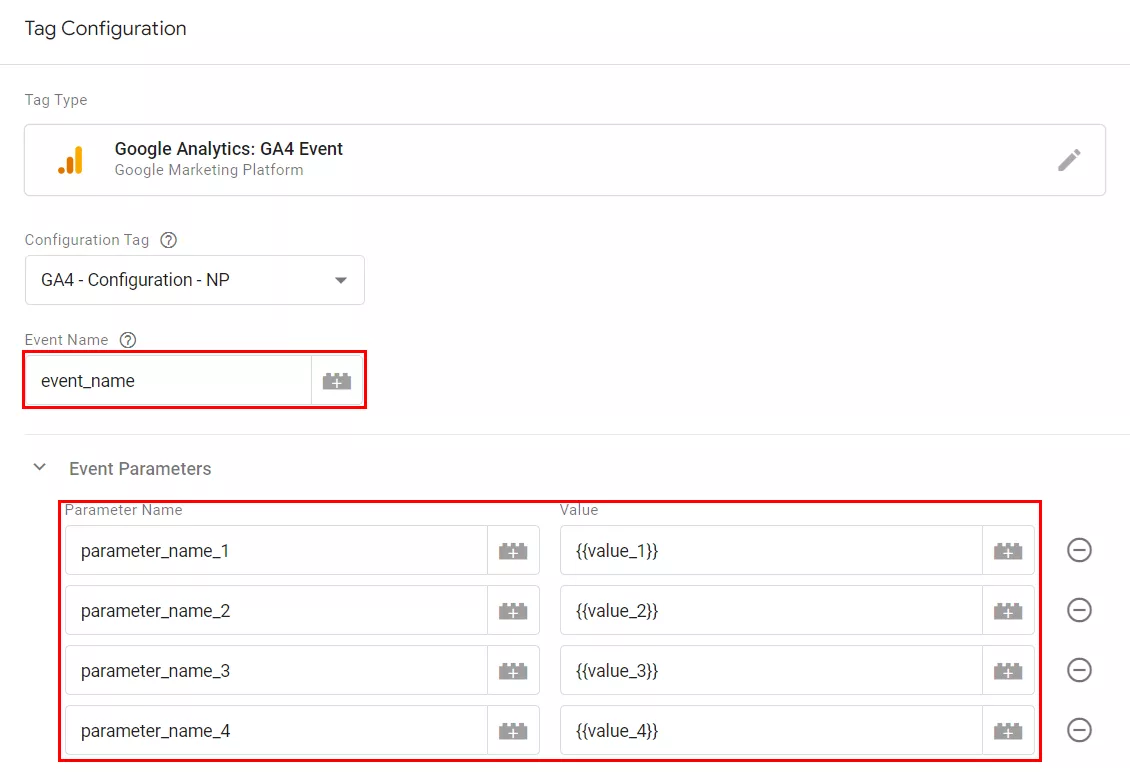
Consequently, in Google Analytics 4, the approach to interpreting events, their structure, and, accordingly, their definition model is different than it was in Universal Analytics.
Sessions in GA 4
The new version of GA replaces the well-known Sessions/views data model with an event-based model. That allows you to use it both for mobile applications and websites. Sessions remain in the new GA version but’s undergone some changes.
In Universal Analytics, a session is a sequence of user actions on a website or mobile app over a particular time. That is, a session is recorded based on a configured hit on the site and stops when:
- after 30 minutes of inactivity on the site;
- automatically registers a new session at the beginning of a new day at 00:00;
- after changing the campaign source.
In Google Analytics 4, a session is a sequence of user actions on the site or mobile app over a specific time. An automatic session_start event triggers sessions. It also ends after 30 minutes of inactivity, but the session continues when a new day comes and after changing the campaign source. When viewing session statistics by day, the session will be considered as two days.
Comparison of Universal Analytics and Google Analytics 4:
|
Universal Analytics |
Google Analytics 4 |
|
|
Area of use |
Desktop sites |
Desktop sites |
|
Session starts at |
Interaction with the site or application (sending a hit) |
An automatic session_start event trigger |
|
Session ends at |
1. 30 minutes of inactivity |
30 minutes of inactivity |
|
Minimum possible session standby time |
1 minute |
5 minutes |
|
Maximum possible session standby time |
4 hours |
7 hours 55 minutes |
|
Key metrics |
a number of sessions; |
sessions; |
Custom dimensions & metrics
In Universal Analytics, you can use custom dimensions and metrics to track data that is not automatically collected, such as the name of the author of an article, the cost of goods, etc. The feature lets you obtain vital information about a user, product, event, or session from your CRM system and make more intelligent and data-driven decisions.
Custom dimensions and metrics can be included in the corresponding administrator tabs at the resource level.
Google Analytics 4 uses event parameters to generate special parameters. Here is a comparison table between Universal Analytics and Google Analytics 4 so you can get some insights from it:
|
Universal Analytics area of use |
Alternatives in Google Analytics 4 |
|
Hit |
Special parameters at the event level |
|
User |
Special parameters at the user level |
|
Product |
E-commerce parameters |
|
Session |
- |
That is, GA 4 can generate special parameters for events and users. The alternative for products in the special characteristics of Universal Analytics is e-commerce parameters. It is no longer possible to create them for sessions.
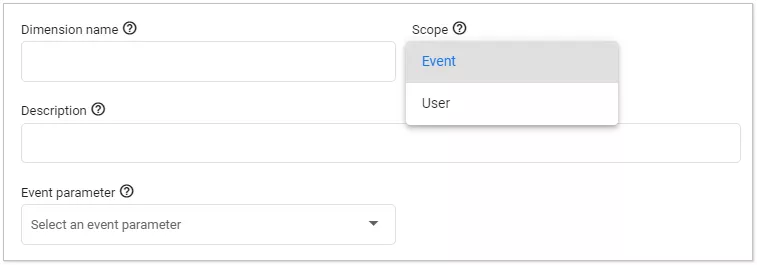
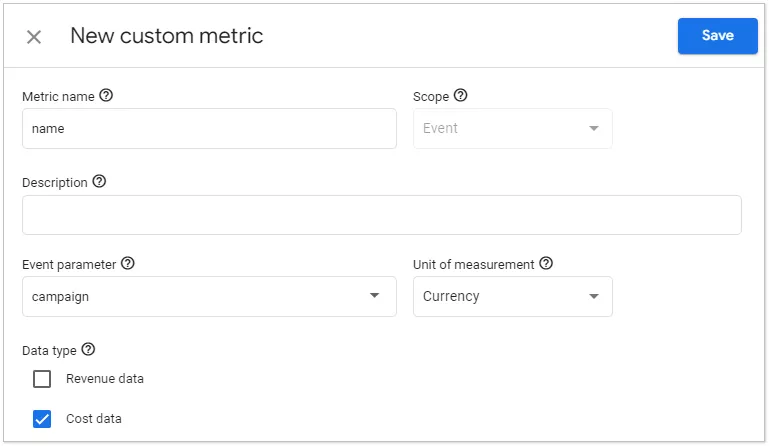
Special parameters in Google Analytics 4 can only be created at the action level - the events. Their number has grown to 50. Similarly, there is an option to archive indicators that are no longer relevant. When creating a new special indicator, you should select the event parameter and the unit of measurement. There are four available units: standard, distance, time, currency (in Universal Analytics, you could set only an integer number, currency, and time), and data type modification.
Thus, Google Analytics 4 has changed how custom dimensions and metrics are generated, the scope of application, and data transmission capabilities.
Data comparison in Universal Analytics and Google Analytics 4
Due to changes in data collection methods in Google Analytics 4, there are new metrics, and some values don’t match their counterparts in Universal Analytics.
Look at key metrics related to users, sessions, page views, events, conversions, and purchases.
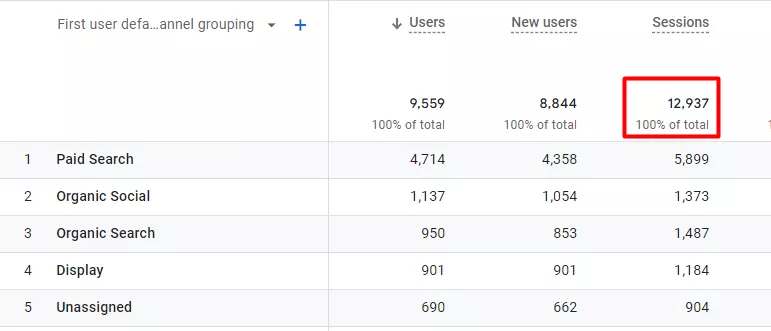
Users
GA 4 adds a new indicator (Total Users, New Users) to the existing ones in Universal Analytics – Active Users. It shows the number of active users over the last 28 days – the key indicator in GA 4 reports that represent User metrics, unlike Universal Analytics calculations based on the Total Users. Accordingly, the data will differ when comparing the number of users in Google Analytics 4 and Universal Analytics.
Project data for a given period:
Universal Analytics
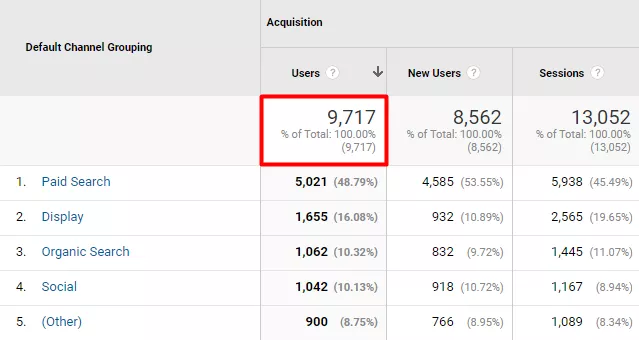
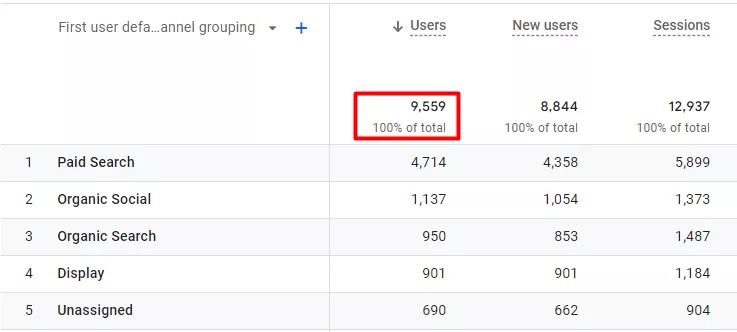
Google Analytics 4
Sessions
As I wrote before, the reinvention of sessions is one of the most noticeable changes in the new version.
A session starts with the session_start auto-event. If you change campaign parameters or midnight points, the session doesn’t stop.
Project data for a given period:
Universal Analytics
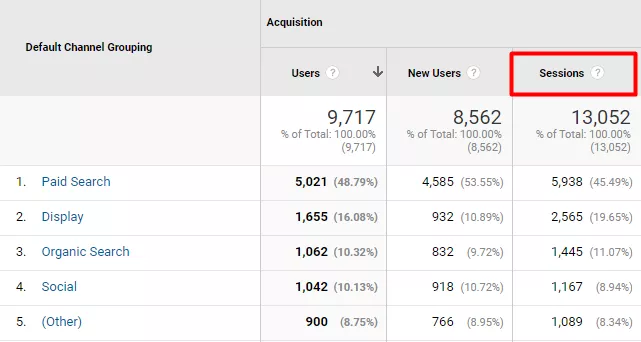
Google Analytics 4
Average Session Duration in Universal Analytics and Average Engagement Time per session in Google Analytics 4 are different metrics that don’t match. The official reference suggests the following definitions:
Average Engagement Time – the duration of app or site use on devices in active mode.
What causes this difference? Some events logged on sites or apps that stay inactive add to the session duration yet are not included in the Interaction Time and are not included in the Average Engagement Time calculation.
Another change is the addition of the Bounce Rate to Google Analytics 4 Engagement rate. While in Universal Analytics, the
Pageviews
As for pageviews in Google Analytics 4, there are some innovations that do not directly affect numerical changes.
In GA 4, a pageview is an automatically recorded page_view event.
There is an option to register Pageviews (Views), but no Unique Pageviews indicator exists.
Unlike Universal Analytics, the number of pageviews and app screens are displayed on the same resource.
The difference in the number of views in Google Analytics 4 and Universal Analytics comes from different methods of counting events and users.
Also, in Google Analytics 4, there is no indicator for Average pageview duration. Still, there is a similar variant, Average Engagement Time – the average time when the app or site was active.
Events
A close counterpart of the Total events indicator in Universal Analytics is the Event count in Google Analytics 4, but they may have different values because:
- events, mind you, have a different semantic definition in the new version of analytics;
- GA 4 uses a different data collection technique.
That is, these are different indicators, and you need to keep this in mind not only when comparing data but also when migrating data from Universal Analytics to Google Analytics 4.
Conversions
There are a series of significant differences between Universal Analytics and Google Analytics 4 in conversion registration, which makes it challenging to compare
- In Universal Analytics, conversions are defined by goals, while in Google Analytics 4, by events.
- Universal Analytics supports five goals (Destination goal, Duration, Pages per Session, Smart Goals, and Event Goals), whereas Google Analytics 4 features only Conversion events.
- While Universal Analytics counts one conversion per session, Google Analytics 4 does not link conversions to sessions (another indirect proof that you may forget about sessions 🧐).
Purchases
The last indicator I want to cover – Purchases. These indicators can be compared and should be very close in quantity. There are differences in building product arrays for Universal Analytics and items for Google Analytics 4. But significant differences in the purchase reports of the two analytics versions can indicate a configuration error – a signal to do a second check.
Something worth remembering
- Google Analytics 4 is more than just an improvement to Universal Analytics. It’s a new way of collecting and processing data, opening up new analysis opportunities.
- The structure of site interaction has been simplified to User-Events, and a chain of changes in user morphology, events, parameters, and many metrics data is built around this pattern.
- Sessions are becoming irrelevant in the new interaction model.
- In Google Analytics 4, the methodology for generating specific parameters and metrics has changed, as well as the scope and data transfer capabilities.
- A new approach to understanding events, their structure, and, therefore, the model of their definition.
- New indicators appeared in Google Analytics 4 due to the changes in data collection methodology, and some of the usual Universal Analytics indicators have lost their relevance.

 6
6
 2
2
 2
2
Recommended theme posts
Related Articles
Display Advertising Effectiveness Analysis: A Comprehensive Approach to Measuring Its Impact
In this article, I will explain why you shouldn’t underestimate display advertising and how to analyze its impact using Google Analytics 4
Generative Engine Optimization: What Businesses Get From Ranking in SearchGPT
Companies that master SearchGPT SEO and generative engine optimization will capture high-intent traffic from users seeking direct, authoritative answers
From Generic to Iconic: 100 Statistics on Amazon Marketing for Fashion Brands
While traditional fashion retailers were still figuring out e-commerce, one company quietly revolutionized how U.S. consumers shop for everything from workout gear to wedding dresses