Google Looker Studio, formerly known as Google Data Studio, is a powerful tool for data visualization and analysis. Using this tool, you can easily create interactive reports in the form of dashboards.One of the key features of this tool is data blending. In this article, I will tell you how to use this feature and also discuss its main advantages and limitations.
What is data blending in Google Looker Studio?
Data blending is a built-in feature of Looker Studio that allows you to simultaneously create graphs, tables, and widgets based on multiple sources.
For example, you can use it to combine data sets from Google Analytics, Google Ads, and Google Search Console into a single report.
You can also integrate information from many other services, not just Google products, as there are over a thousand supported connectors. And if you can’t find a suitable connector among the readily available ones, you can create your own.
Why combine data?
In simple terms, combining data will give you a more complete picture of business processes. You can then perform comprehensive analysis and make informed decisions.
Combining data also allows you to spend less time gathering and processing information and simplifies generating regular reports.
You may even uncover hidden relationships. Here are a few examples illustrating this.
Example 1. An online store has to compile details about transactions stored in the site database. However, the reports are generated in different tables: the first table contains the date, order number, and purchase amount, while the second one contains the date, order number, buyer’s name, phone number, shipping address, information about the purchased goods, and order status.
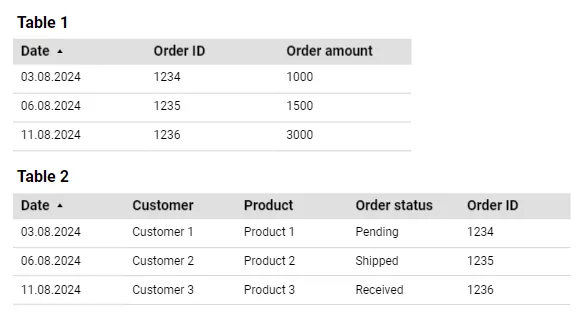
By combining them, you get the following table, which is much easier to analyze.
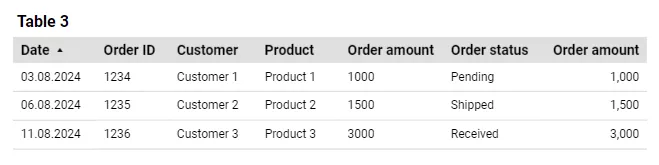
A small table may be easy to merge manually. However, manual merge is ineffective if you are working with a large amount of information.
Example 2. An online business used several sources to obtain data, such as Google Analytics, Google Ads, and Google Search Console. To compare data from multiple sources, the analysts had to place different widgets side by side. It looked like this:
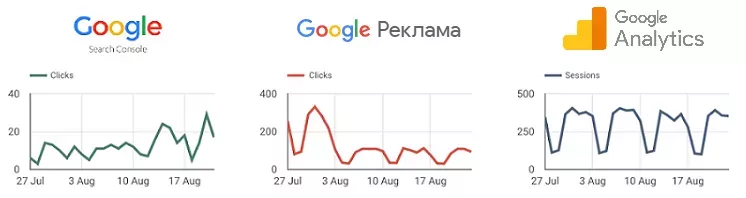
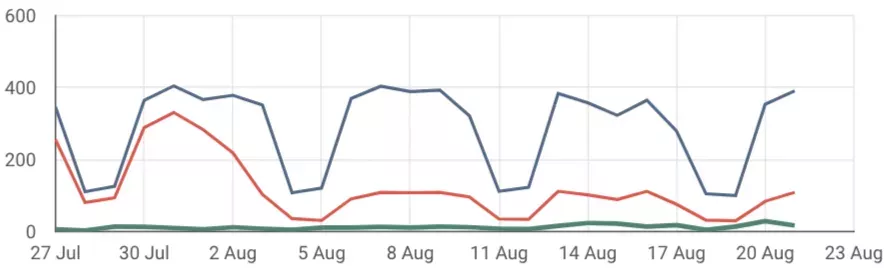
After data blending, the information was combined into a single diagram, making the relationships between them more obvious. The data analysis process became much more effective.
Read our blog to learn how to connect GA4 with Looker Studio.
What to know before data blending
To use Google Looker Studio effectively and avoid mistakes, there are two key things to keep in mind.
Data blending conditions
You need a common parameter called the join condition. This parameter used to be called the join key.
In the first example above, the “Order ID” parameter was used as the join condition for the online store. This unique identifier linked information from different tables for an order.
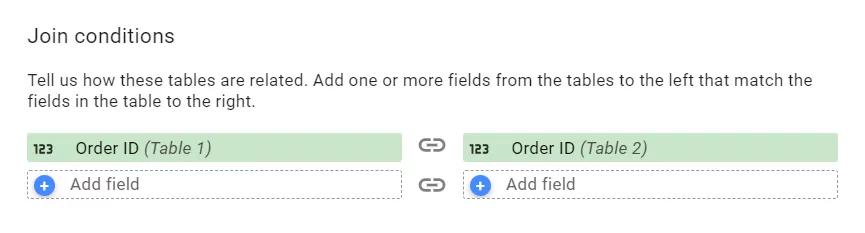
For more complex tables, you can use multiple join conditions.
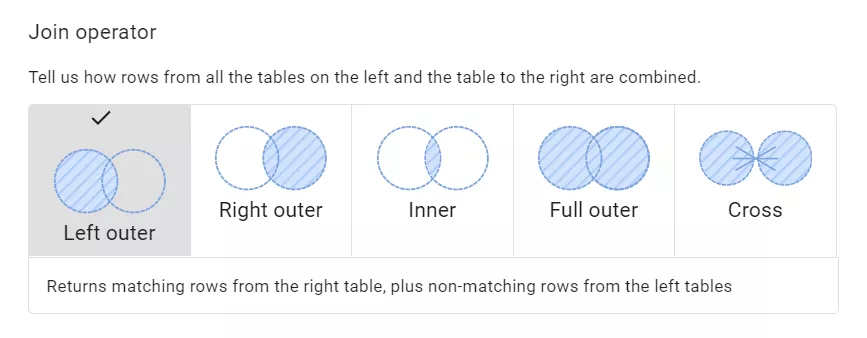
Data join operators
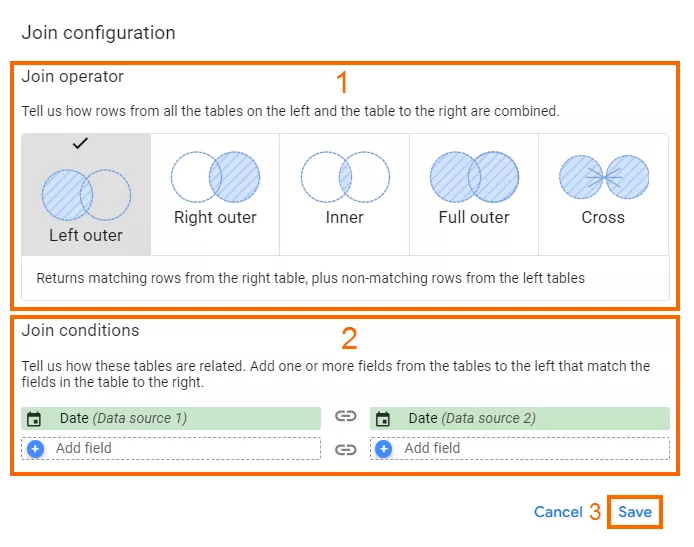
Another parameter that you can select is a join operator, which used to be called a join type.
The data join operator allows you to specify how the rows of the left and right tables are joined. The following join operators are available:
- Left outer merge allows you to use all rows from the table on the left and matching rows from the table on the right.
This type of merge is especially useful when working with the main table, where you want to keep all records regardless of relationships. For example, to show all customers, even if they have no orders or when working with reference data.
- Right outer merge means non-matching rows from the left table are not used.
It is used less frequently, mainly for data integrity checks, during migration to identify “lost” relationships, or when logically the right table is the primary one in the context of the query.
- Inner merge means that only rows that exist in both tables are used.
It is optimal when you need only complete linked records, when working with transactional data where the link is mandatory, or when the absence of a link means incorrect information.
- Full outer merge means that all rows from both tables are used, regardless of whether they match.
It is especially useful for analysing data integrity between tables, finding inconsistencies in related systems, and creating reports that require full coverage of information.
- Cross merge means that all available combinations of rows from both data sources are merged without the need to select a merge condition.
It is most suitable for generating test datasets, creating all possible combinations (for example, for a table of clothing sizes) or in mathematical calculations that require going through all the options.
Choosing the right data association operator is crucial: it ensures the results will be accurate, complete, relevant and efficiently processed. It also ensures the relationships between data are correctly represented and prevents interpretation errors and duplication.
For more tools, see what data visualization is and how it can simplify the way you work with information.
How to combine data in Google Looker Studio
There are two main ways to combine data: the quick widget merge and step-by-step blending of data sources using the Resources menu.
Combining widgets
If you already have separate widgets to combine, this is the easiest way to combine data. Here are the step-by-step instructions:
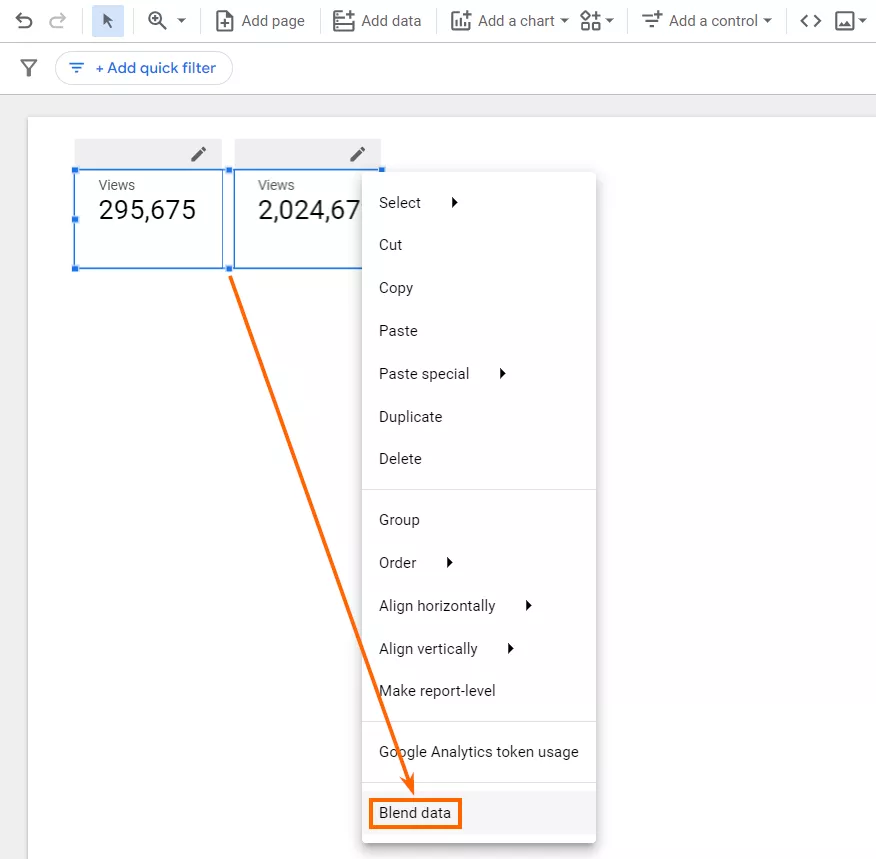
- In Looker Studio, create two graphs, tables, or widgets that you want to merge.
- While holding down the Ctrl key (or Cmd on a Mac), click to select both objects.
- Right-click and choose “Blend data”.
Blending from the Resource menu
This method is a bit more complex, but it allows you to create links between multiple data sources and customize different fields for a more accurate analysis. To join data using this method:
- Go to the “Resource” menu and select “Manage blends”.
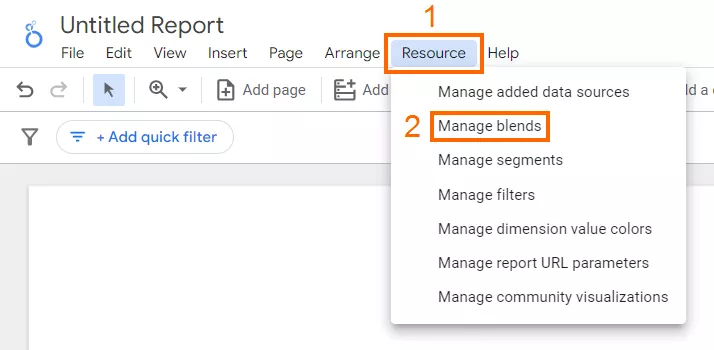
- Click “Add a blend” in a new window.

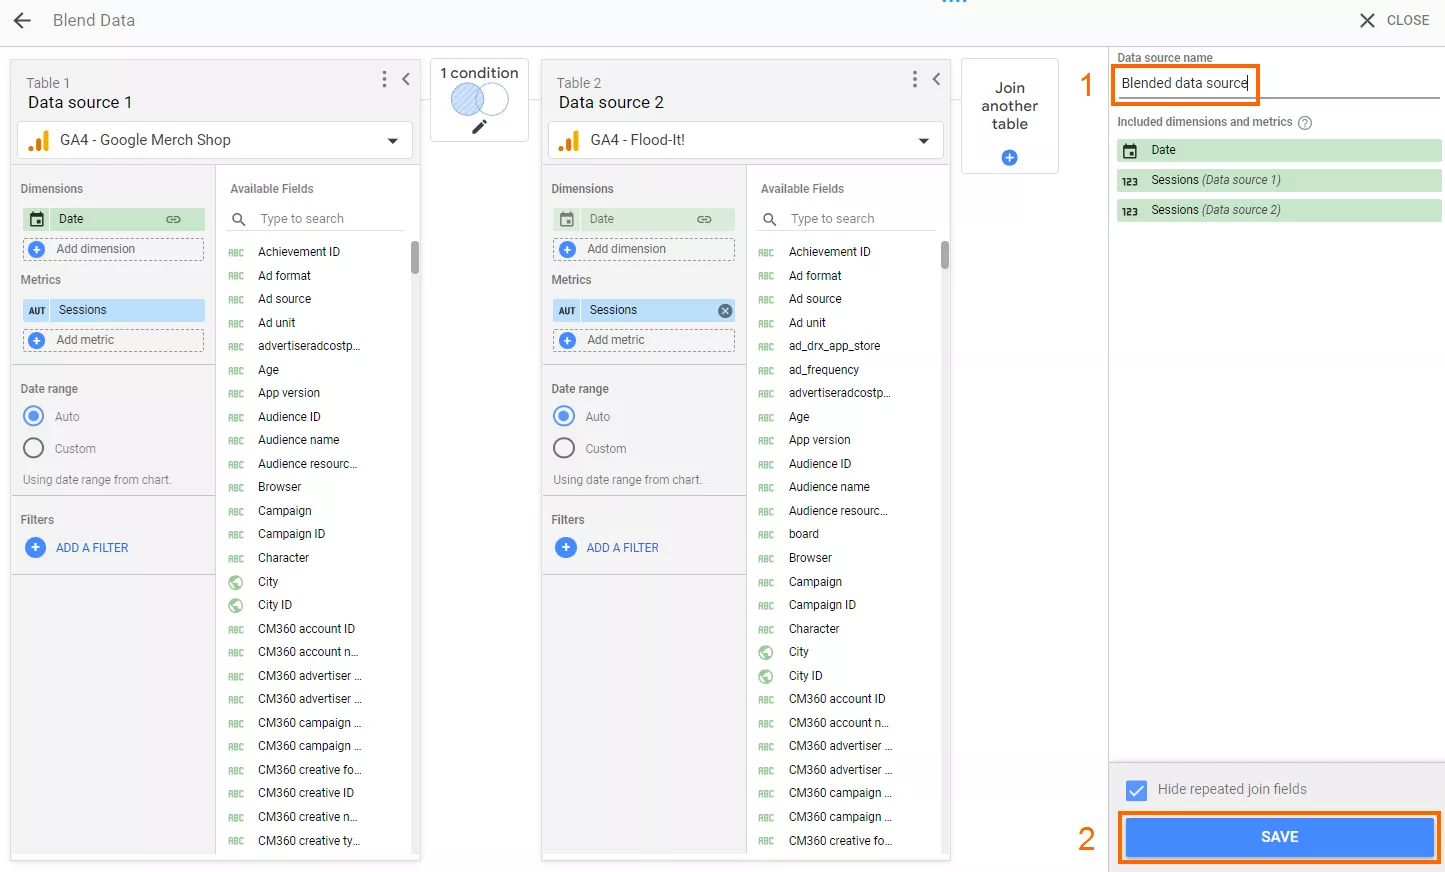
- Select the desired data source, parameters, and indicators.
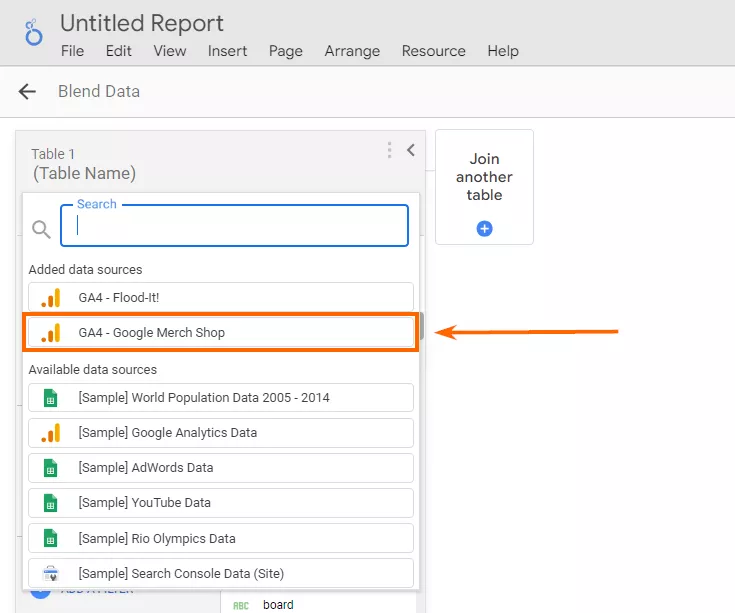
In this example, I specified the source “GA 4 — Google Merch Shop source”, one of the resources of the GA4 demo account, the “Date” parameter, and the “Sessions” metric.
- Click “Join another table”.

- Select the second data source, the required parameters, and the indicators.
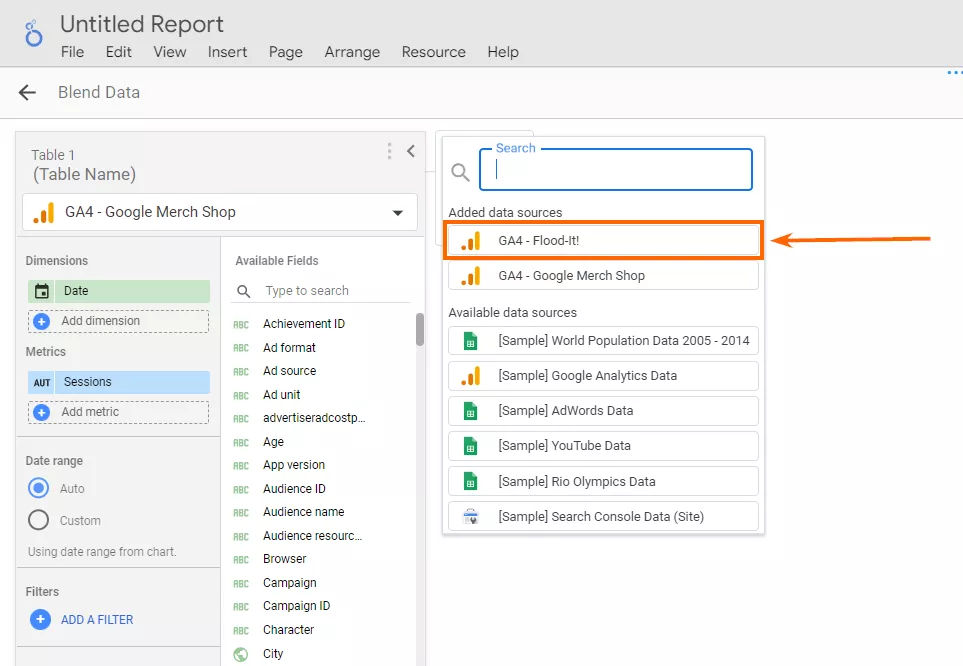
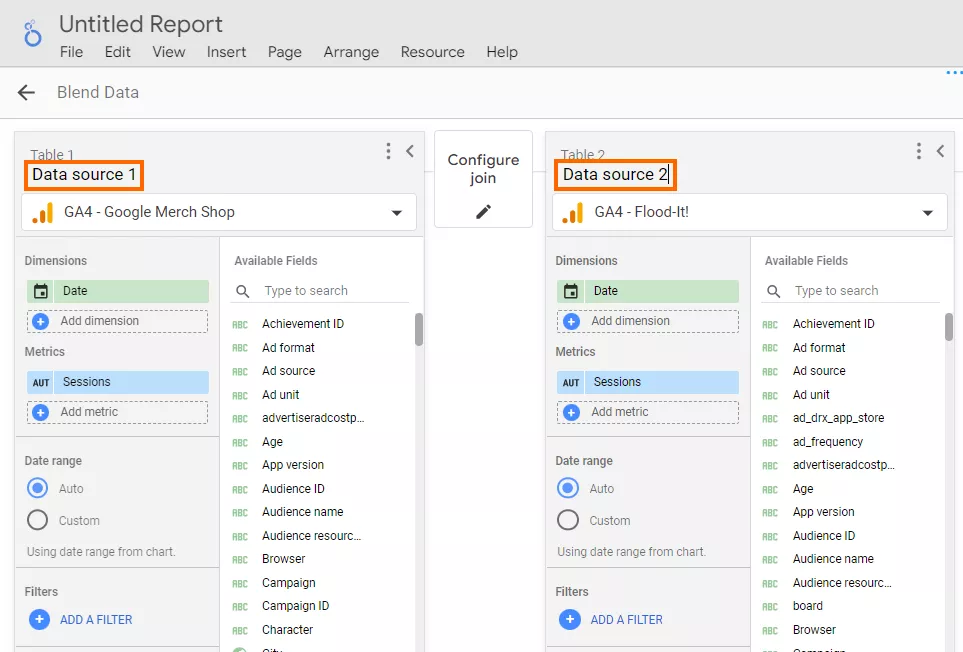
In the provided screenshot, the selected source is “GA 4 – Flood-It!”, one of the resources of the GA4 demo account. - Name the selected data sources (optional). For example, “Data Source 1” and “Data Source 2”.
- Click “Configure join”.
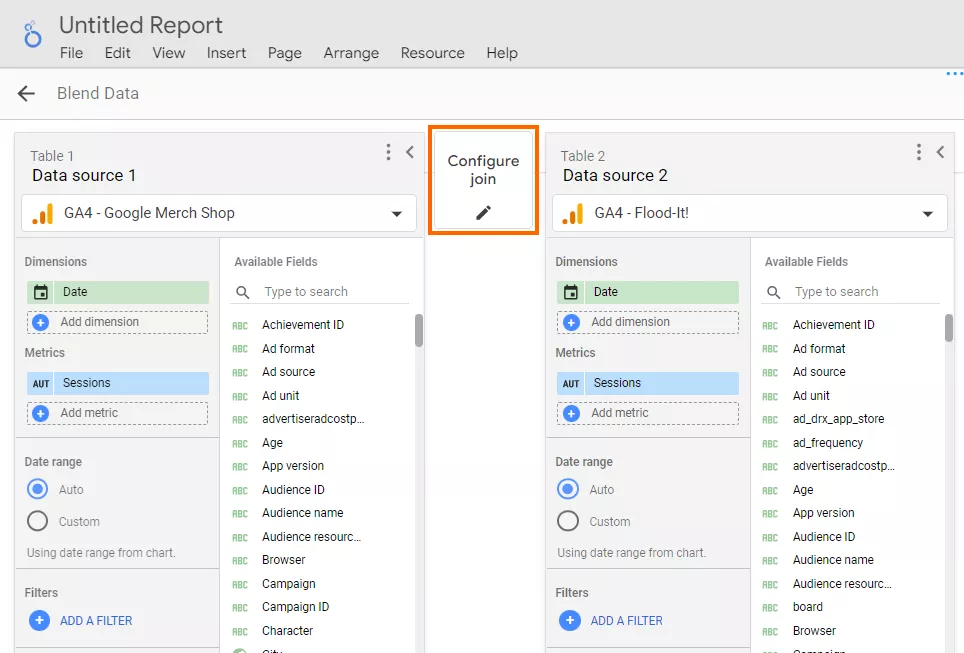
- Select the desired join operator and conditions in a new window, and then click the “Save” button.
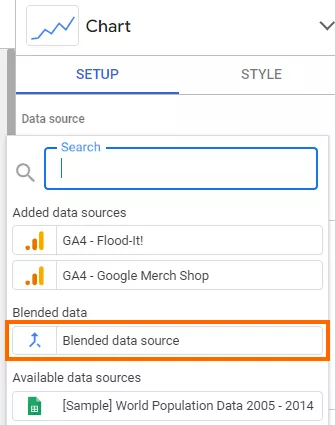
- To use the combined data, first add a graph. Then, open the “Data source” drop-down list and select the blended source you created earlier.
After completing these steps, you will see a graph displaying data from the combined sources.
Advantages of data blending in Looker Studio
Data blending with Google Looker Studio has many advantages compared to similar tools.
- Interactivity. Based on the combined data, you can create dynamic reports that are easy and convenient to interact with.
- Intuitive interface. An easy-to-use workspace and tools allow you to combine and visualize data without programming skills or other specialized knowledge.
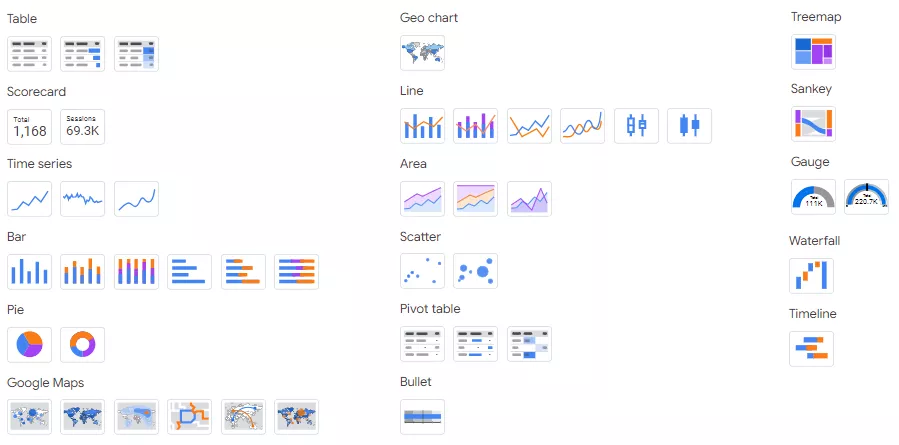
- Flexibility. A wide range of visualizations, graphs, charts, maps, etc., can help you present the combined data most effectively.
- Automation. You don’t need to repeat the process of combining data every time it is updated, as Looker Studio does it automatically. You can also customize how often the information is updated:
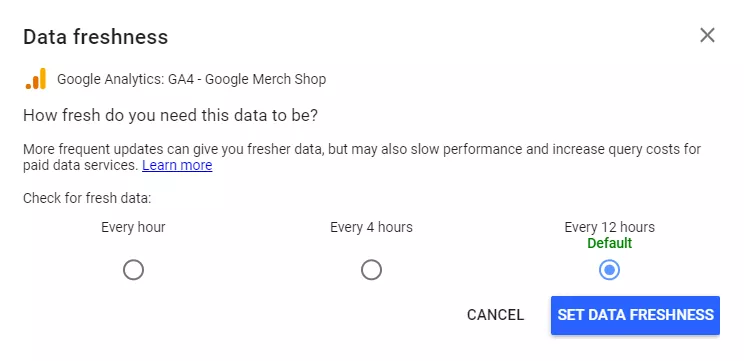
To access this menu, select “Resource” in the main menu, then go to “Added data sources”, click “Edit”, and then “Data freshness”. - Sharing. Google Looker Studio lets you share your reports and sources, including merged sources, with colleagues and clients. This makes it easy to give them access to the information they need.
- Availability. The basic version of Looker Studio, which includes the data-matching feature, is free.
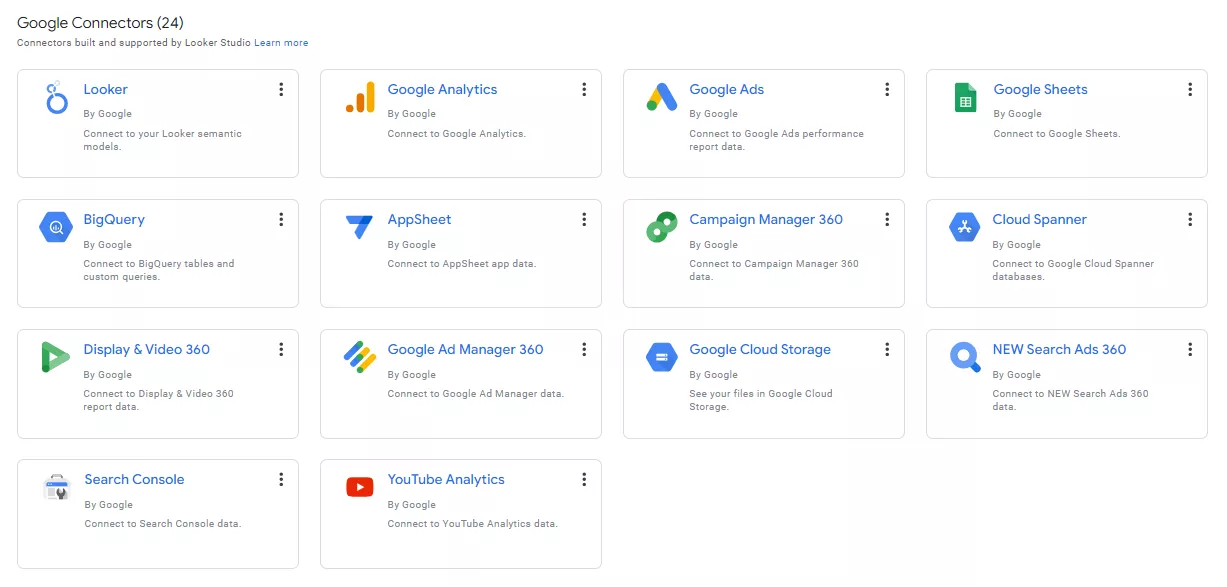
- Compatibility. Google Looker Studio offers a wide range of integration options with many popular services and data sources. These can be broadly categorized as follows:
- Google services. The tool provides built-in support for Google Analytics, Google Ads, Google Tables, and other Google services.
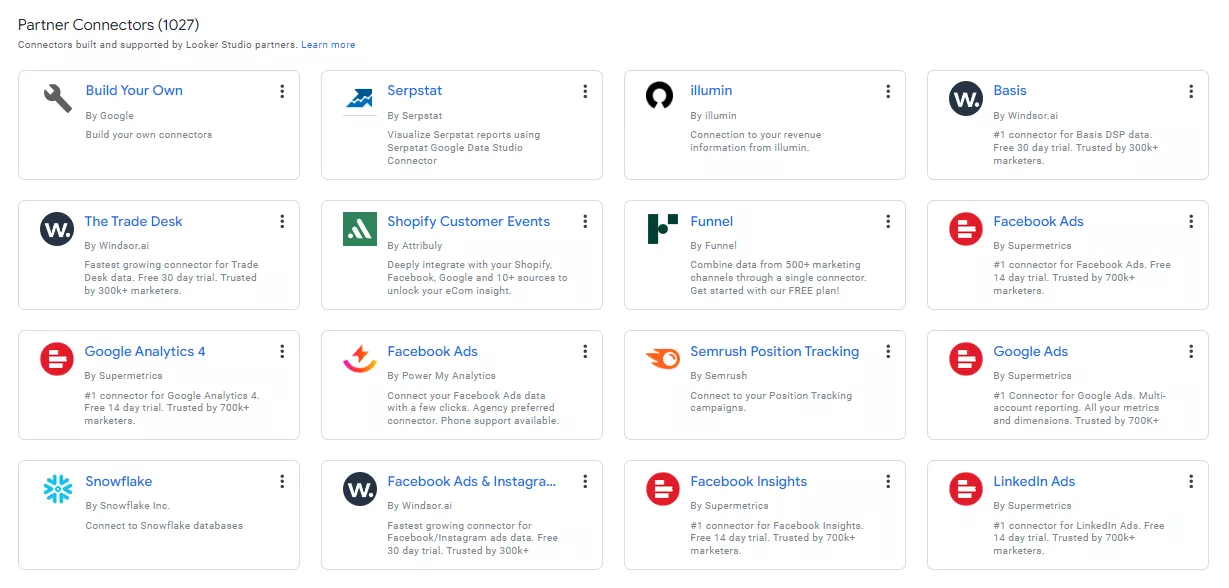
- Third-party connectors. In addition to integration with Google products, there are a large number of pre-built connectors (1027 at the time of writing) for many other popular services, such as Facebook Ads, Salesforce, Mailchimp, and others. You can also create your own connectors for specific needs.
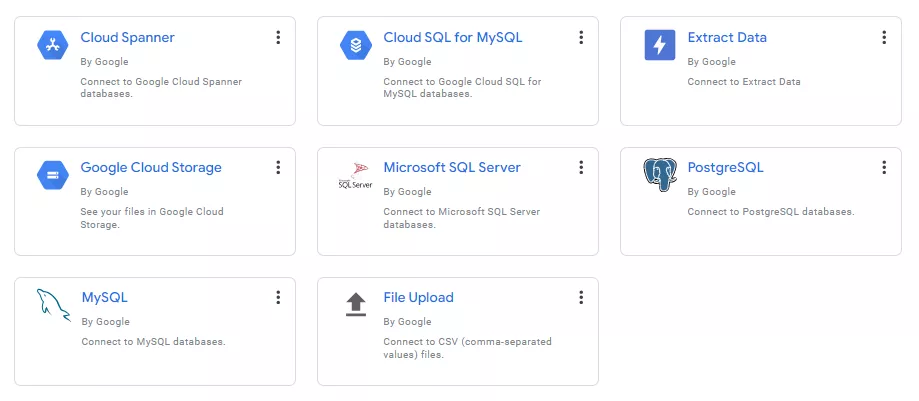
- Other sources. The service supports merging databases (e.g., MySQL, PostgreSQL) and connecting to APIs and many other sources. It also offers the ability to upload CSV files.
Data blending limitations in Looker Studio
- The data sources to be merged must have at least one common join condition (formerly known as the join key).
- You cannot merge more than five sources or add more than 10 parameters from each source.
- It is difficult to check the correctness of data blending because all operations are hidden from the user, and it is impossible to view the obtained raw data.
However, in practice, with the correct merge settings and data preparation, the results are correct. It's important to check the matching of keys, the relevance of information before joining, and, if necessary, test on small data sets.
- Combining multiple data sources (more than two) may slow down Looker Studio because each requires a connection to a separate API. This requires additional processing power, which is not always available.
- You cannot select the reusable type, only the embedded type. This means that the merged data in one report cannot be reused in another, except by copying the entire report.
Conclusions
Google Looker Studio’s data blending feature allows you to create comprehensive reports by combining information from multiple sources. There are several benefits to data blending:
- Improve the presentation of data, making it more informative and analytically valuable.
- Dramatically reduce the time it takes to create reports by automating the process.
- Reveal hidden patterns and dependencies that are not obvious when working with separate sources.
Please note that this feature also has some limitations to be aware of, such as a limit of five data sources and difficulties in checking the correctness of data blending.
FAQ
Why is data merging not working in Looker Studio?
If data merging does not work for you in Looker Studio, there may be several reasons causing this:
- Incorrect merge settings. Check the data blending configuration and make sure that all sources have the correct merge conditions set. Errors in these settings will be indicated by a red outline.
- Problems with the data sources. Check that the data sources have been added correctly, and reconnect them if necessary. Make sure that the merge sources have common fields with appropriate formats and that you have the permissions required to access them.
- Problems with the results of the blending. If the problem is with the results and Looker Studio does not indicate a specific cause, you may need to investigate the data sources themselves. For example, if they are in BigQuery, try merging them there to determine the cause of the error.
How do I combine data from GA4 and CRM in Looker Studio?
To combine data from Google Analytics 4 and the CRM system in Looker Studio, you need to follow the same steps as for any other data source, namely:
- Add both data sources to the report.
- Create a new data combination by going to the “Manage blends” item of the “Resource” menu item and clicking the “Add a blend” button.
- Select the added GA4 and CRM sources as the data sources to blend.
- Customize the combination by selecting the required parameters, metrics, and join conditions.
- Save the merge and apply it to the appropriate report elements.
Can I combine more than two data sources in Looker Studio?
Yes, you can combine up to five different sources and add up to 10 parameters for each source. However, keep in mind that combining several data sources will require additional processing power to avoid slowing down Looker Studio.

 5
5
 2
2
 3
3
Recommended theme posts
Related Articles
How to Set Up Consent Mode in GA4 on Your Website with Google Tag Manager
Let's explore how to properly integrate consent mode in GA4, configure it for effective data collection, and at the same time comply with GDPR and other legal regulations
Display Advertising Effectiveness Analysis: A Comprehensive Approach to Measuring Its Impact
In this article, I will explain why you shouldn’t underestimate display advertising and how to analyze its impact using Google Analytics 4
Generative Engine Optimization: What Businesses Get From Ranking in SearchGPT
Companies that master SearchGPT SEO and generative engine optimization will capture high-intent traffic from users seeking direct, authoritative answers