How To Use Google Trends – SEO Guide For Beginners
What do your customers care about today? Will they be interested in your product in six months? The success of advertising largely depends on seasonality, the popularity of the topic, and the ability to react quickly to trends. You can "catch the wave" with the help of the free service Google Trends. In this post I described its features and tools in detail.
What is Google Trends
Google Trends is a tool that collects data from Google search queries. Thanks to it, users can determine the popularity of any query in a selected region and in a certain period of time. Trends is a tool that helps you scale your business and better understand the needs of your target audience. Users use it to track trends in sports, political issues, entertainment or other areas that relate to their interests.
Data from Google Trends can be sorted by time, such as the last seven days or by a certain range. This free online tool provides data for analysis that will be useful especially to webmasters and SEO optimizers who work with sites that offer seasonal products or services.
What tasks does Google Trends help solve?
Google Trends is a simple and convenient tool for analyzing the popularity and seasonality of search queries. In just a few minutes you can:
- Determine topic popularity and existing trends.
- Analyze seasonality in your market.
- Evaluate the influence of geographical data on the popularity of certain search queries or topics in general.
Let's consider using the service with the help of concrete examples.
How To Use Google Trends
On the main page, you see a dashboard with ready-made examples of Google Trends reports. You can use them to create your own, simply by changing geolocation and/or keywords.
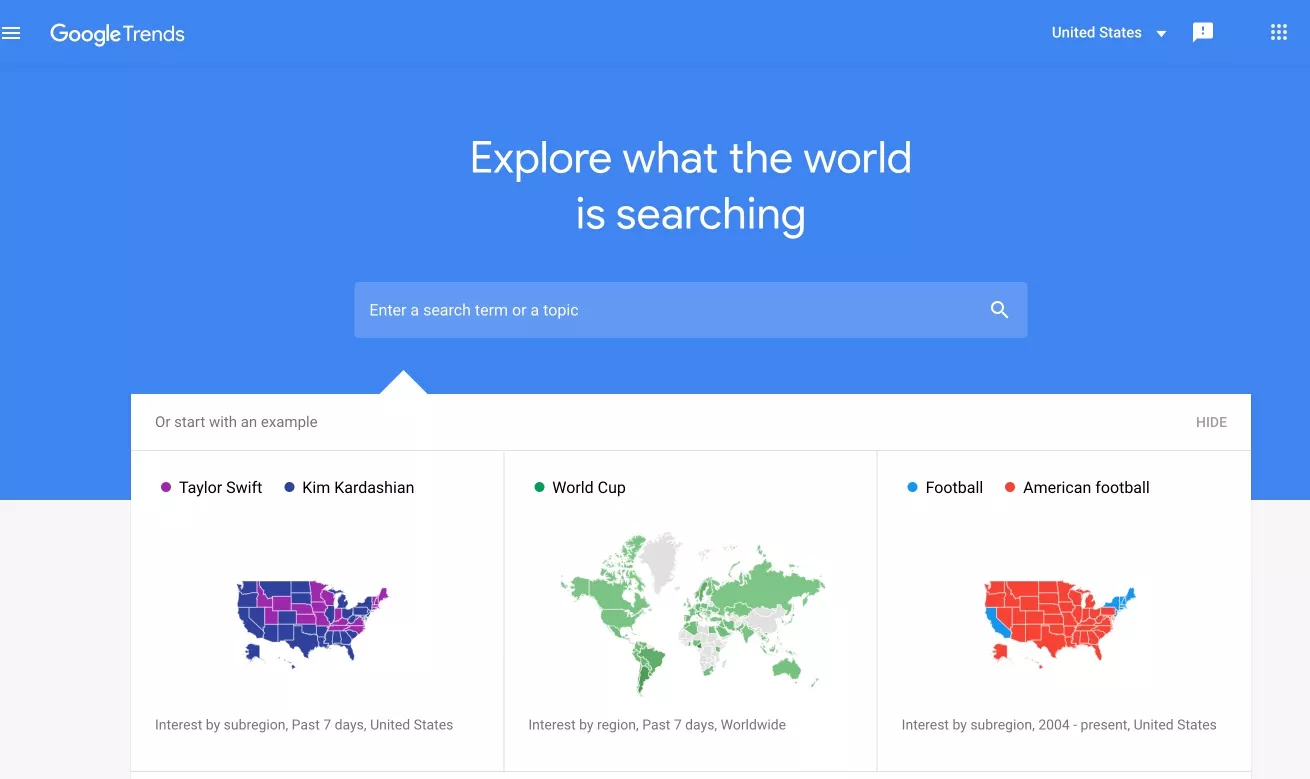
There you can also see lists of the most popular searches and relevant news, which are updated once an hour:
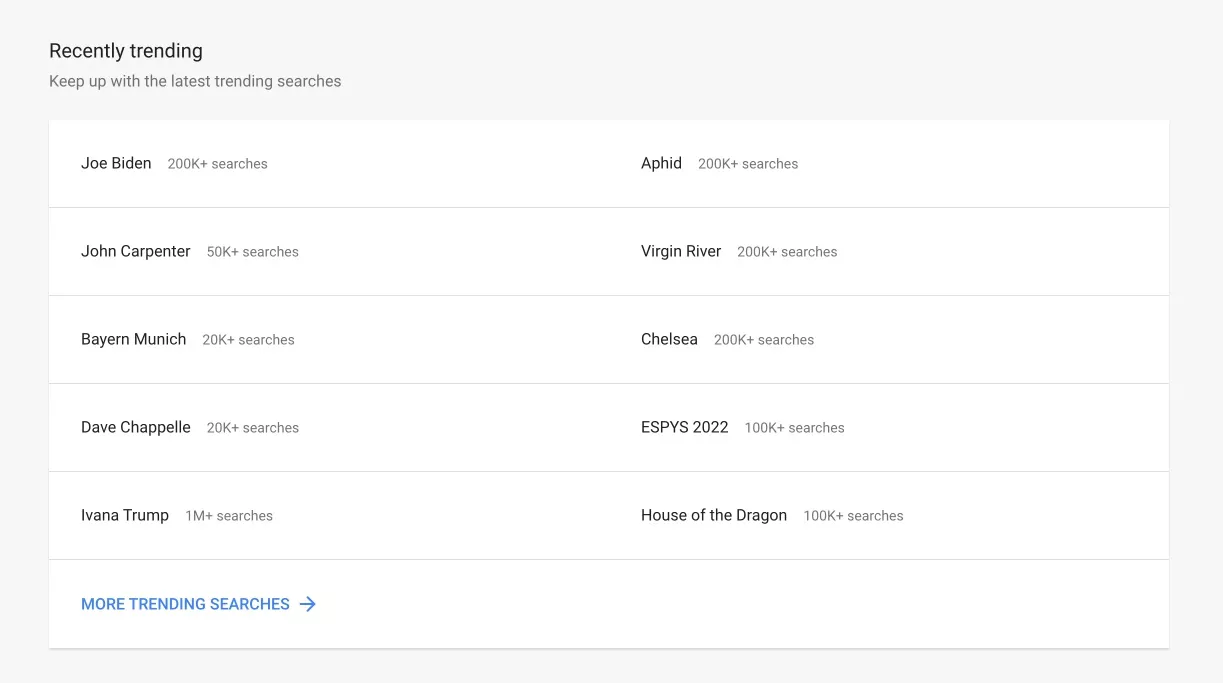
The home page features can be useful if you're doing contextual advertising for a news site. By tracking the dynamics of topic popularity in Google Trends, you can always show your ads for the most relevant search queries.
How to know the dynamics of search queries with Google Trends
When planning your ads, be sure to consider the rise and fall of demand in order to choose the right strategy and calculate your budget.
Google Trends is used to evaluate the effect of branding campaigns, because the service allows you to see information even for the last hour. You can clearly see on the graph how the dynamics of the popularity of branded queries for a new product on the market is growing.
So, let's move on to the analysis of specific queries.
1. Entering a search query
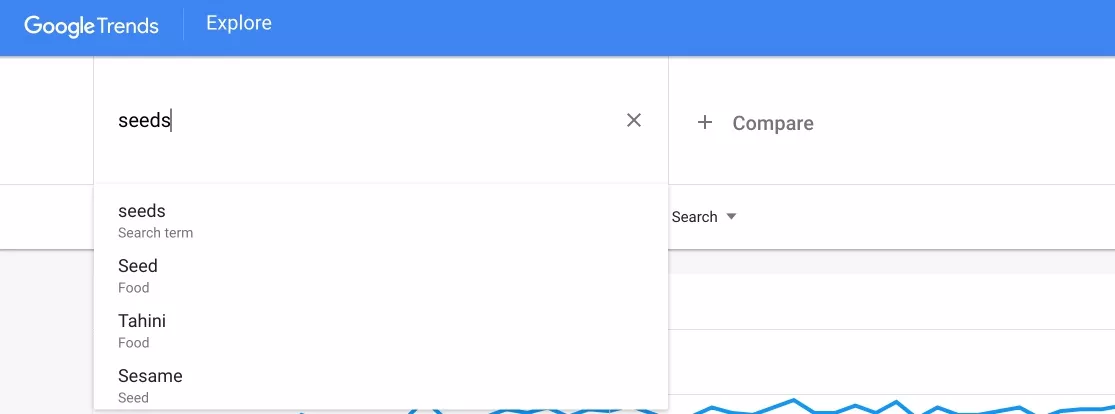
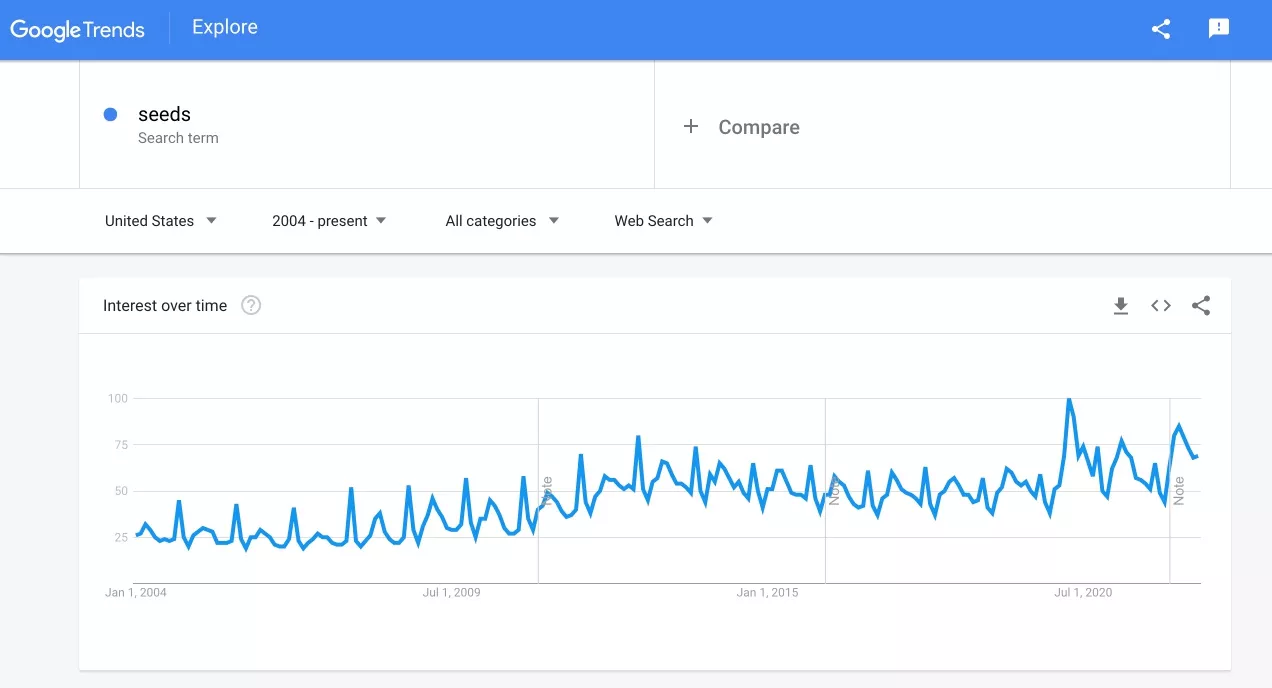
In the search bar, we enter a search query that interests us.
I advise you in the beginning to take general search queries in your topic, to have a maximum of data for analysis, and only then move on to the medium-frequency. For example, assessing the seasonality of demand in the topic "seeds for the garden", first we enter the query "seeds" and press Enter.
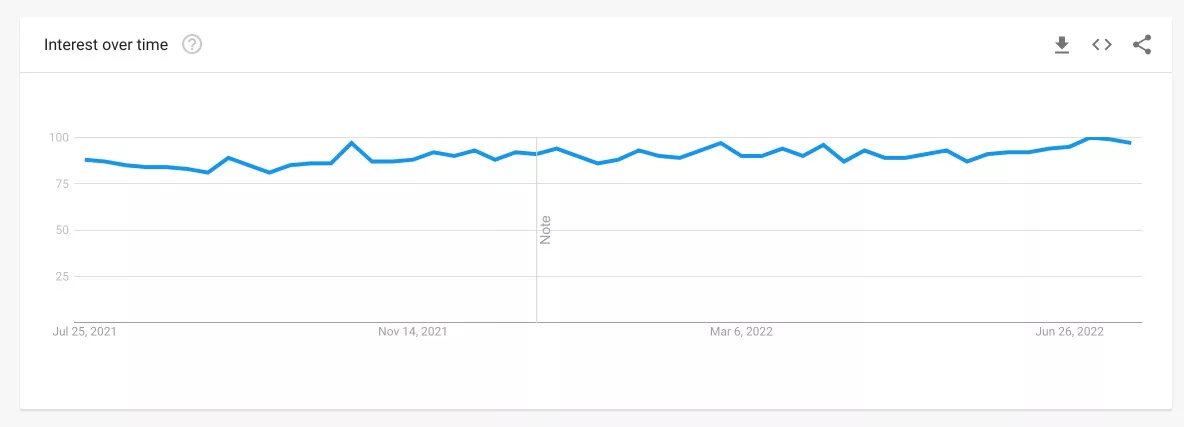
You will see the dynamics of the popularity of this query.
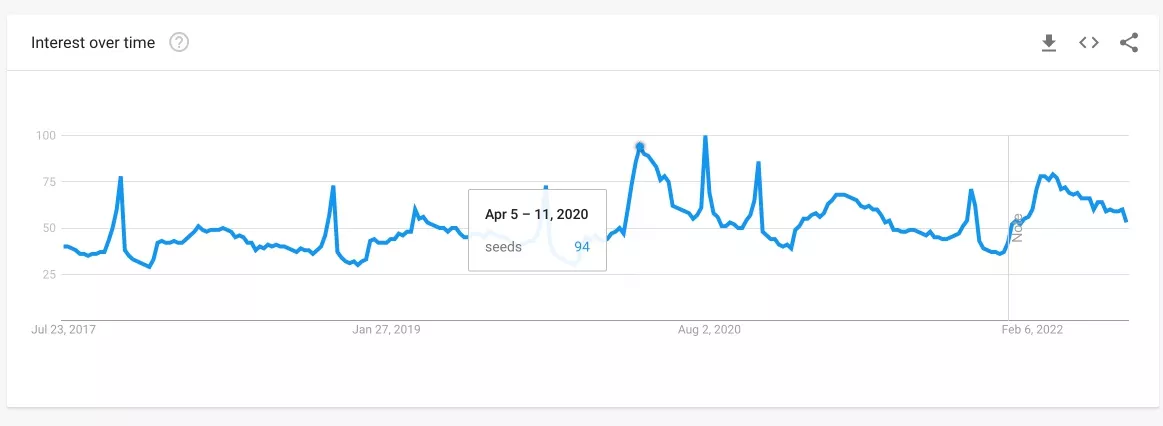
If you hover your mouse over a particular point on the graph, you'll see more detailed information about the performance at a particular point in time.
It's important to understand how the Google Trends search demand score works: you can only see relative values.
Google algorithms determine the point on the graph for the selected period when the query was most popular, and take it as 100. All other points on the graph are determined as a percentage of the maximum.
Back to the drop-down menu below the search bar. Here you can select the settings that will determine what data Google Trends shows.
1.1. Region. You can see statistics for the whole world, as well as to know the popularity of the query at the country or city level.
1.2. Period. Any period since 2004.
1.3. The category to which the search query belongs. This function is useful if the search query has two absolutely different values. For example, analyzing the query "show", we will use the category "Arts & Entertainment" to specify that it is a TV show we are referring to.
1.4. Type of search. We can analyze Internet searches, picture searches, news searches, as well as YouTube searches and Google Shopping searches.
2. How to use search operators in Google Trends
Google Trends has special operators for effective keyword queries.
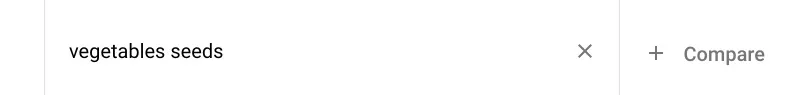
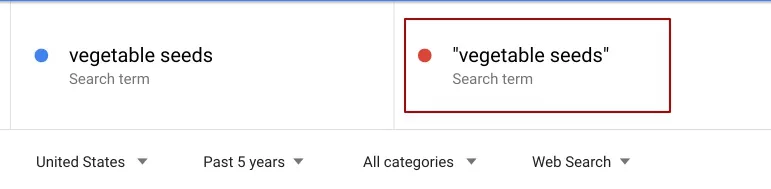
2.1. For a query without operators, you will see all variants containing the entered search term in any order, as well as close search queries like "vegetables seeds", "seeds and vegetables", and so on.
2.2. If you enter a query in quotes, we prohibit including similar queries and changing the word order. But the statistics will include queries with additional words, such as "buy vegetable seeds", "good vegetable seeds", and so on.
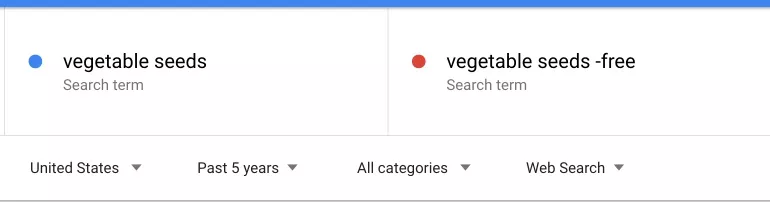
2.3. By using the operator "-" before the text, we will exclude from the statistics search queries that include a certain word, such as "free".
2.4. The operator "+" allows you to add synonyms or misspellings to the statistics.
3. How to compare query trends
You can add up to five different search queries at the same time. For comparison, let's enter trending searches "gifts for Christmas" and "Christmas gifts.
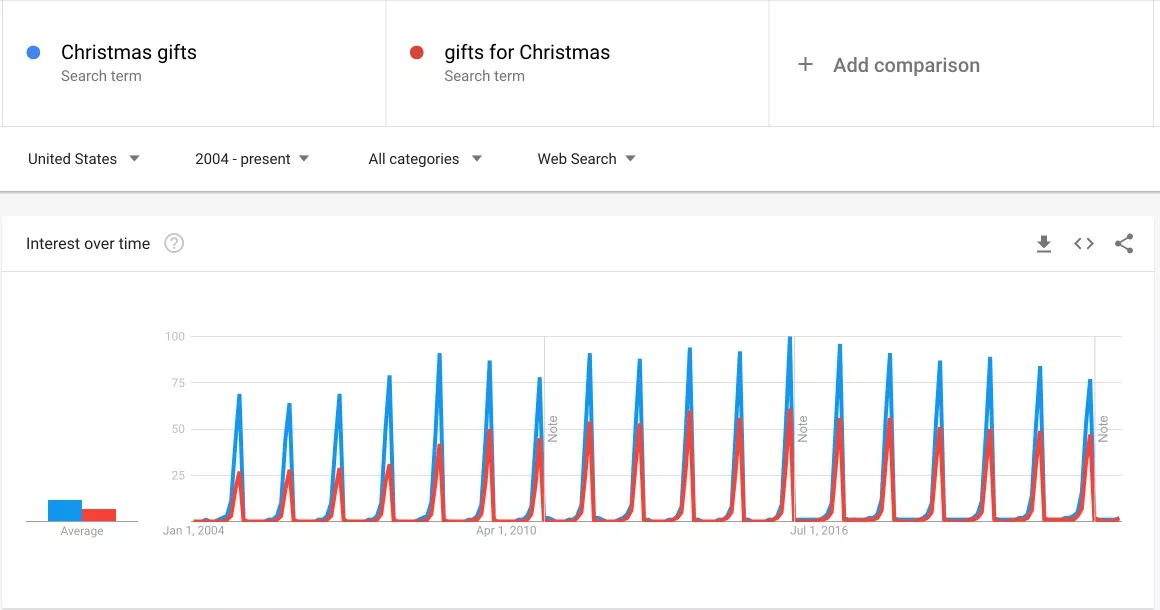
It is already noticeable that every winter there is a strictly pronounced seasonal demand for the categories of "gifts for Christmas.
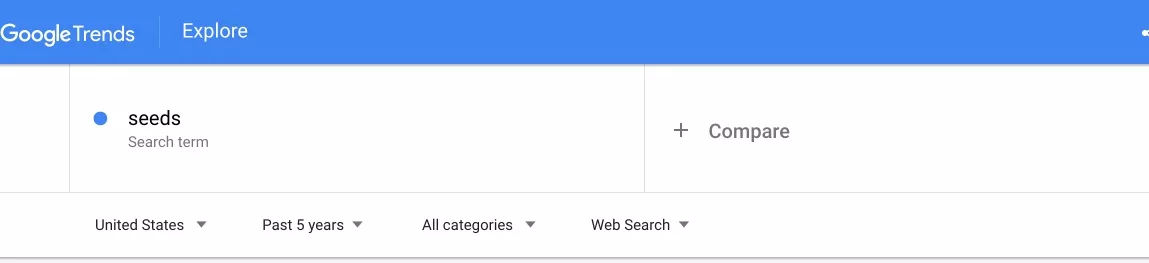
Let's reduce the analysis period to 5 years.
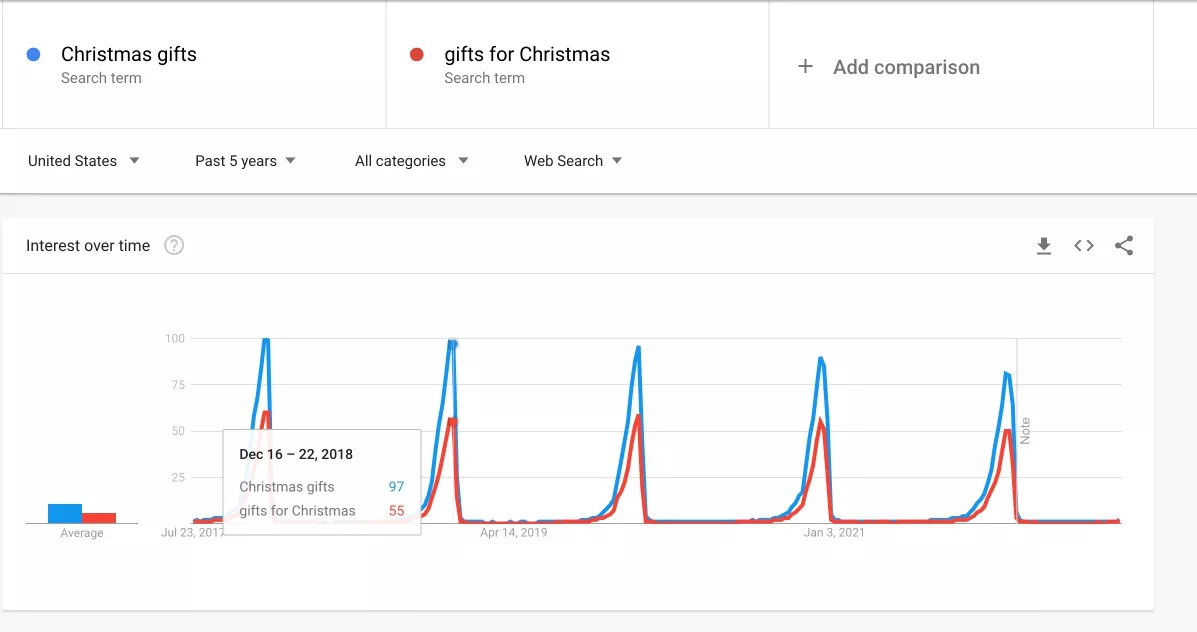
Now we can clearly see: every year the peak of popularity for the category "gifts for Christmas" is in December. In addition, by January, interest drops to a minimum.
Knowing when to expect the peak popularity of the request, you can properly allocate the budget between campaigns and maximize profits.
4. How to analyze statistics by region
One of the important advantages of Google Trends is the ability to analyze data with a detailed breakdown by region. For example, Interest in the "Gardening" topic is very dependent on climate.
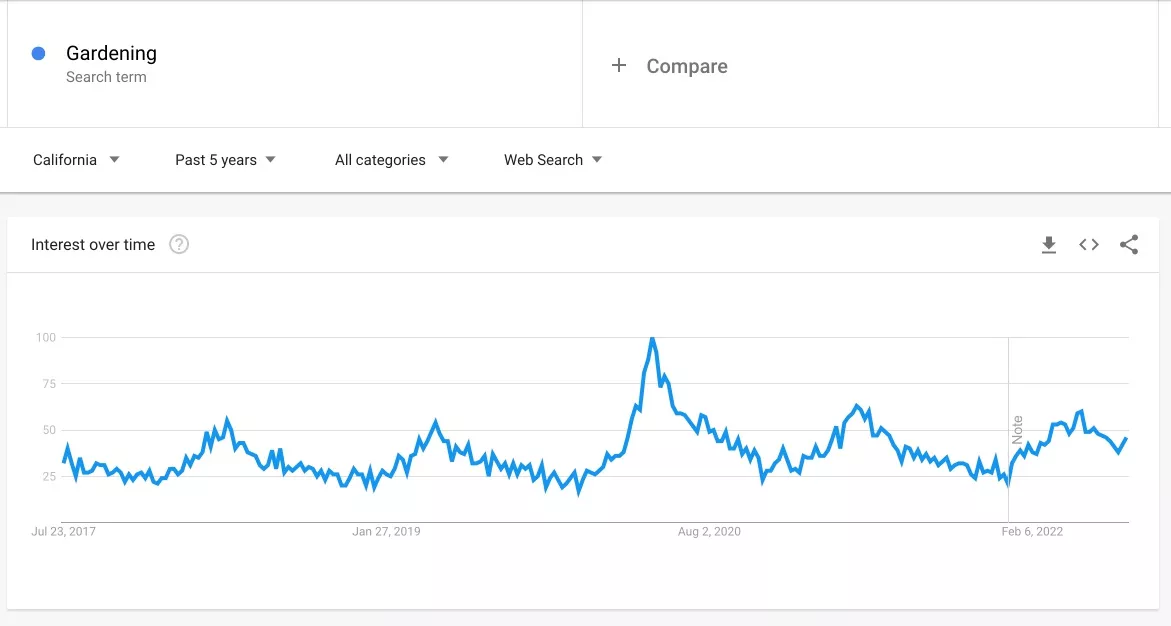
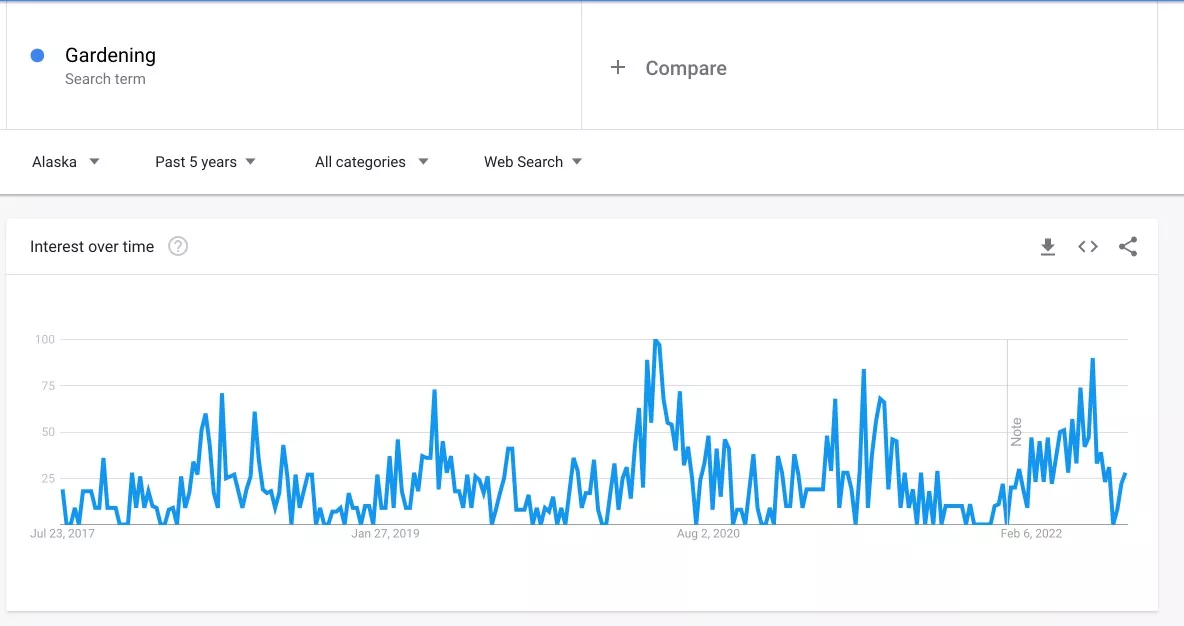
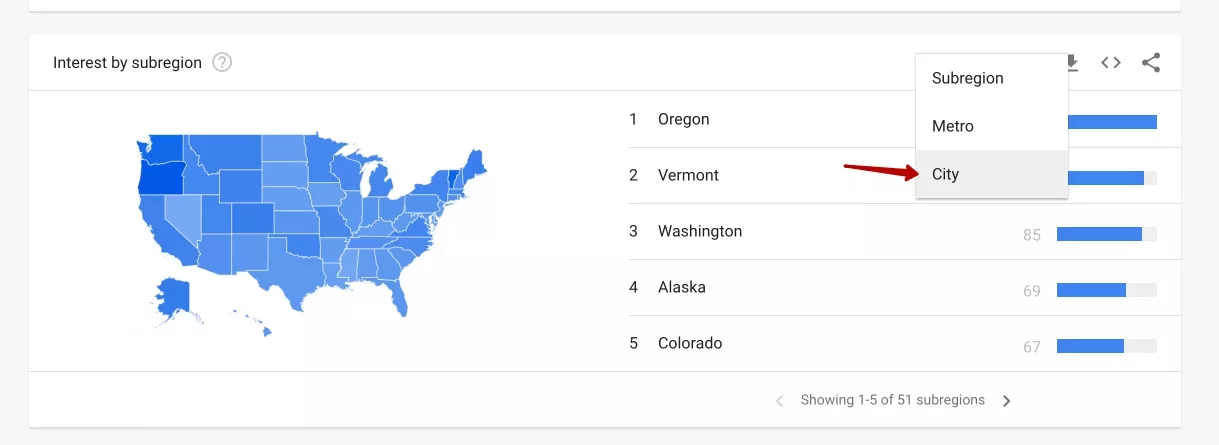
In addition to search engine popularity trends, Google Trends provides information on popularity by region.
In addition to information by country and region, you can easily determine which cities are most often interested in your topic. To do this, go to the tab "Cities".
5. How do I study trends?
At the bottom of the page you can see another useful feature - similar searches and topics. Here you can see what users are typing into searches along with the queries you specify.
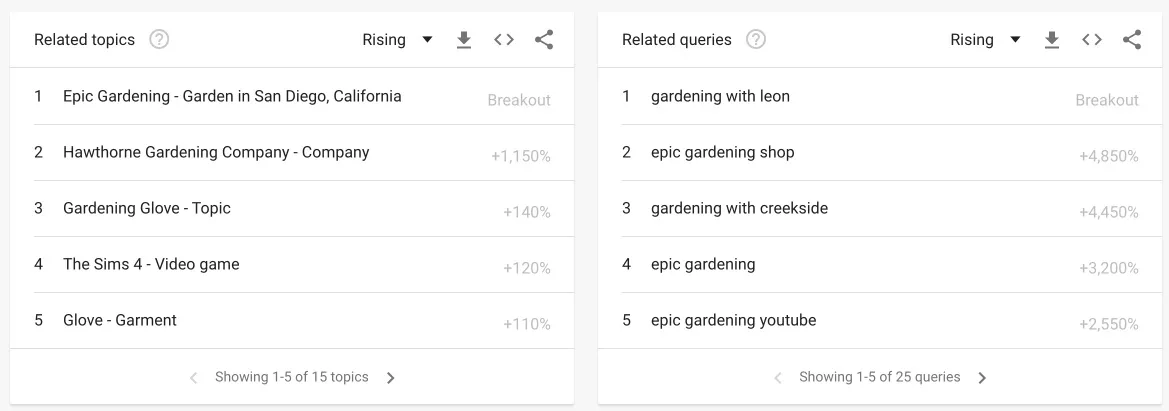
It is worth paying attention to the "Rising" tab - this displays queries that are only gaining popularity. With this feature, you can include the most relevant keywords in your advertising campaign and be one step ahead of your competitors.
The trick. In addition, the analysis of queries in Google Trends can suggest topics for blog posts.
Conclusions
Google Trends isn't designed to collect or analyze the frequency of a large number of search queries, so some internet marketers ignore it. But for analyzing seasonality, current trends or demand forecasting, it's one of the best free tools.
Let's summarize:
- Google Trends can explore general trends and interest specifically for your topic. Analyze the data you get. Start with the most common key queries, gradually descending to a lower level and you will get the most objective picture of consumer demand in your topic. For the most accurate result use special search operators.
- Google Trends allows you to compare statistics for:
- search queries;
- regions;
- time periods.
- Using the different features of Google Trends, you can find out what your target audience lives on, and when users need your product. We recommend supplementing your media plan with analytics based on data from Google Trends.
FAQ
Is Google Trends free to use?
Yes. Google Trends is a free tool.
How do I extract data from Google Trends?
You can unload the received data using the "Download" button. Open the file with a spreadsheet application (instructions from Google).
What does 100 mean on Google Trends?
The Google Trends tool takes the search volume for a specific query and divides it by the total number of search queries over a specific time period. The resulting ratio is then scaled from 0-100. Google's algorithms assign a value of 100 to the maximum number for the period.

 5
5
 1
1
 3
3
Related Articles
How to Set Up Consent Mode in GA4 on Your Website with Google Tag Manager
Let's explore how to properly integrate consent mode in GA4, configure it for effective data collection, and at the same time comply with GDPR and other legal regulations
Display Advertising Effectiveness Analysis: A Comprehensive Approach to Measuring Its Impact
In this article, I will explain why you shouldn’t underestimate display advertising and how to analyze its impact using Google Analytics 4
Generative Engine Optimization: What Businesses Get From Ranking in SearchGPT
Companies that master SearchGPT SEO and generative engine optimization will capture high-intent traffic from users seeking direct, authoritative answers