Understanding Website Speed and Core Web Vitals: What It Is and How to Track It
You may have heard of the term “website speed”, but what does it really mean? Website load speed (also known as website performance) is the amount of time that passes from the moment the website starts to load on the browser until the website is fully loaded.
It may sound simple, but there is more to it.
Pagespeed metrics (user-centric) explained
A long time ago in a galaxy far, far away... the main Pagespeed metric was “load event”, which tracks the moment when the entire page completes loading, including all dependent resources such as stylesheets and images.
While “load event” is an important metric, it doesn’t offer information about the previous loadings.
For example, here are two websites with this loading metric. One website had optimized rendering, while the other did not have this feature.
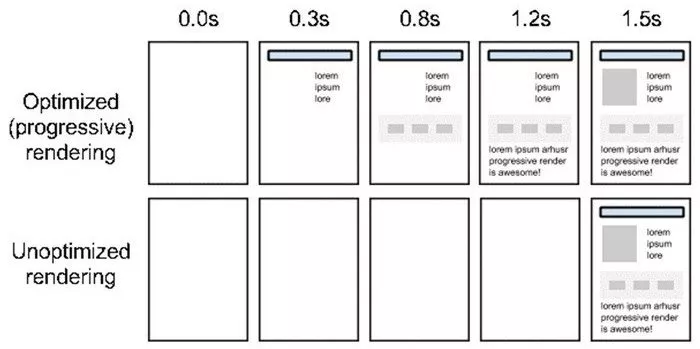
Both websites were fully loaded at the same time (1.5 seconds), but a site visitor will perceive the first website to be faster. This is because they can see or read something on the screen while the site finishes loading. On the second website with unoptimized rendering, the visitor can only wait.
It is the same with regards to “time to interaction”. If a site visitor can interact with a website without having to wait, they will perceive it as a fast website. Conversely, it doesn't help if a website is fully rendered, but the visitor still has to wait 3 seconds before they can scroll through it.
To address these issues, Google has introduced “User-Centric Performance Metrics”. As the name suggests, the new metrics focus not only on page loading speed but also on the user’s perception of page loading.
In short, Google has divided page loading into different stages:
- How quickly the user sees at least something, so the user realizes that page loading has started.
- How quickly the user sees the main content of the page, so they can start interacting with it.
- How much time the user has to wait until they can interact with the website.
- Whether or not elements of the website shift significantly while loading.
Generally, Google takes all of these stages into account, alongside “load event”, to measure full-page performance.
Main User-Centric Performance Metrics
|
Metric |
Description |
|
Time to First Byte reports the time that it takes for a user's browser to receive the first byte of page content. |
|
|
First Contentful Paint measures the time from when the page starts loading to when any part of the page's content is rendered on the screen. |
|
|
Largest Contentful Paint reports the render time of the largest image or text block visible within the viewport. |
|
|
Cumulative Layout Shift measures the sum total of all individual layout shift scores for every unexpected layout shift that occurs during the entire lifespan of the page. |
|
|
First Input Delay measures the time from when a user first interacts with a page (i.e., when they click a link, tap on a button, or use a custom JavaScript-powered control) to the time when the browser is actually able to begin processing event handlers in response to that interaction. |
|
|
Total Blocking Time is the amount of time during which Long Tasks (all tasks longer than 50 ms) block the main thread and affect the usability of a page. It reflects how unresponsive a page is before it becomes fully interactive. TBT measures what’s happening between FCP and TTI. |
|
|
Time To Interactive tells you how long it takes for the page to become fully interactive and is measured in seconds. |
|
|
Speed Index measures how quickly content is visually displayed during page loading. |
|
|
Interaction to Next Paint observes the latency of all interactions a user has made with the page and reports a single value that all (or nearly all) interactions were below. |
Google singled out the most important metrics (LCP, FID, and CLS) in a separate group called “Core Web Vitals”. That said, we still need to pay attention to other metrics as well because they all work synergistically.
You can get a sense of the complexity of these user-centric performance metrics through the lighthouse calculator. Even though CLS is one of the Core Web vitals, it affects the overall score only by 15%.
Monitoring Core Web Vitals metrics
We had a goal of setting up a dashboard to monitor the site loading speed. At first glance, one way to create this dashboard was to use PageSpeed Insights or Lighthouse data. However, this is not the best strategy, as PageSpeed Insights doesn't indicate your website’s performance as experienced by your users (and Google).
For example, our website had good desktop optimization, but the mobile version had a poor pagespeed score. It initially seemed like we needed to spend a lot of time fixing it.
But as our website (for example) is a SAAS service and mostly used by desktop users, users experienced good performance and considered our website to be fast. Google also perceived the same, as they track real user data, not PageSpeed Insights data.
Another example:
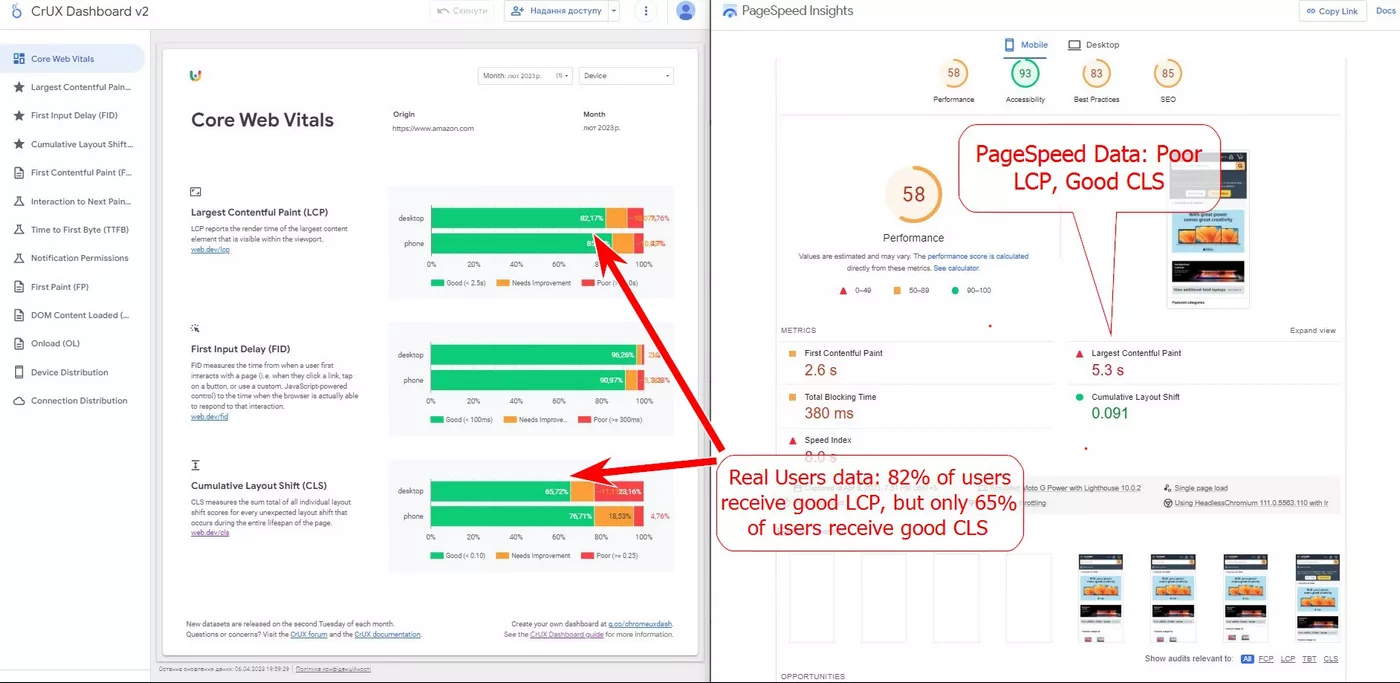
It shows the differences between data from the Chrome UX report and data from PageSpeed Insights, or in other words, between field data and lab data.
Lab Data versus Field Data
Lab data is data generated from a single test of a URL. It includes Pagespeed insights or other Pagespeed monitoring services and services that emulate page loading on some device.
Field data refers to the true performance experienced by users. While some of the metrics above can be measured only in the lab (TBT, TTI, and Speed Index), others (LCP, FCP, CLS, etc.) can be measured in the field.
Ways of measuring website performance
Lab data and field data are two methods you can use to assess website performance. Here is how the two are measured.
Lab data
Lab data can be measured using the following performance tracking services.
- WebPageTest – one of the best tools for lab data (in my opinion).
- Pagespeed insights report – a standard tool provided by Google that uses Lighthouse and contains some data from the Chrome UX report.
- Lighthouse – a standard Google Chrome tool.
- GTMetrix – website monitoring tool.
Do note that these performance tracking services have their pros and cons.
Advantages:
- Data can be tracked for separate URLs.
- Page performance on staging websites can be measured to check the difference between website versions (before and after deployments).
- Advice on how to improve performance can be obtained.
Disadvantages:
- Page groups or data from the entire website cannot be tracked.
- The advice given by different services often contradicts each other or does not affect metrics.
- Estimated numbers can lead to wrong impressions (as shown in the example with optimized and unoptimized rendering).
Field data
Field data includes Chrome UX reports and GA events.
Chrome UX reports
Chrome UX reports are based on a free template provided by the Chrome Team and contain data about websites from a Chrome source.
This CrUX report is an example of a Chrome UX report.
Advantages:
- Access real user data on metrics that can be measured in the field.
- Both historical and current data can be viewed.
Disadvantages:
- Separate URL data or page groups can’t be tracked (only origin and domain).
- Only monthly data is provided.
- Reports are updated only on the second Tuesday of the month.
GA events
Core Web Vitals events (web-vitals library) are events that use the browser API and send events to Google Analytics (or web analytics consulting).
Advantages:
- Separate URL data, some page groups, or entire websites can be tracked.
- Data can be obtained for different periods, such as monthly, weekly, or hourly.
- With some modifications, reports can be used to create dashboards by period, device, etc.
- Reports can be used to segment and analyze events based on performance.
Disadvantages:
- Development or GTM implementation is needed.
- A lot of events are sent to GA, so it's not recommended to send data on all metrics.
- Default events show mainly average values, so they aren’t very informative.
To learn about our solution for monitoring Core Web Vitals using GA and GTM, check out our article “Core Web Vitals Report in GA4 and Looker Studio”.
Conclusion
In a nutshell, website load speed is an important factor that influences the user experience. It can also impact a website's search engine ranking. To improve user experience, it is crucial to monitor Core Web Vitals and other metrics. It is just as important to consider the difference between lab data and field data – the goal is to accurately assess website performance as experienced by users.

 4
4
 0
0
 2
2
Related Articles
How to Set Up Consent Mode in GA4 on Your Website with Google Tag Manager
Let's explore how to properly integrate consent mode in GA4, configure it for effective data collection, and at the same time comply with GDPR and other legal regulations
Display Advertising Effectiveness Analysis: A Comprehensive Approach to Measuring Its Impact
In this article, I will explain why you shouldn’t underestimate display advertising and how to analyze its impact using Google Analytics 4
Generative Engine Optimization: What Businesses Get From Ranking in SearchGPT
Companies that master SearchGPT SEO and generative engine optimization will capture high-intent traffic from users seeking direct, authoritative answers