When using Google Analytics 4 (GA 4), you may notice that the bounce rate is either missing or hard to locate. Initially, there was no such metric on GA 4 until Google officially added it on July 11, 2022. The bounce rate is an important indicator that allows you to assess the level of
What is bounce rate?
The bounce rate refers to the percentage of sessions during which your site visitors view only one page.
For example: let’s say ten people visit your site and view one page, while another ten people view two or more pages. The bounce rate would be calculated as 50% because half of the sessions contain a single-page view.
A "bounce" occurs when someone visits your site but leaves without going to another page. Accordingly, the bounce rate equals the percentage of bounces over the total number of sessions. It's important to note that, by default, Universal Analytics does not consider the time spent on a page when measuring the bounce rate. In GA 4, however, this factor is taken into account.
Bounce rate in Universal Analytics
In Universal Analytics, you can create a custom report with the number of bounces, number of sessions, and bounce rate for the landing page. You can find the bounce rate under "Behavior", followed by "Site Content" and "All Pages Report". It looks like this:
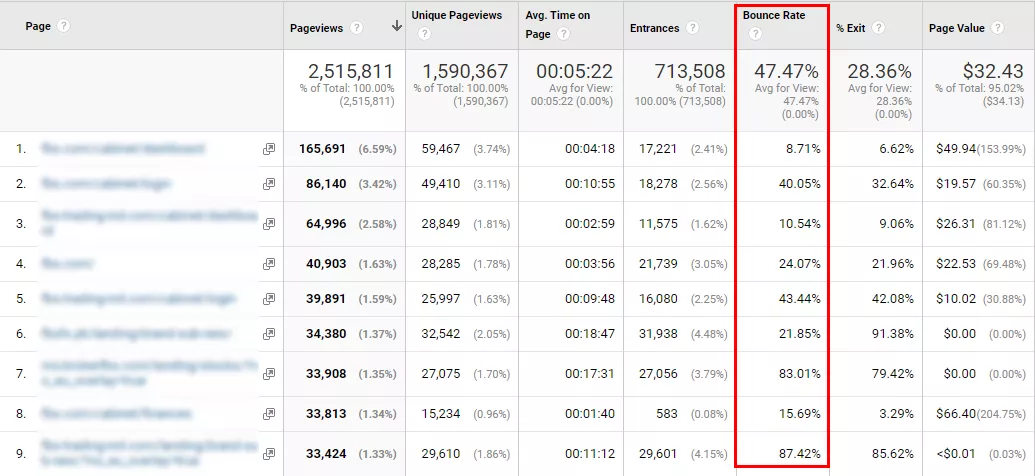
If you're tracking actions on the page, you can indicate whether those actions override opt-outs, and thus obtain a detailed study of user behavior and engagement.
Bounce rate in Google Analytics 4
The bounce rate indicator in Google Analytics 4 identifies sessions that contain only one pageview. Still, the software takes into account factors such as how long people stay on a page and whether conversion occurs during those sessions.
Thus, the bounce rate is the percentage of sessions GA4 didn't find to be engaged.
For a session to be considered engaged, at least one of the following conditions needs to be met:
- The session lasts at least 10 seconds.
- Two or more pages are viewed during the session.
- Conversions take place during the session.
For example, if you have five sessions and four of them are engaged sessions, the bounce rate will be 20%.
How to find the bounce rate in Google Analytics 4?
The bounce rate in GA 4 can be challenging to find. The most convenient way to view it is to customize your standard report.
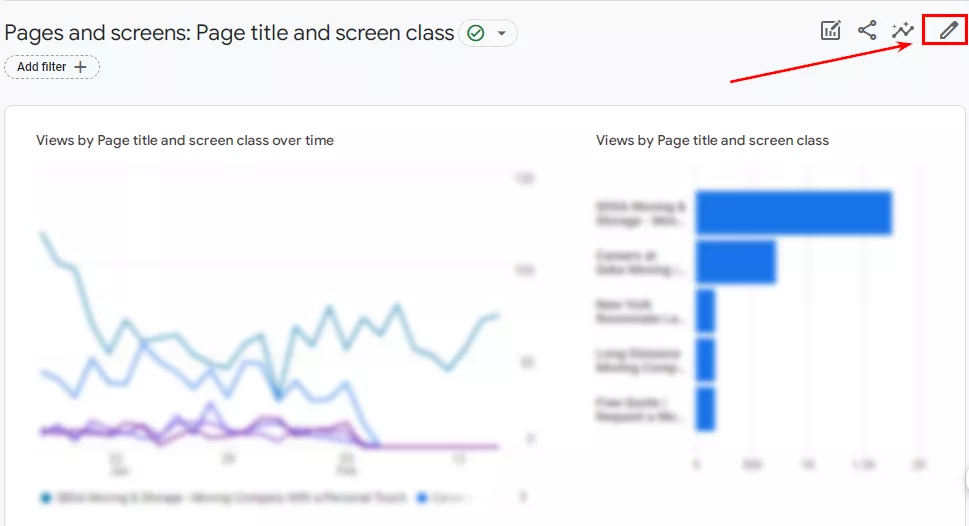
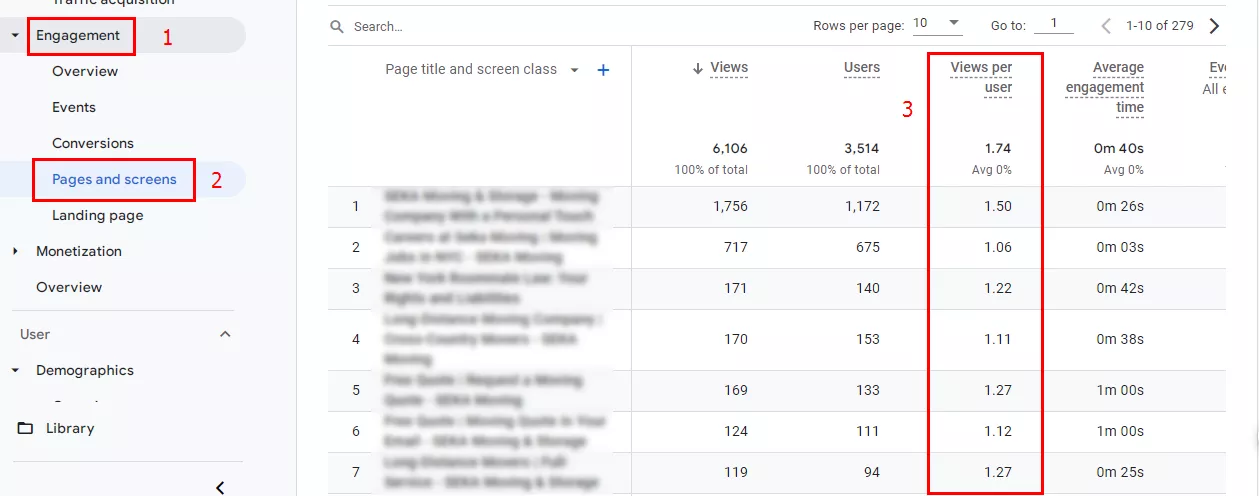
To add this metric to your standard report, go to the "Reports" tab, "Engagement" section, followed by "Pages and Screens":

If you have an "Admin" or "Editor" access level for setting up reports, you will see the "Library" button and a pencil icon. Click on the icon:
Next, select the "Metrics" tab, and click "Add metric":

From the list of indicators, select "Bounce rate":

You can move it up for easier viewing and accept the changes by clicking the appropriate button:

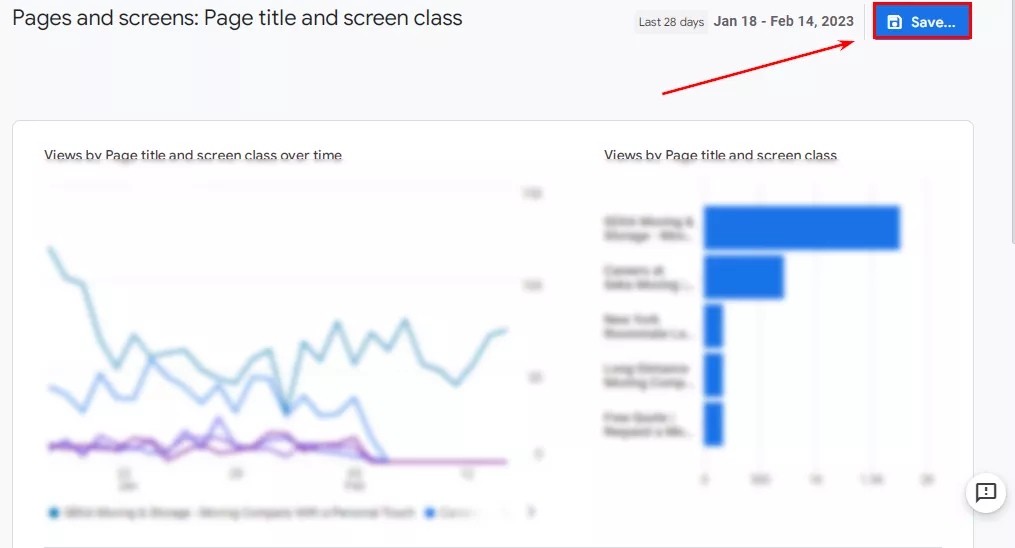
Save the changes:
Alternatives to bounce rate in GA 4
Engagement rate
An excellent alternative to the bounce rate, the engagement rate is calculated by dividing the number of engaged sessions by the total number of sessions.
The main advantage of the engagement rate is that it gives a more accurate view of the behavior of people interested in your site.
As a reminder, at least one of the following conditions must be true for a session to be counted as "engaged" and included in the metrics:
- The session lasts at least 10 seconds.
- The session features two or more pageviews.
- The session includes at least one conversion.
Standard Google Analytics 4 reports contain a portion of interaction data:
- Under "Demographics",
- check for "Google Organic Search Traffic" (available when Google Search Console has a link to Google Analytics).
You can also manually add engagement rate to other standard reports.
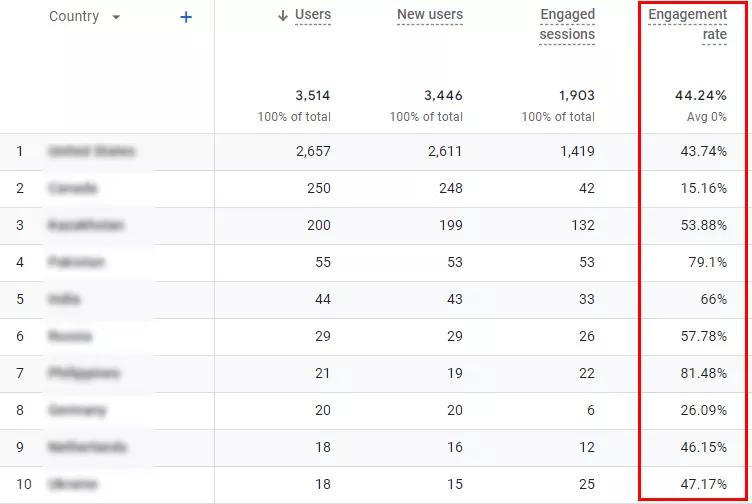
In the "Demographics" reports, engagement rate is located here:
Views per user
The "Views per user" metric is used similarly to the bounce rate – it represents the popularity of a specific page among users, that is, how often they view it.
How is it measured? If one person views a specific product page on the website, then goes to the contact page and comes back to the product page after that, the analytics system will show two views of the product page. However, if another user views a product page on the website and then leaves, GA4 considers it as one view of the product page. Therefore, it will record three product page views for the two users: two views by the first user and one view by the second user. The views per user indicator for the product page will be:
3 views / 2 users = 1.5 views per user.
You can find the "Views per user" value in the "Engagement" report under the "Pages and Screens" tab:
While it is recommended to consider views per user when analyzing user behavior, it is less versatile than the bounce rate and the interaction rate (engagement rate).
How to use bounce rate and engagement rate
As a first step, analyze the degree of engagement on the most important pages. Select pages with high and low interaction rates. Then compare their contents and structure, and also compare them to their search engine competitors. This way, you can identify the reasons for the low engagement rate. Use the same strategy to analyze the bounce rate.
Here are a few common reasons why users leave a page:
- Audio or video that automatically plays on the page.
- Too many aggressive pop-up ads.
- Lack of information on the page.
- Contact information that is difficult to find.
- Large pop-up chat windows.
- Huge sliders on the home page, etc.
The bounce rate in Google Analytics has its specifics. It generally reflects negative trends, measuring the number of users who have viewed and left the page.
In GA 4, the interaction rate (engagement rate) is essentially the opposite of the bounce rate For some projects, it is more helpful to study positive trends than negative trends. The choice also depends on the type of analysis you are going to do. The reasons for abandonment or customer engagement are vital information that you should figure out.
Read also about other important and fundamental
Summary
Google Analytics 4 is able to measure a new metric: engagement rate. Hence, web administrators and SEO specialists are trying to promote its use. But for many, it is more convenient to use the standard bounce rate GA 4 that inherits from Universal Analytics. However, it is essential to understand that these two analytics systems calculate the bounce rate differently.
There are no specific rules for using bounce rate data. On the contrary, it is better to take into account both the engagement rate and bounce rate in Google Analytics 4, as well as the number of views per user and other related indicators (e.g., demographics). This technique will provide a wider overview of user behavior, allowing it to be analyzed more effectively.
FAQ
Is there a bounce rate in GA 4?
The bounce rate metric was added to Google Analytics 4 on July 11, 2022. There are different ways to find it. For example, you can set up a standard report that includes bounce rate.
How does GA 4 calculate the bounce rate?
In Google Analytics 4, the bounce rate is the ratio of sessions that were found to be not engaged compared to the total number of sessions.
How high should the engagement rate be in Google Analytics 4?
Engagement rates that are above 60% for B2B sites and 70% for B2C sites are considered to be good.
What does a 100% bounce rate for a page in GA 4 mean?
If Google Analytics 4 reports a 100% bounce rate, it means that every user who visited the landing page left without further browsing or interacting in any other way with the conversion elements.

 6
6
 2
2
 2
2
Recommended theme posts
Related Articles
How to Set Up Consent Mode in GA4 on Your Website with Google Tag Manager
Let's explore how to properly integrate consent mode in GA4, configure it for effective data collection, and at the same time comply with GDPR and other legal regulations
Display Advertising Effectiveness Analysis: A Comprehensive Approach to Measuring Its Impact
In this article, I will explain why you shouldn’t underestimate display advertising and how to analyze its impact using Google Analytics 4
Generative Engine Optimization: What Businesses Get From Ranking in SearchGPT
Companies that master SearchGPT SEO and generative engine optimization will capture high-intent traffic from users seeking direct, authoritative answers