Cohort Exploration in Google Analytics 4: How to Retain Customers More Effectively
Cohort exploration is an important marketing analytics technique. The cohort exploration report in Google Analytics 4 allows you to analyze common characteristics of different groups of users to track and understand their actions better. In this article, I'll explain:
- What is cohort exploration.
- How to open the cohort exploration interface in Google Analytics 4.
- What the customized report looks like.
- What are the limitations of the report.
- How to grant access to reports.
What is cohort exploration
Cohort exploration is a free tool available in Google Analytics that has become more flexible and powerful in the fourth version. Its main purpose is to display user retention and churn rates by advertising source, campaign, etc.
A cohort is a group of users with a common characteristic, such as user acquisition date, age, gender, etc. For example, a cohort would include all users who installed the app within a month.
User behavior is the actions users take on a website or app, such as making a purchase, adding an item to a cart, etc. Cohort exploration allows you to see their behavior over time. For example, how many users in a cohort make repeat purchases in the months following their first contact.
Cohort exploration allows you to identify the factors that led to better user retention or, vice versa, user churn. It is many times less expensive to retain existing customers than to acquire new ones. Customers who return are more loyal, buy more often, spend more, and bring their friends and family.
This research also allows you to identify high-value cohorts and allocate your marketing budget more profitably.
How to open a cohort exploration in Google Analytics 4
An exploration is created based on the data collected in Google Analytics 4. To open the cohort exploration builder, follow these steps:
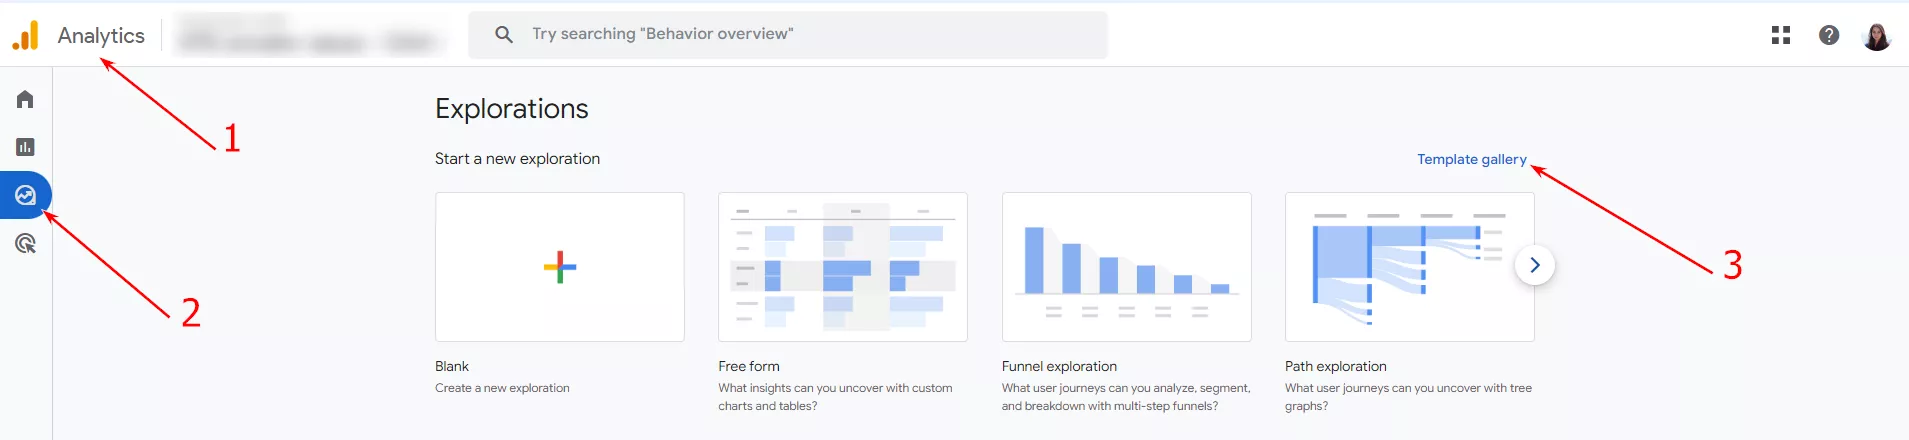
- Open Google Analytics 4.
- In the left menu column, navigate to Explore.
- Click the Template gallery button.
- In the Template gallery, select the Cohort exploration method.
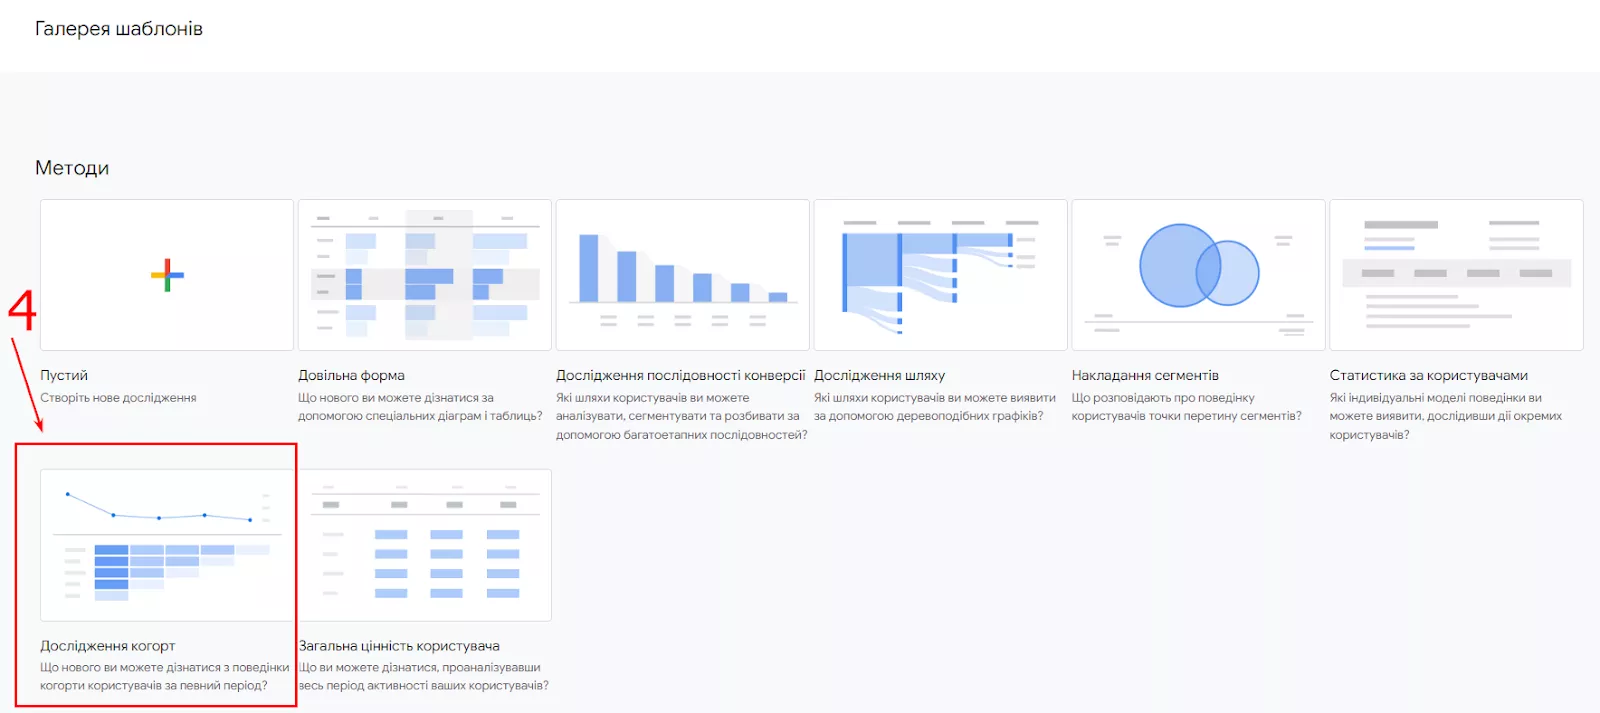
- The Cohort exploration builder opens with default data.
Change the exploration settings to get the data you need.
Cohort exploration configuration
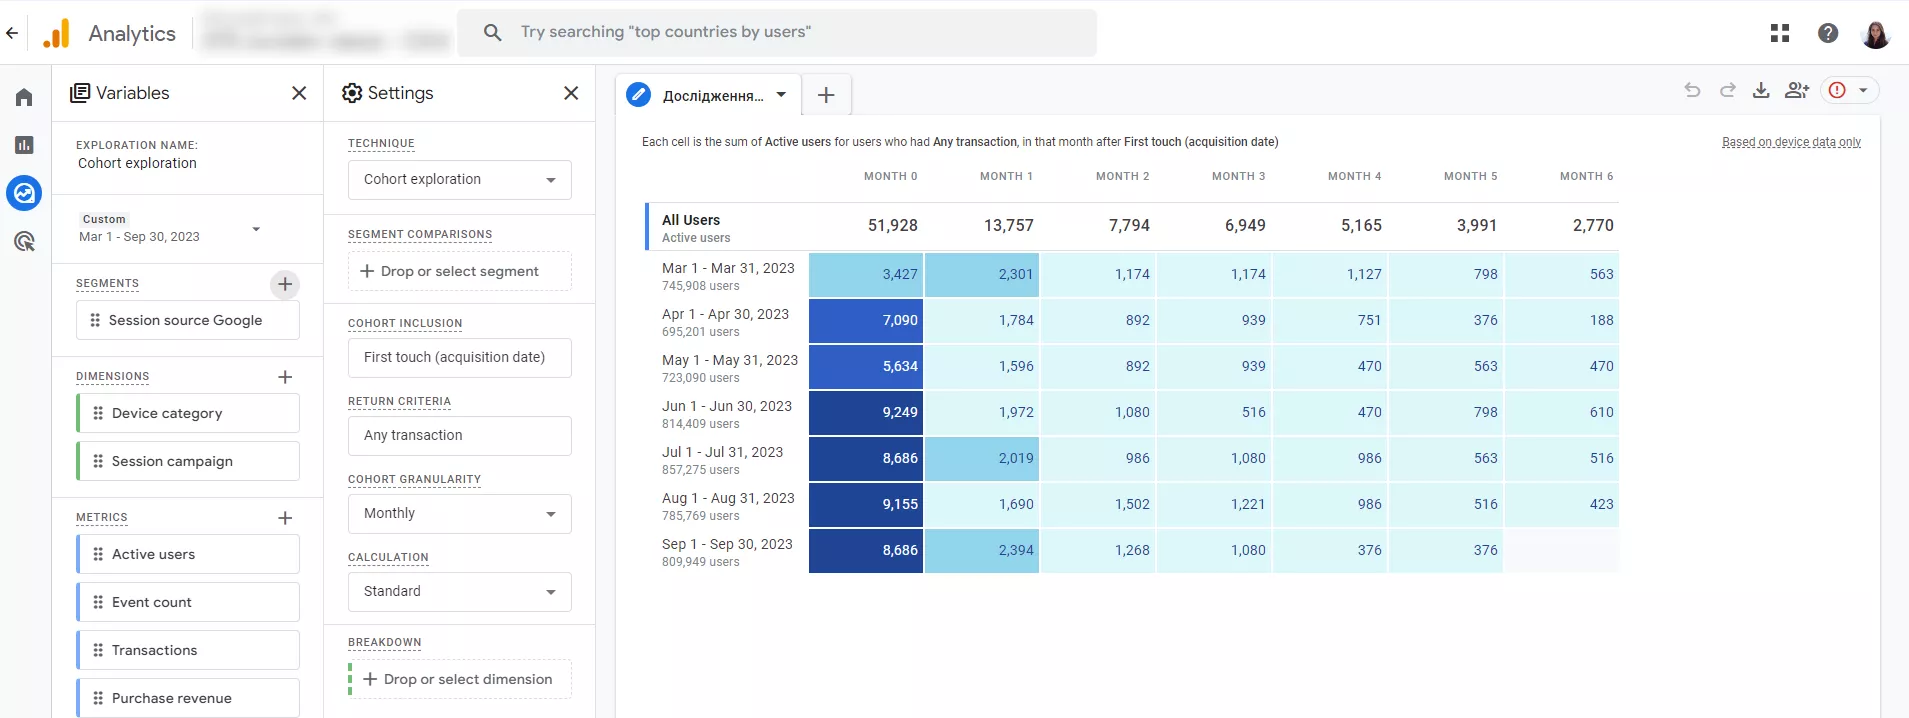
The cohort exploration report is very flexible. You can easily change various parameters to obtain a wide range of data.
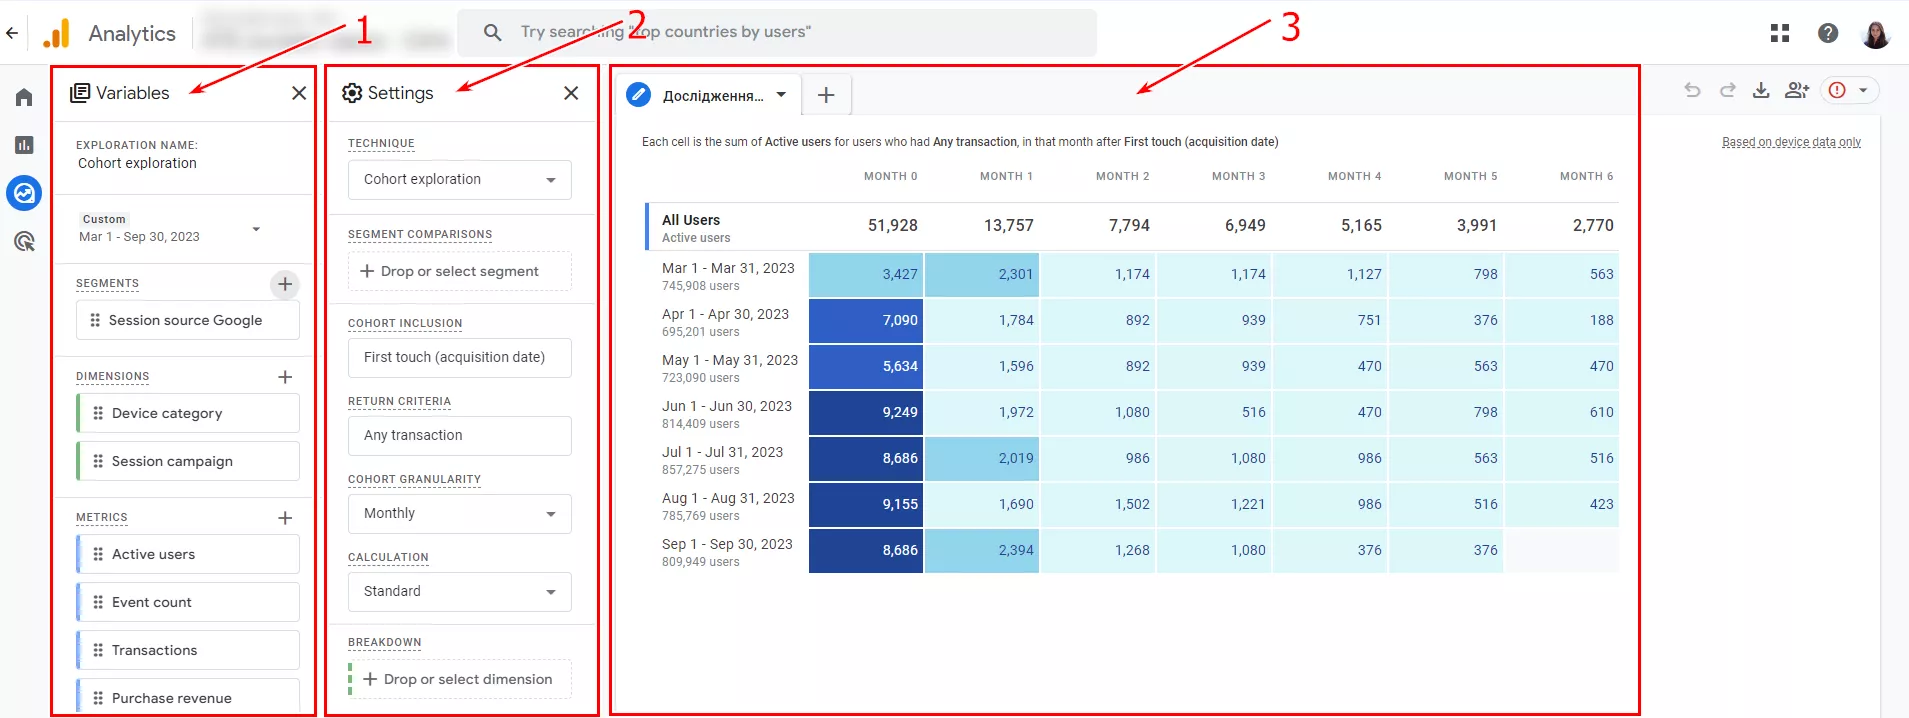
There are three tabs: Variables, Settings, and Cohort exploration. The last tab displays the data based on the settings in the previous two tabs.
Variables
There are many different parameters, segments, and metrics. You can select the ones you want to work with in the future.
All metrics, segments, and parameters added to the Variables tab are initially displayed only on this tab. To include them in the report, drag them to the Settings tab.
Let’s go into more detail about the Variables elements and how to use them.
Exploration name
Exploration names should be clear and easy to understand so you can easily find them by name in the Explore section. GA4 automatically saves names and edits, so there is no button to save them.
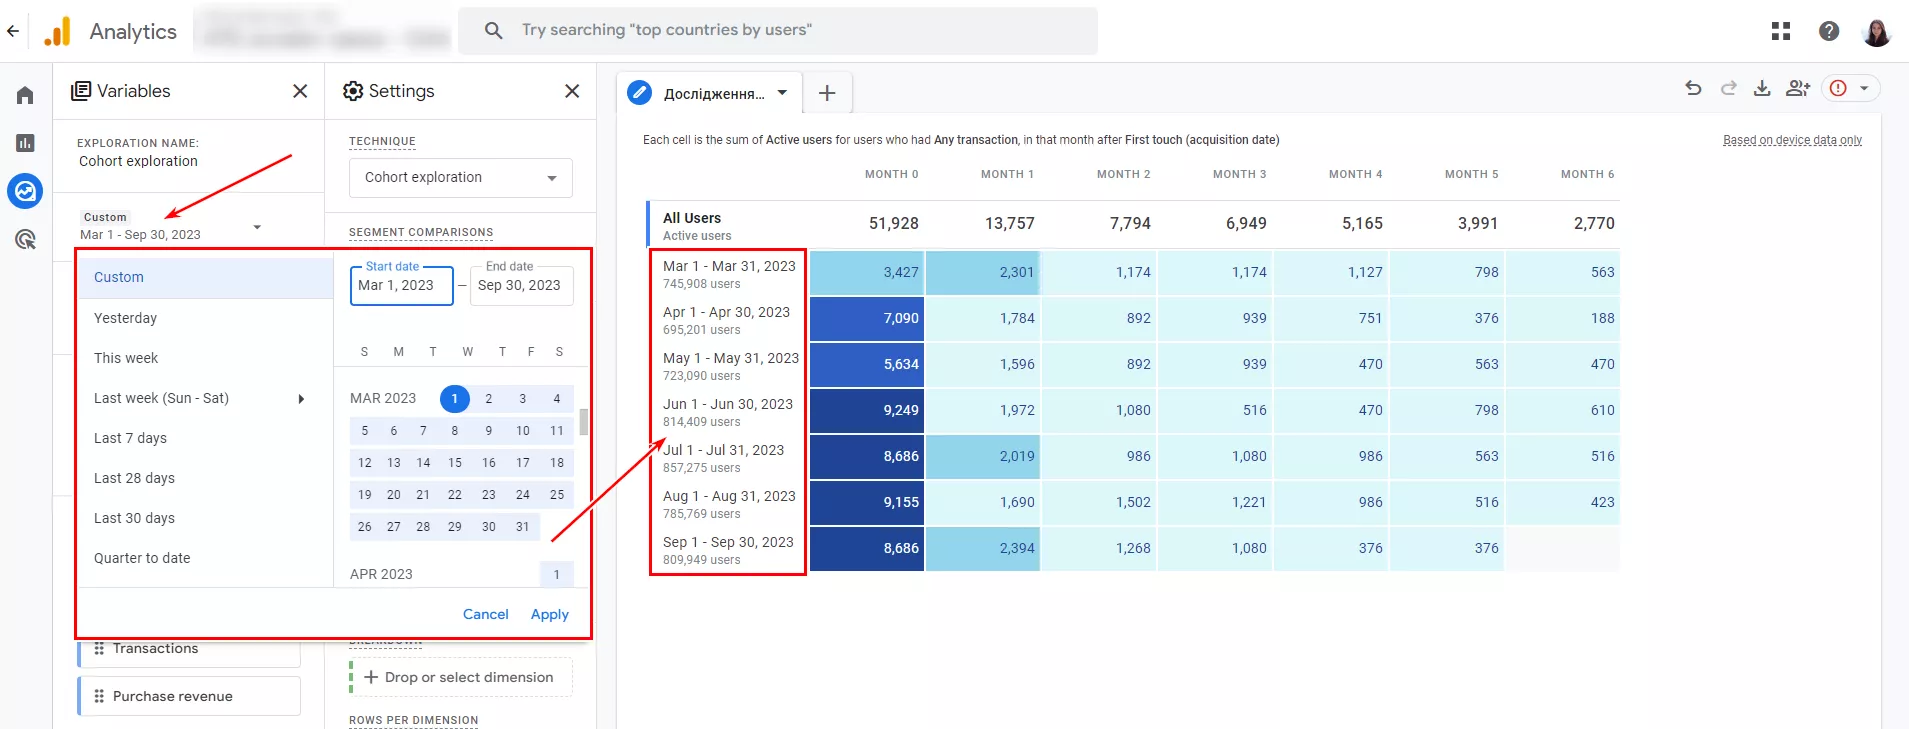
Date range
This element selects the date range for the exploration. For example, if you specify a range from March 1, 2023, to September 30, 2023, you can find out how many users who first visited the site in March still visited it in the following months.
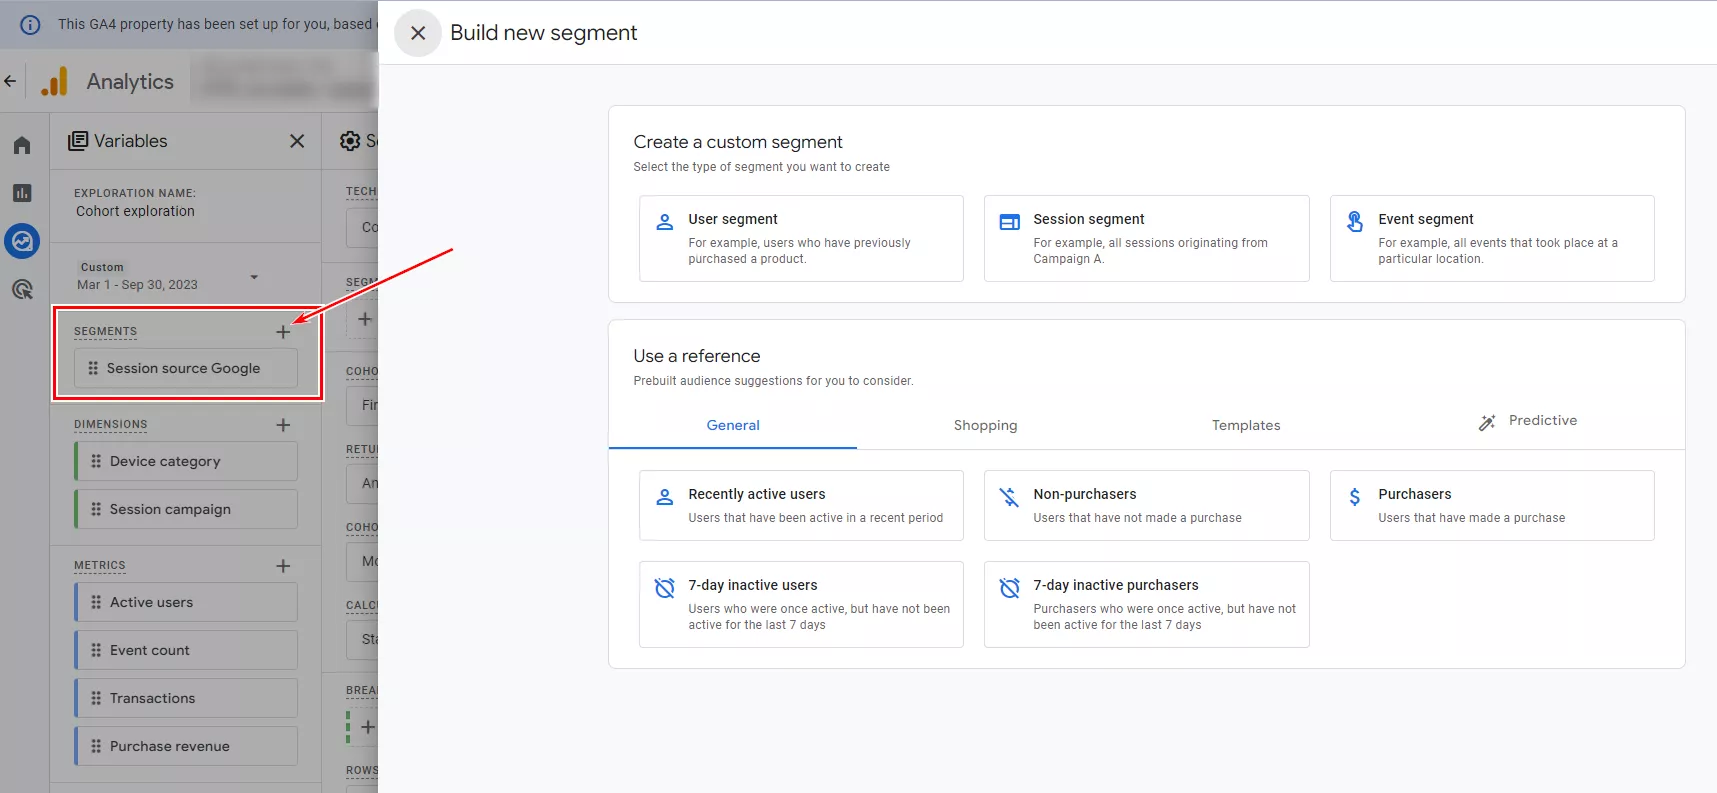
Segments
Segmentation allows you to create custom groups of users. For example, you can group users based on:
- a specific action they took on a website or app;
- demographics such as age and gender
- similar interests
- same traffic source or campaign
- people related to the initial acquisition.
To create a new segment, click the plus sign. It is worth giving it a name for convenience.
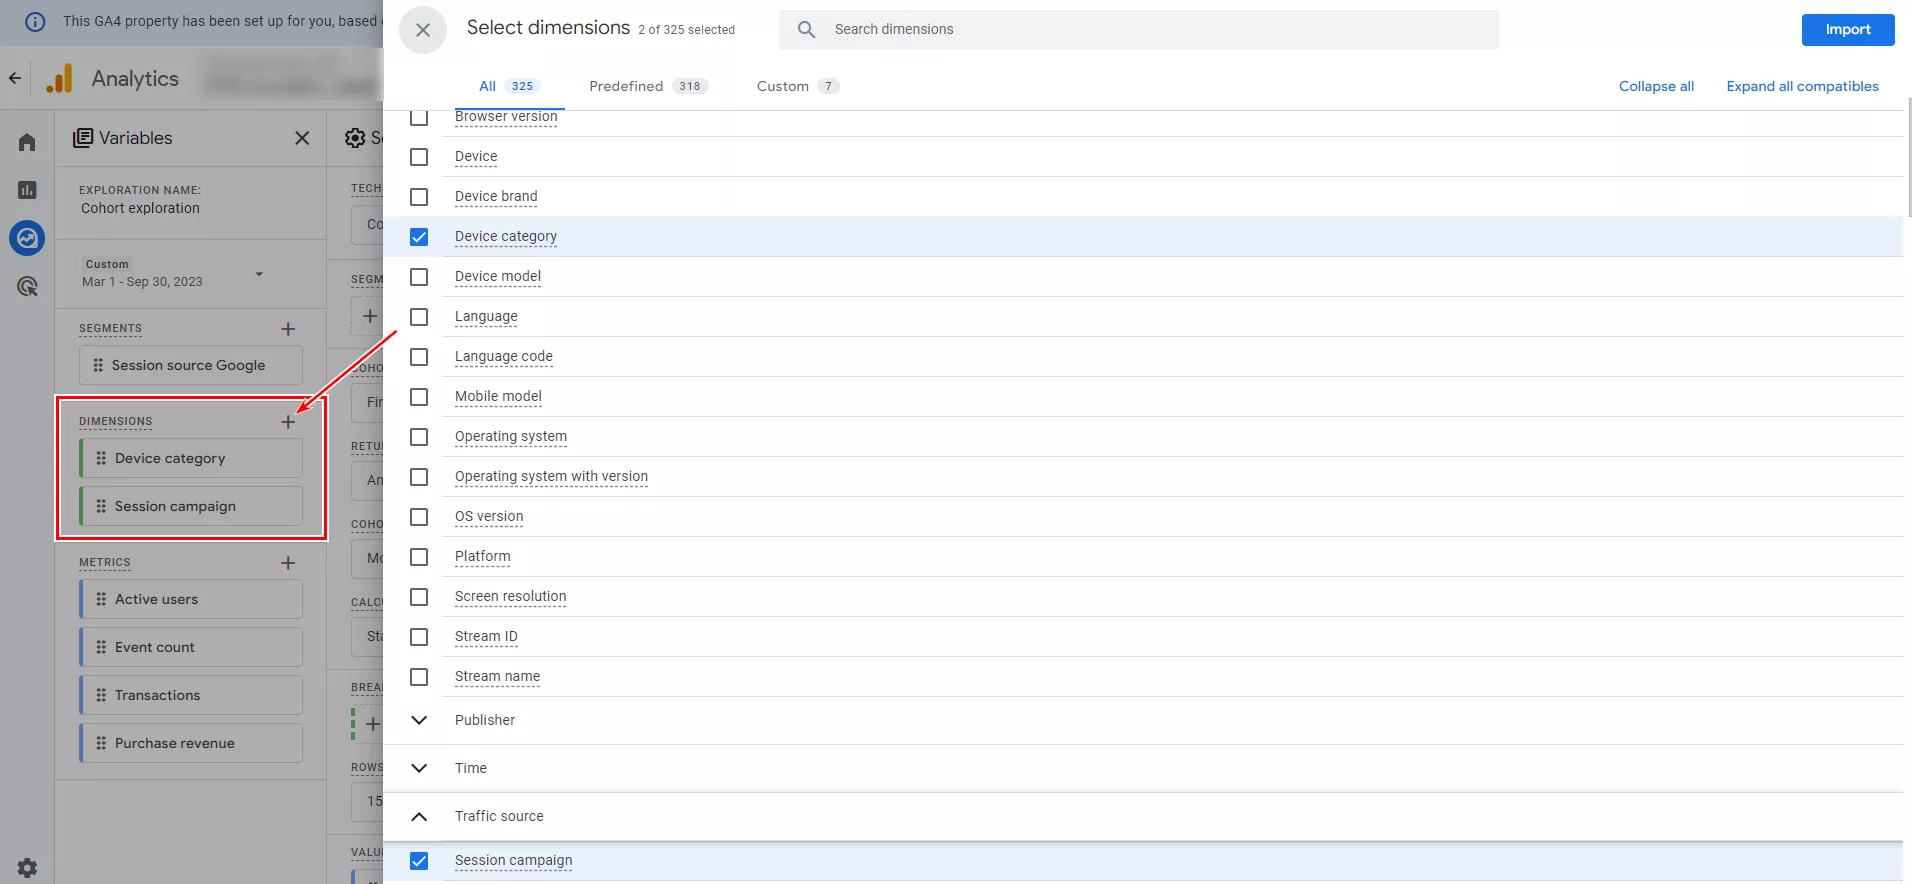
Dimensions
This element allows you to display detailed data by breaking cohorts into subgroups. For example:
- to see how user behavior differs by age, select Demographics – Age;
- to see how user behavior differs by city of residence, select City.
Metrics
In a cohort study, you often want to know the number of users, so you use the Active users and All users metrics. In addition, you can also:
- select Revenue to see the total revenue that cohorts generate over a certain period;
- select Transactions to see the number of transactions performed.
Settings
Let me walk you through the elements of the Settings tab and how to use them.
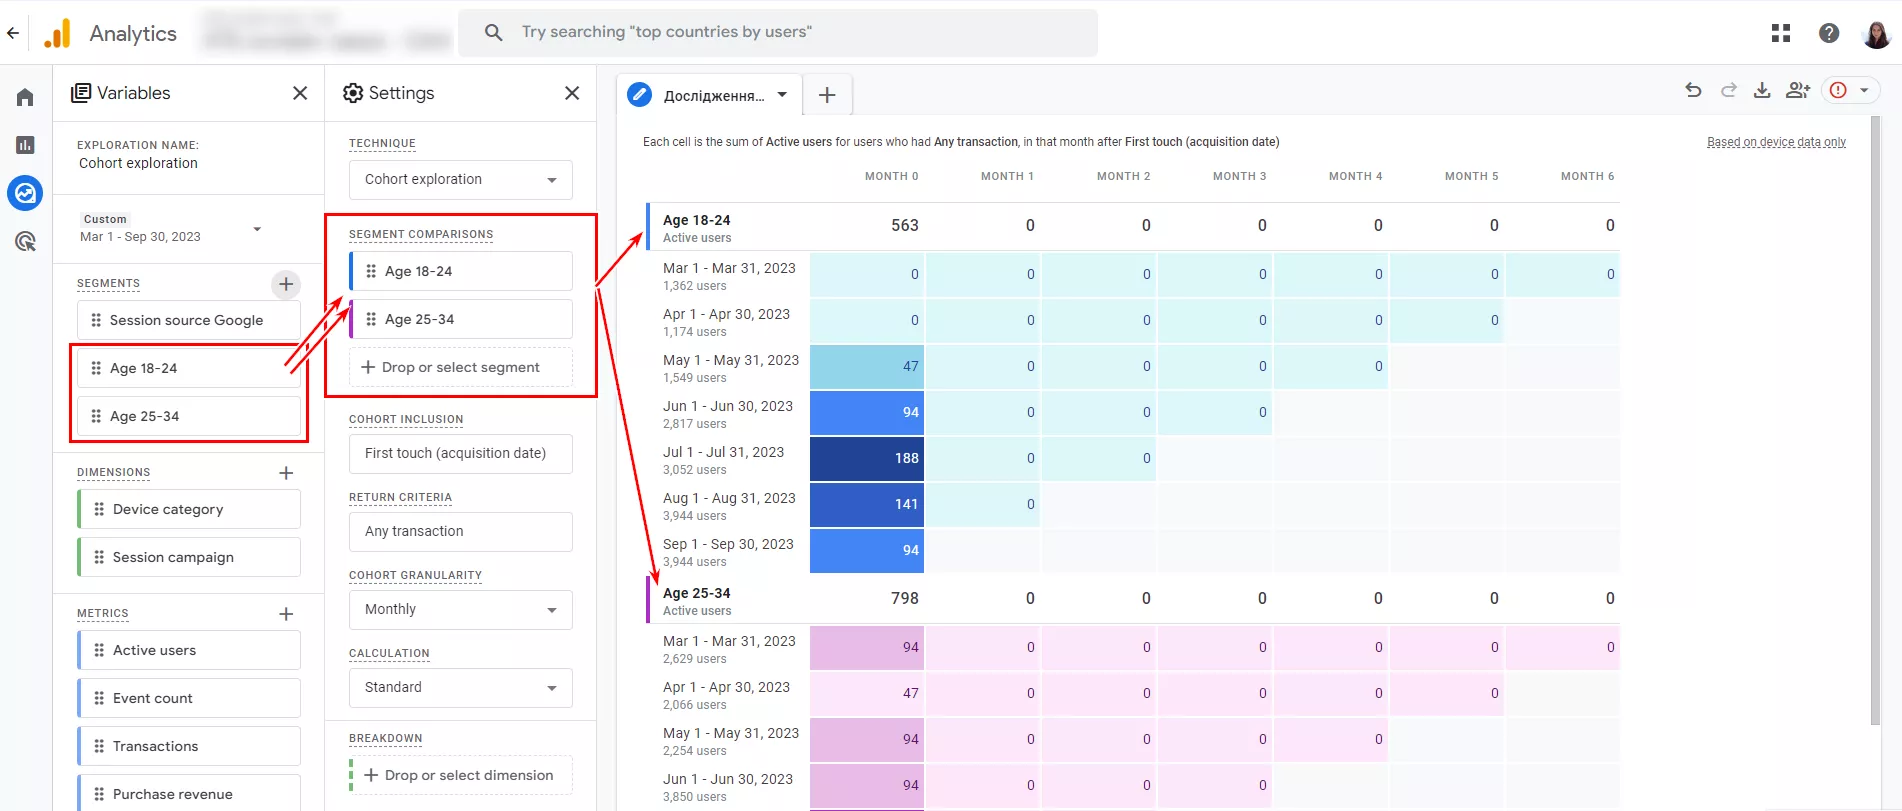
Segment comparisons
To compare previously created segments, drag them from Variables – Segments to Settings – Segment Comparisons.
For example, if you select two segments by age category, you can see how the user retention rate for a given period differs by age.
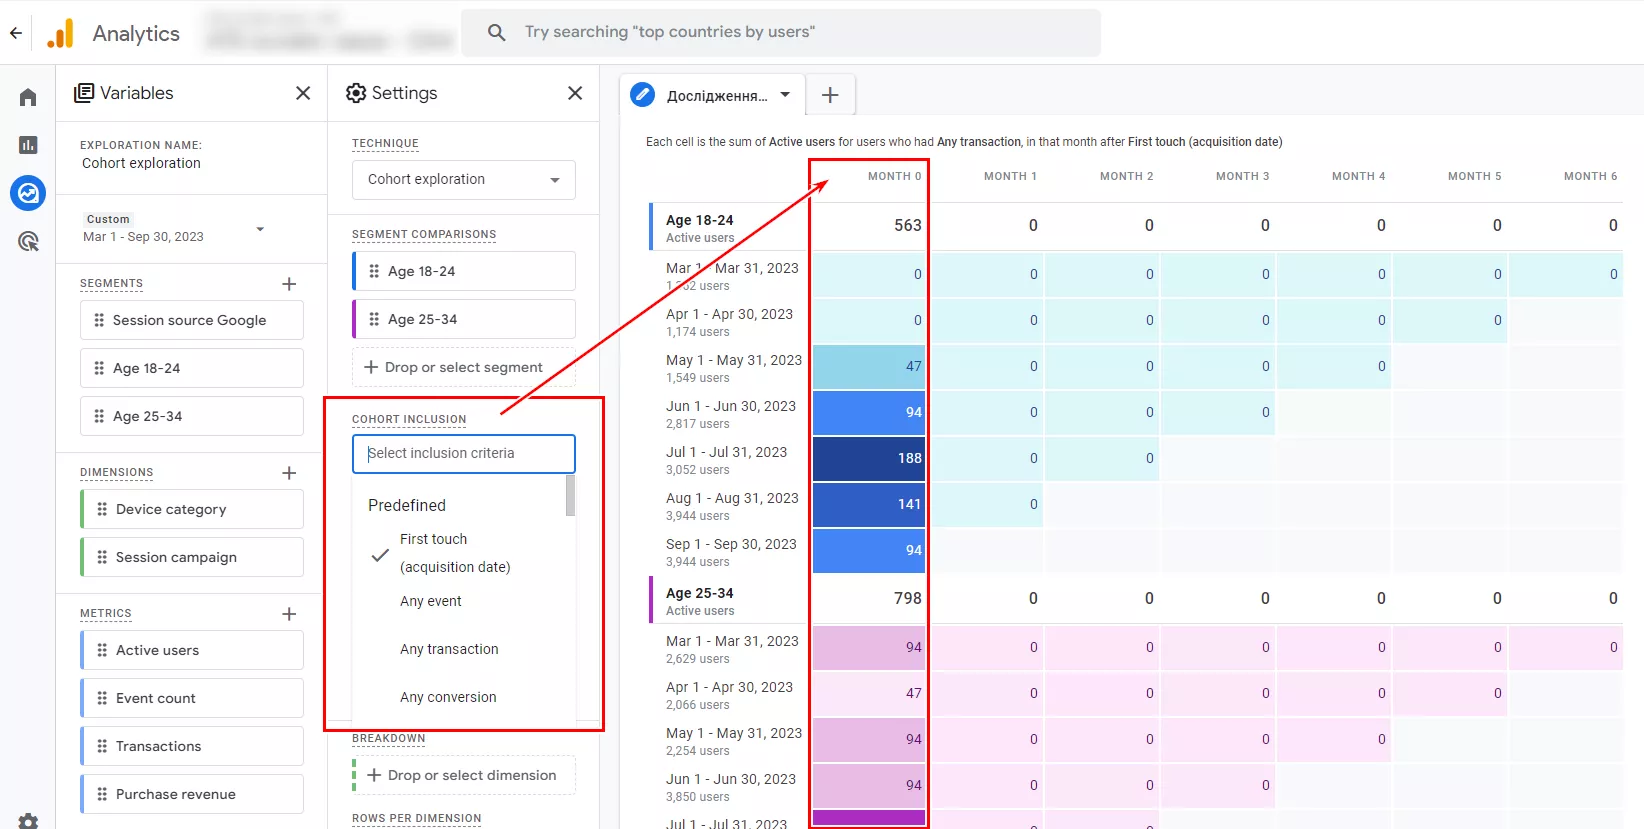
Cohort inclusion
To be included, a website or application user must complete a specific action within a specified period. Included users are shown in the first column of the cohort study, “Month 0”. In subsequent months, the sample will only consist of included users.
You must select one of the criteria to include users in the cohort.
- First touch (acquisition date). Includes users who had their first contact with the site or app.
- Any event. Includes users who performed an action on the site or app for the first time within a specified time.
- Any transaction. Includes users who performed any transaction on the site or app for the first time within the specified period.
- Any conversion. Includes users who first performed any conversion on the site or app within the specified time.
- Other. Includes self-generated actions, such as adding a product to the cart, viewing a page, starting a session, and making a new user transaction.
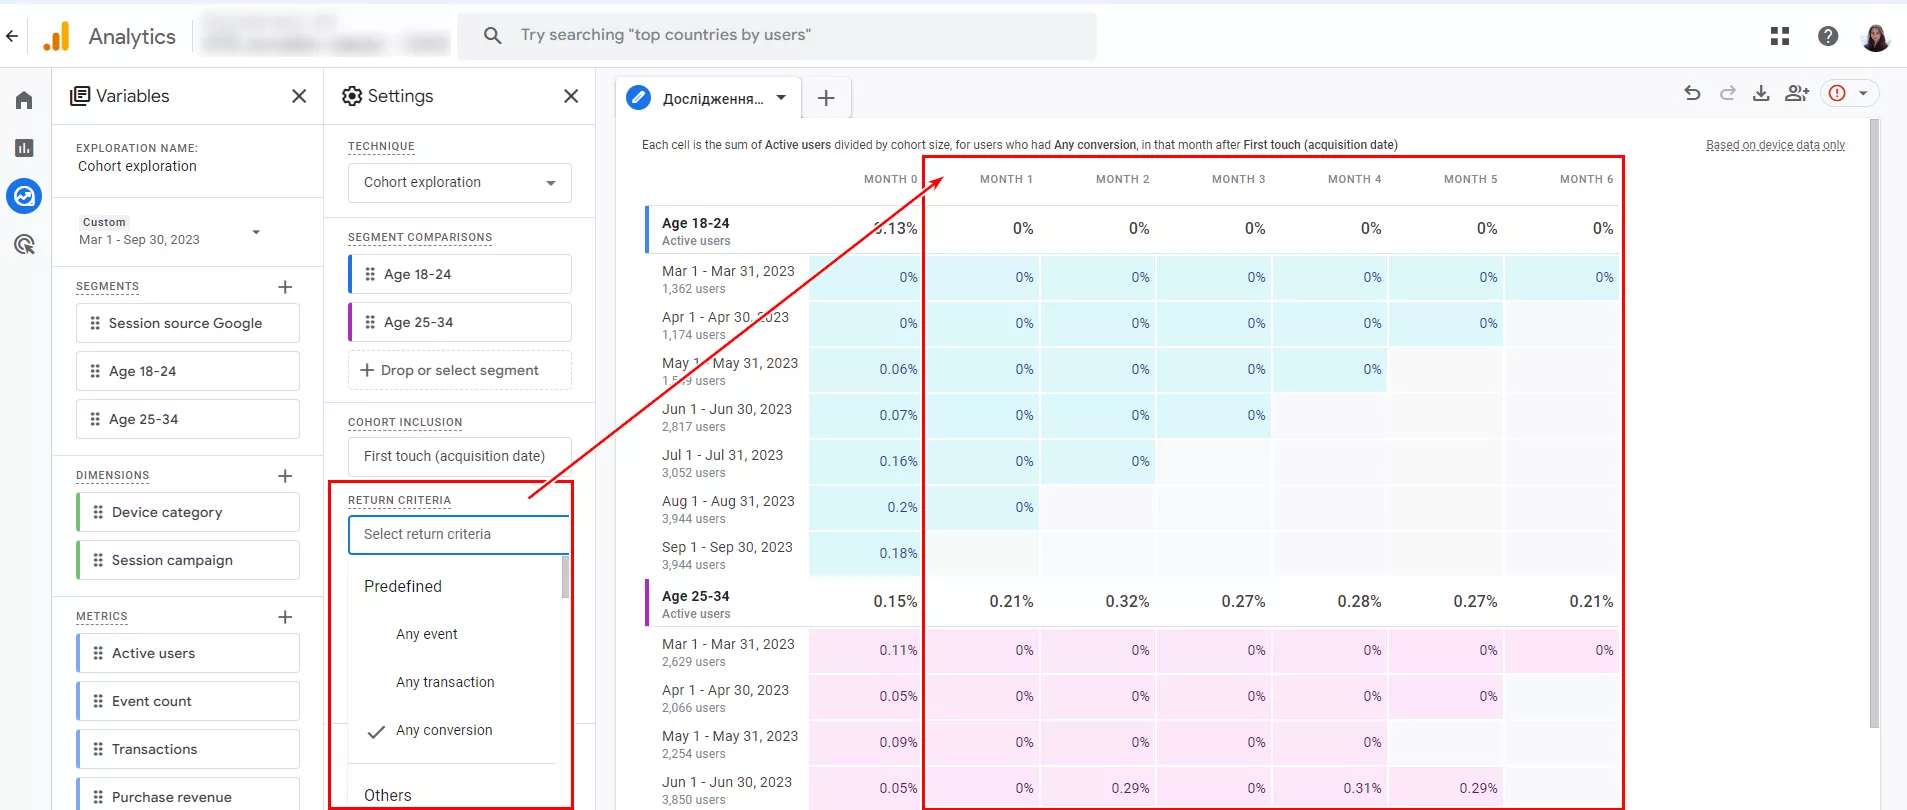
Return criteria
The return criteria are any event, transaction, or conversion the user performed during the specified period. Only users who are already in the included cohort are sampled.
For example, select Any conversion to see how many users in a cohort performed any of the conversion actions in specific months.
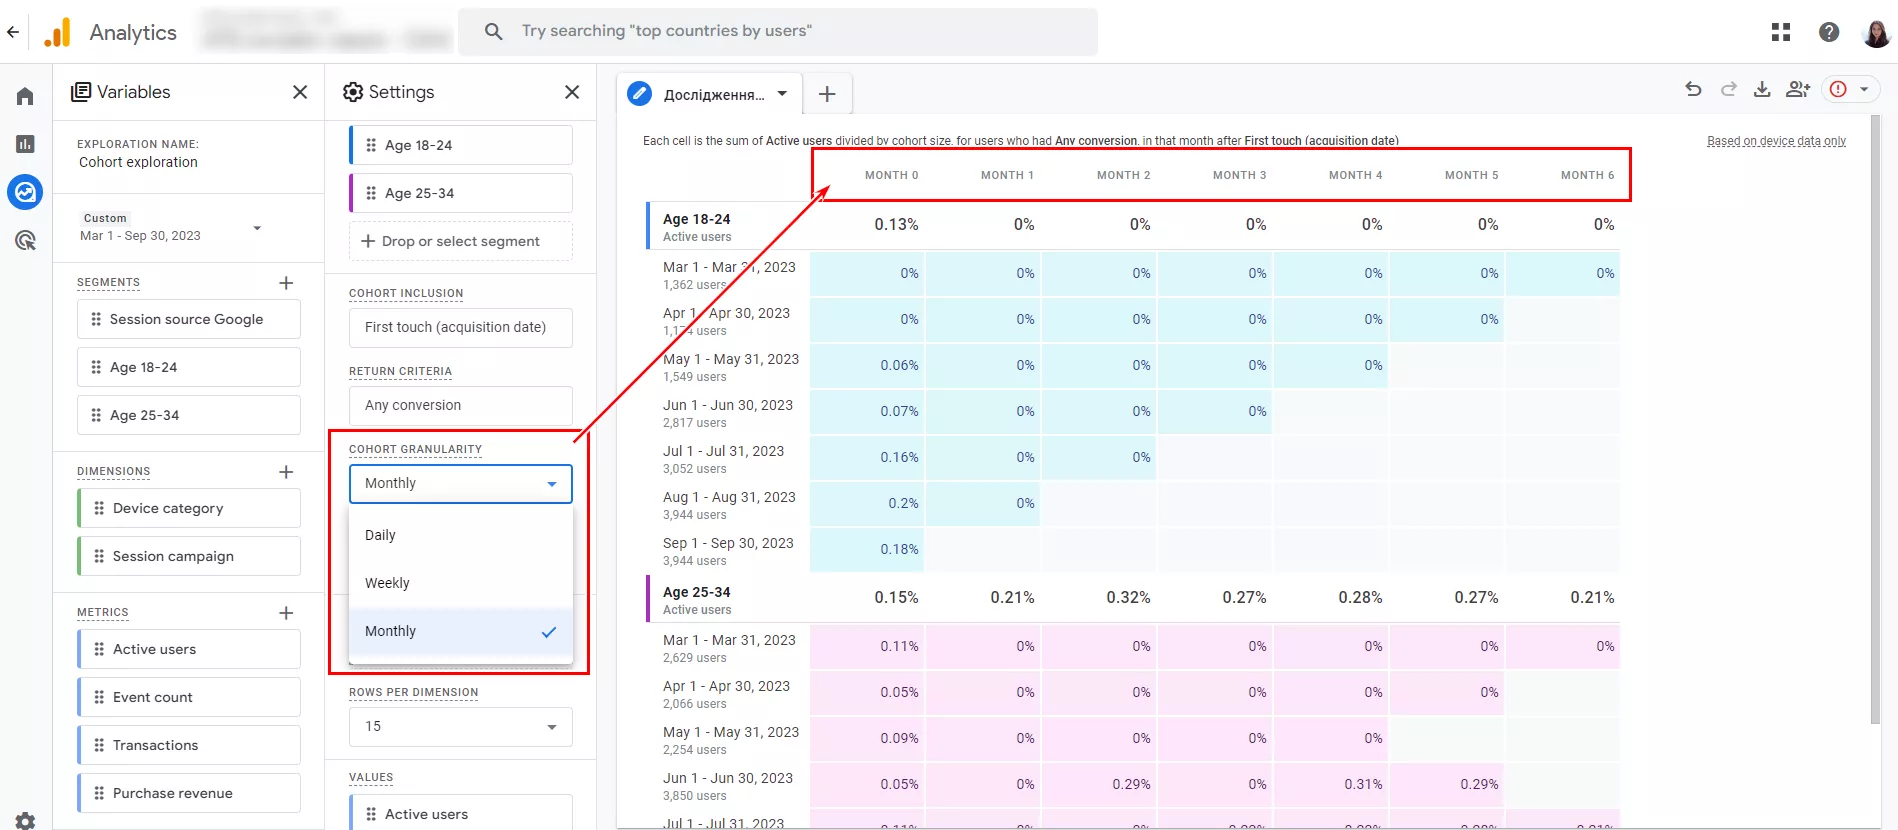
Cohort granularity
This element allows you to define the data collection interval. The available options are daily, weekly, and monthly.
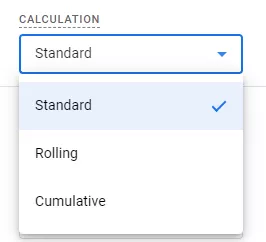
Calculation
This customization element critically affects the data calculation. There are three calculation types.
- Standard. Counts only those users who meet the return criteria for the specified period. Previous actions are irrelevant.
- Rolling. Counts users who meet the return criteria for the specified period and for previous periods.
- Cumulative. Includes users who meet the return criteria in any period of the study.
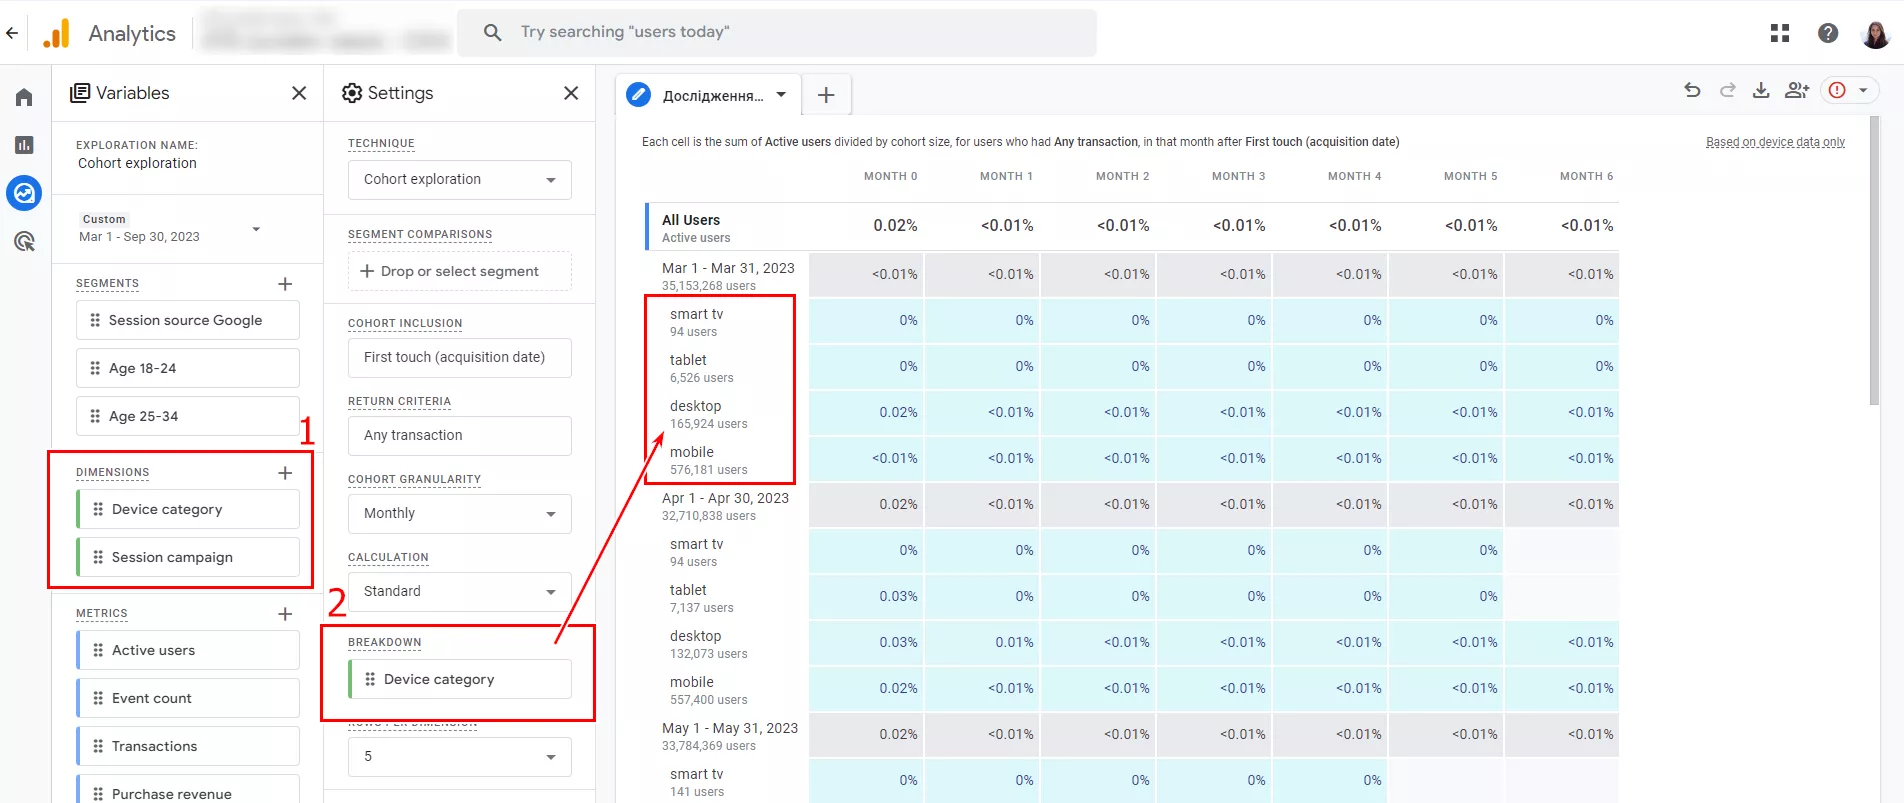
Breakdown
This element is used to compare changes in the cohort by narrower subgroups. You can select any parameters to drill down into the data, such as gender, interests, city, campaign, device category, etc.
Select and add the parameters under Variables – Dimensions. You can drag them from the Variables or click on the drop-down menu to select them from the list.
For example, select the breakdown by Platform to examine the behavior of a cohort over some period based on the device they used.
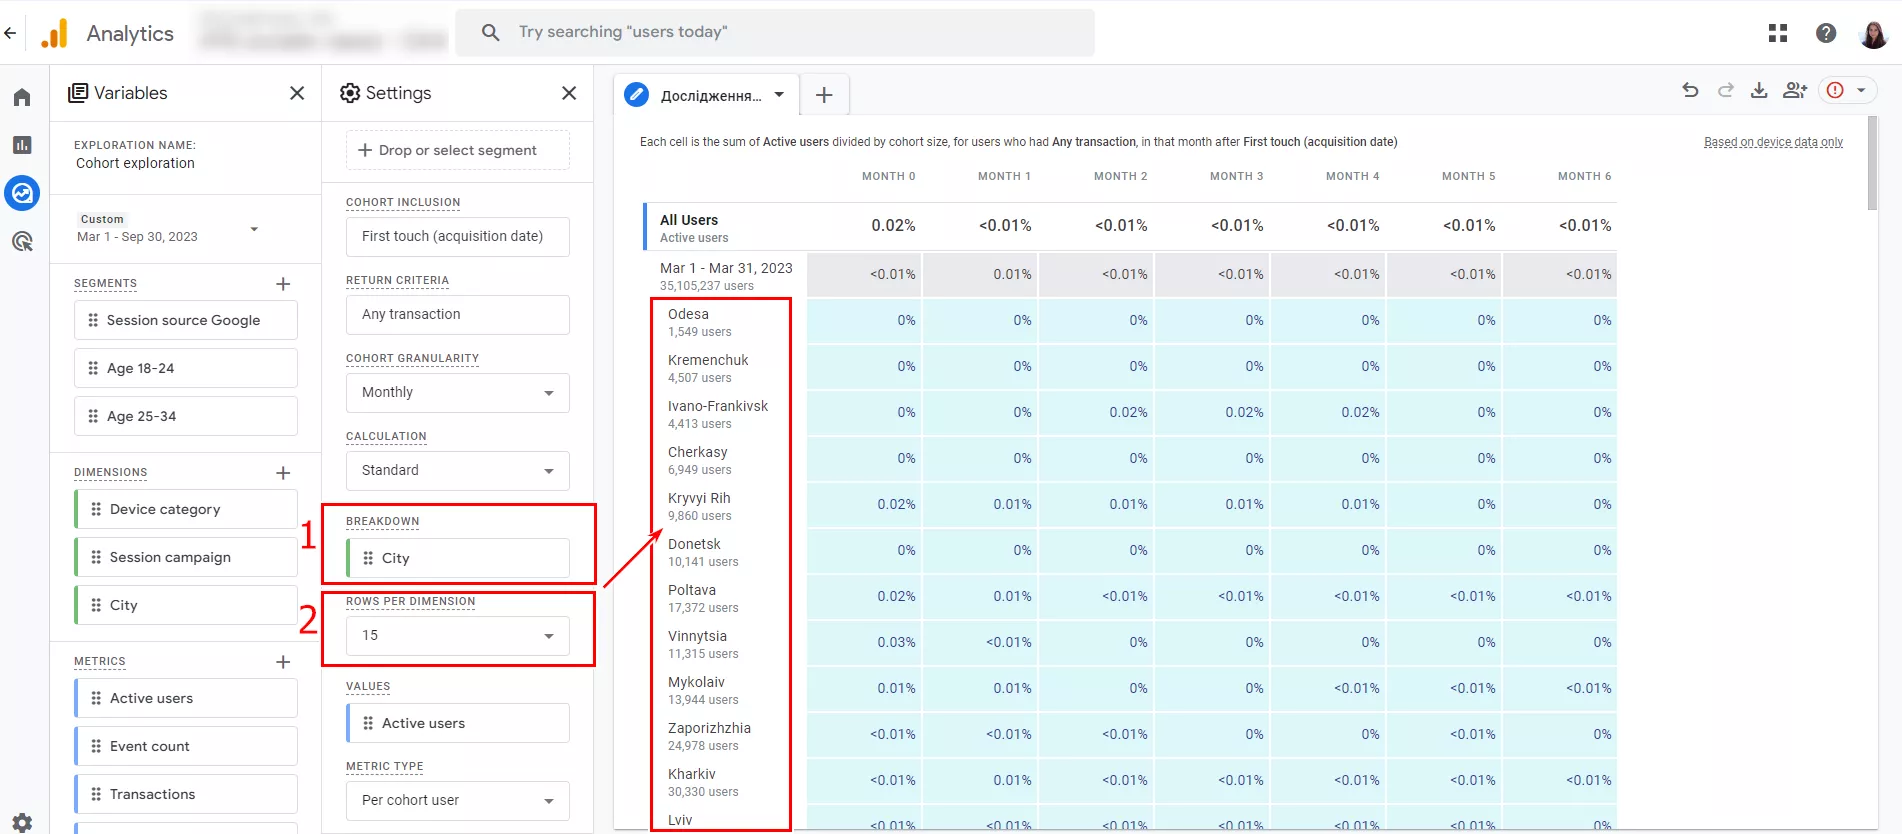
Rows per dimension
This is relevant for parameters with many variants, such as cities in a particular country. You can choose 5, 10, or 15 rows when detailing a cohort.
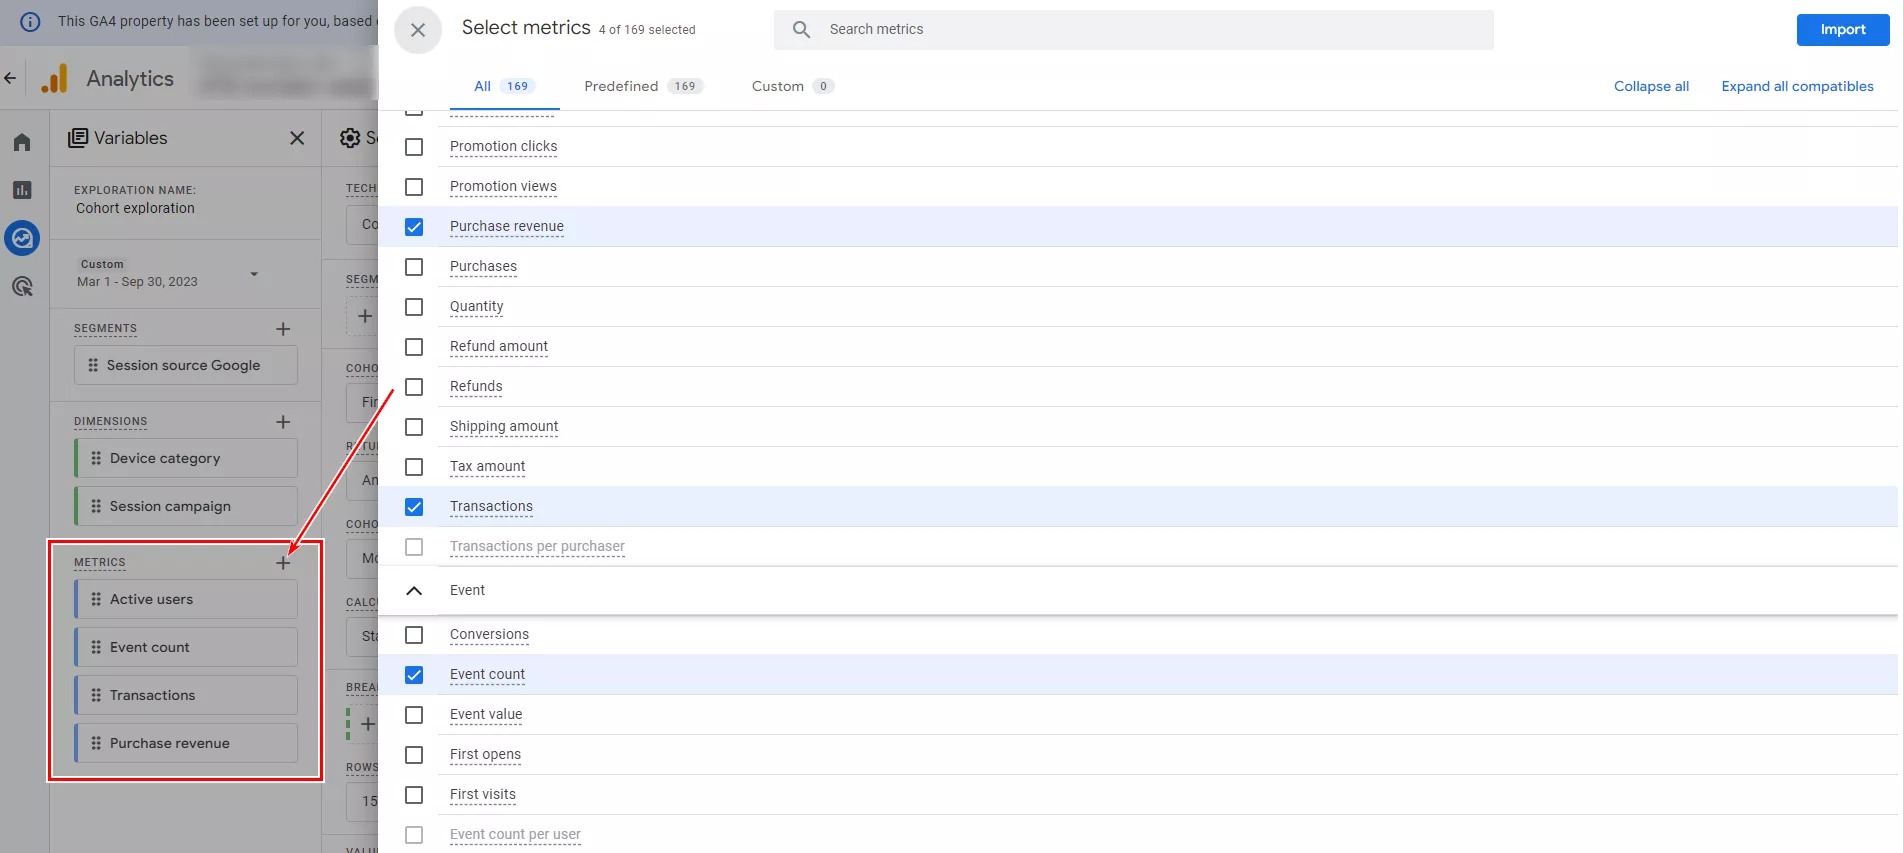
Values
This element allows you to select the value to display in the cohort cells. There are four options:
- Active users
- Event count
- Transactions
- Purchase revenue
Select Active users to display the number of active users in the specified period. Select Purchase revenue to display the revenue from purchases made by the cohort during the specified period.
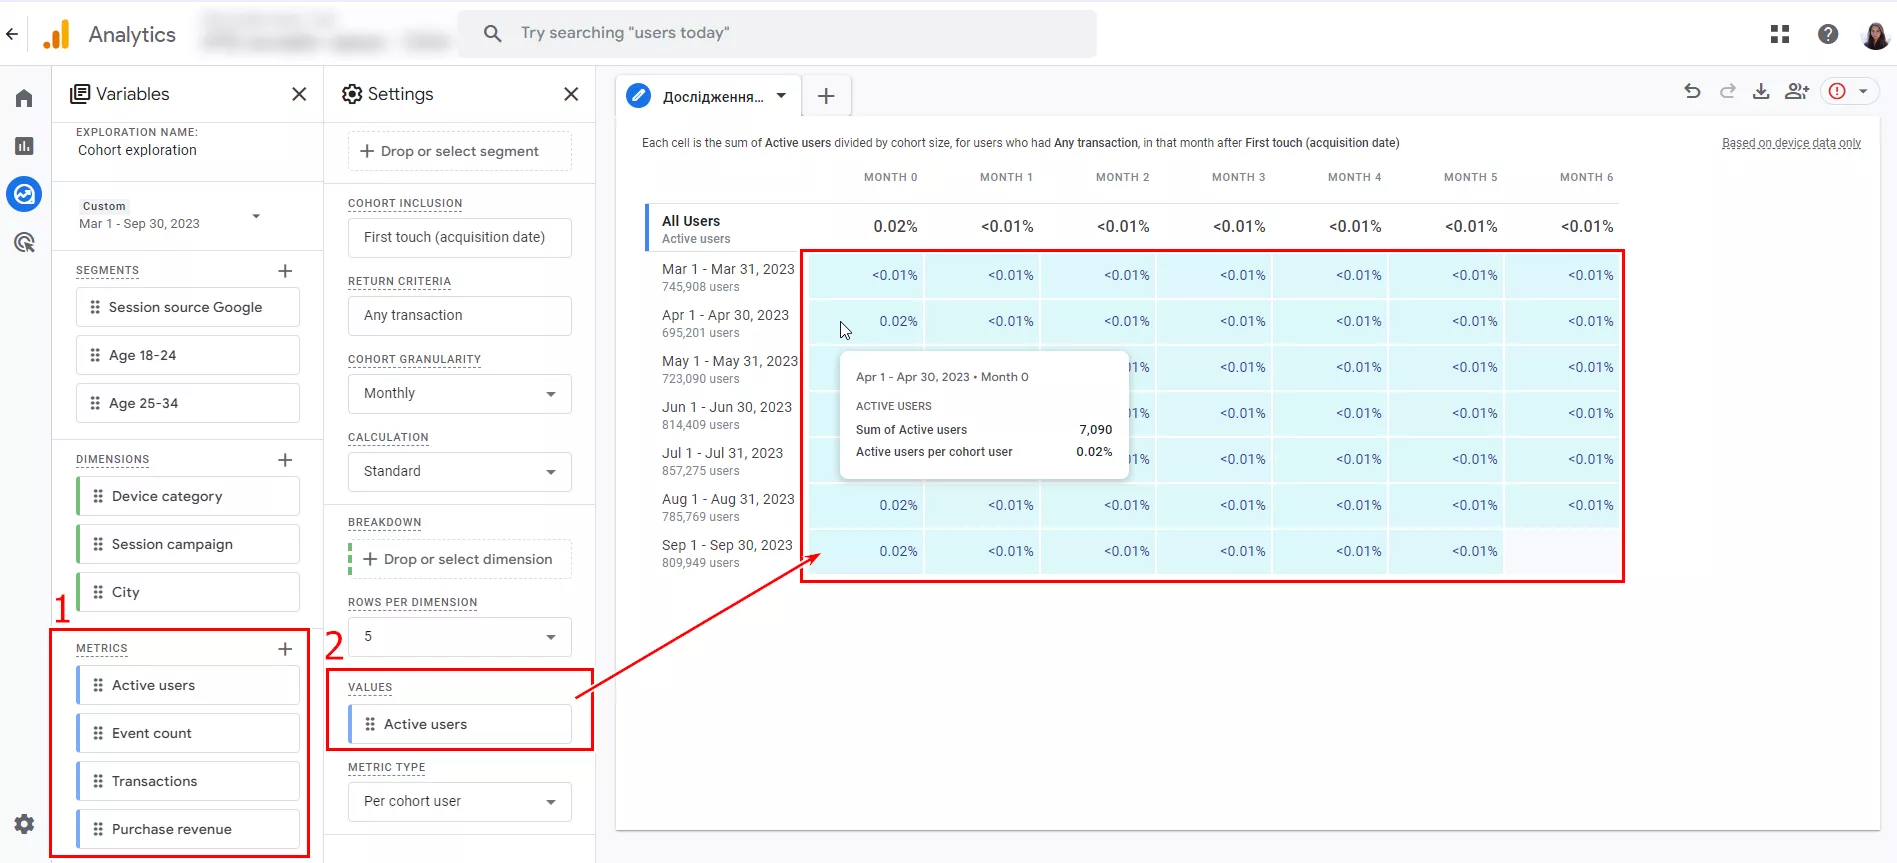
If you need additional metrics for the exploration, they are imported under Variables – Metrics.
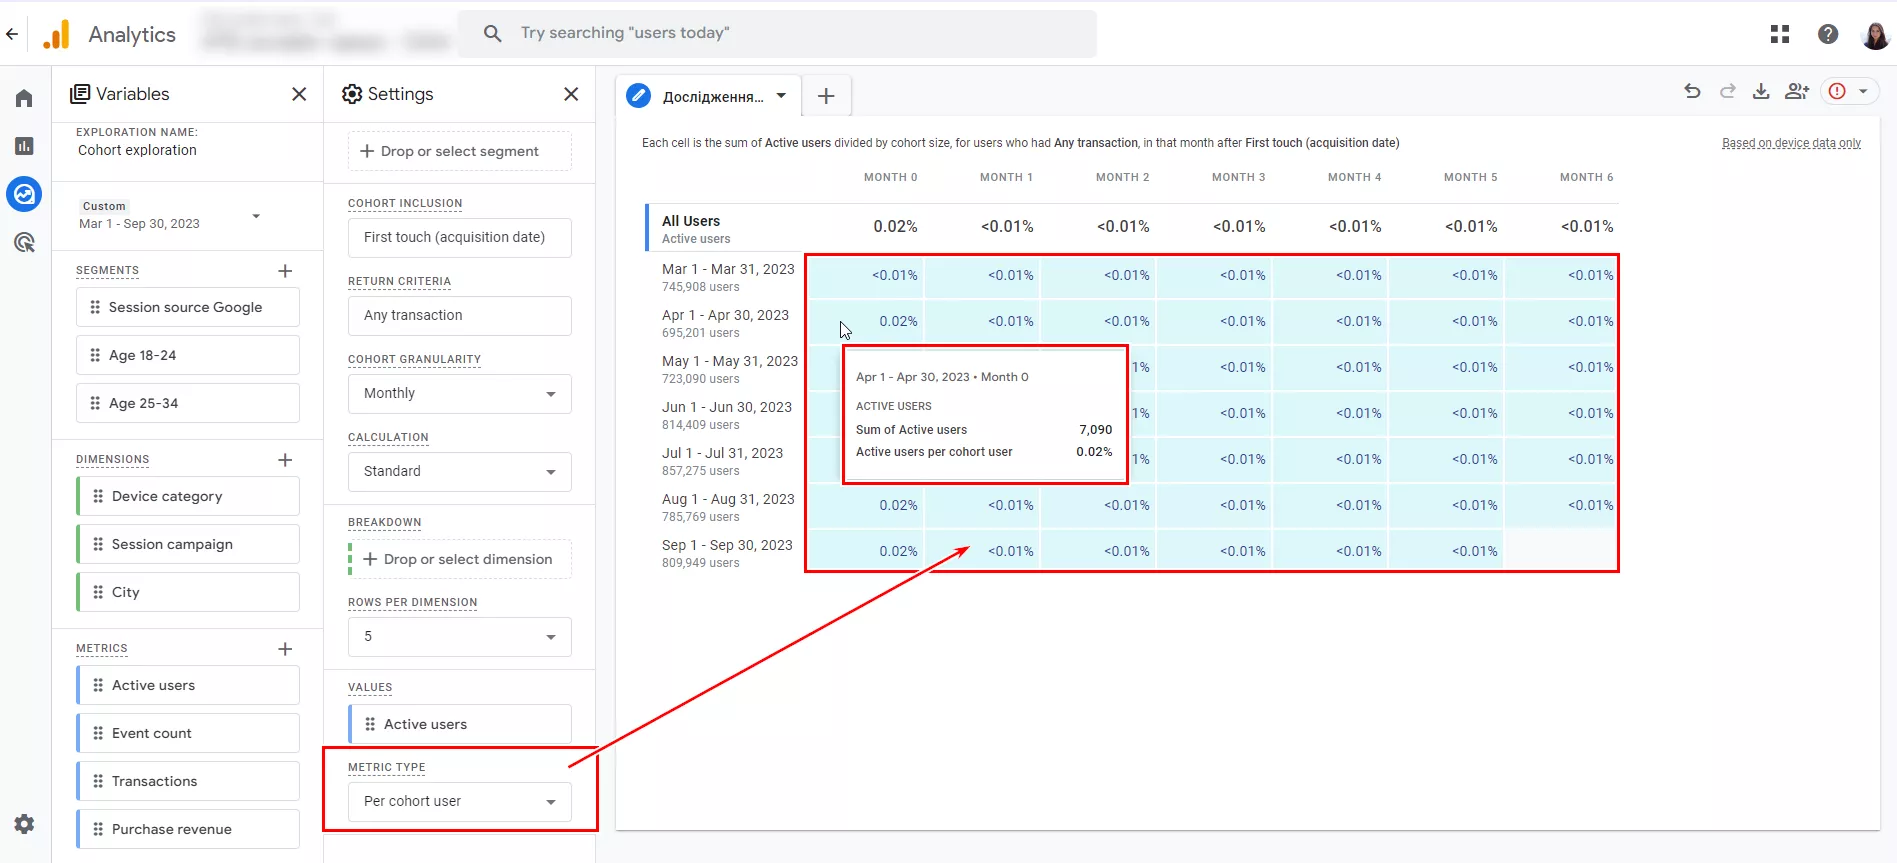
Metric type
There are two types of metrics in a cohort exploration.
- Sum. For example, the actual number of active users in a given period.
- Per cohort user. It displays the percentage value of the metric per the number of users in the cohort.
To see these data types, hover over a cell in the exploration.
Example of creating a Cohort exploration report
Let’s see the cohort of users who first interacted with the site between June and September:
- how many transactions they made in the first month;
- their retention over the next three months.
Let’s also compare the cohorts of users who came to the site from Google and Facebook.
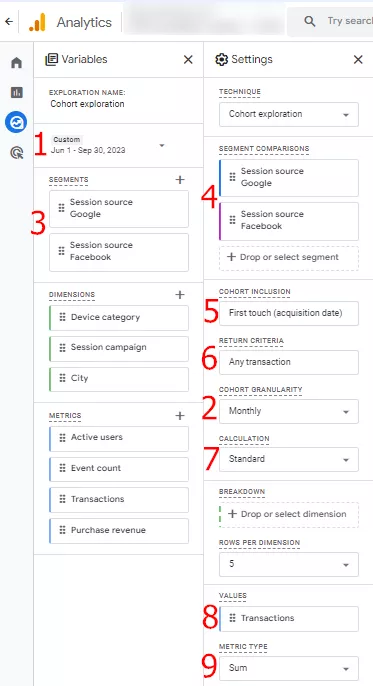
- First, choose the dates: June 1 to September 30, 2023.
- Set the cohort granularity to monthly. If necessary, you can change it to shorter periods.
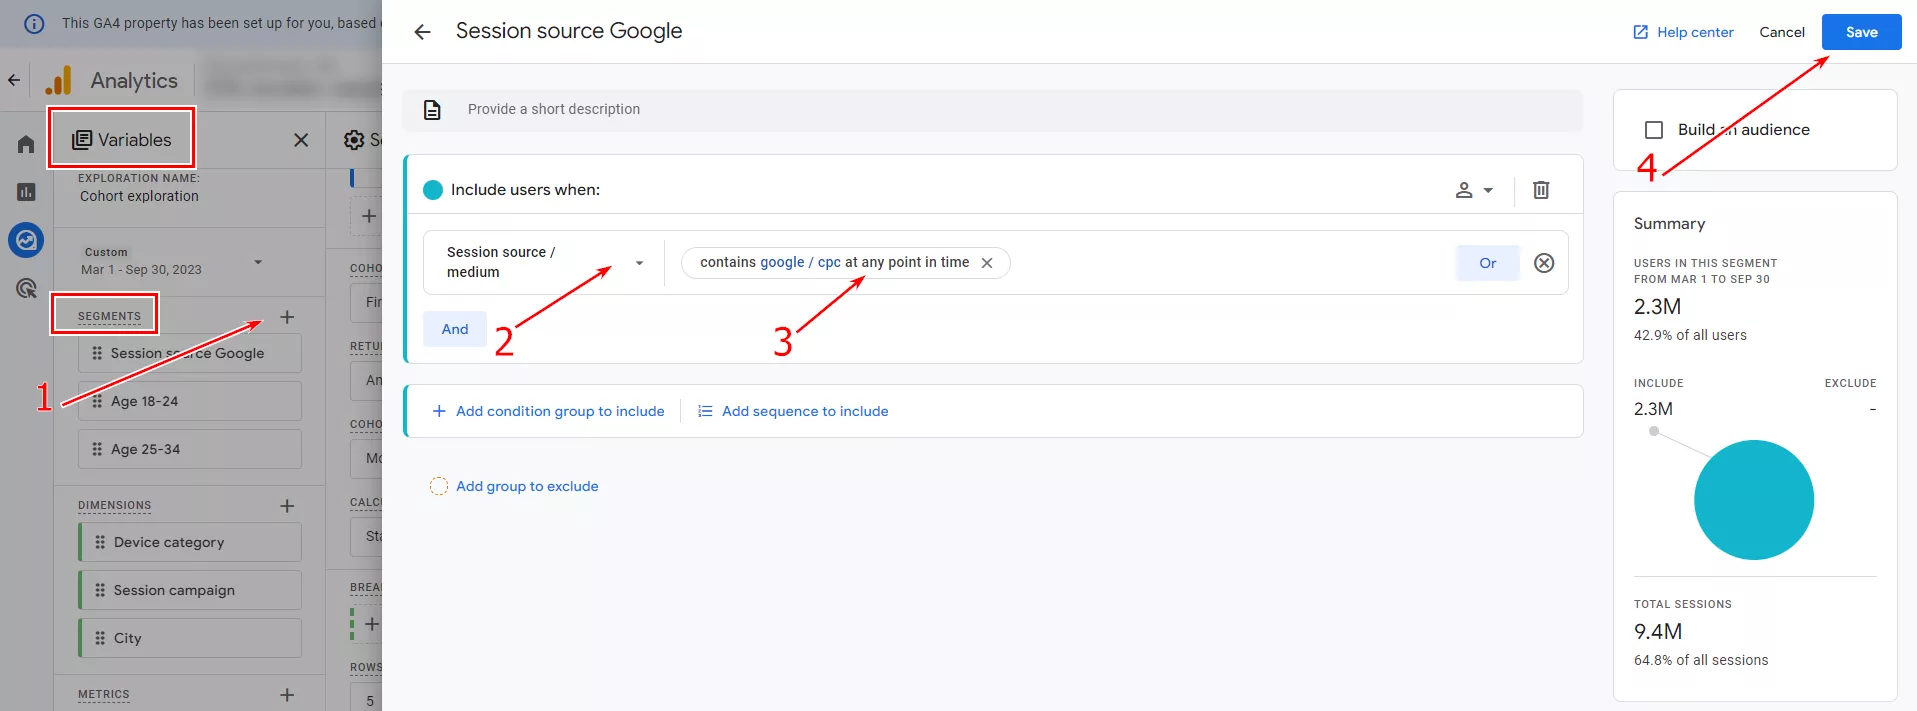
- Create user segments with Google and Facebook session sources:
- in the Variables section, click the plus sign next to Segments in Variables;
- select Session source/Channel;
- add a filter with the condition Contains Google/CPC value at any time (CPC is a channel with cost-per-click only in paid advertising, and at any time is the time period when the condition is met);
- give the segment a unique name, such as Google session source;
- apply user inclusion and save the segment.
Use the same method to create a segment that includes users with the session source condition Contains Facebook/CFS value at any time.
- Drag the created segments to Settings > Segment comparisons. The report display shows cohort comparisons by session source on the first touch.
- Select First touch (acquisition date) in the Cohort inclusion criteria. Now, you can see a sample of users who first visited the site between March and September.
- In the Return criteria, specify Any transaction. Thus, the report will show the number of user transactions for the zero month (at the first touch) and the further retention of these users during the next three months.
- Choose the Standard calculation type to see the number of transactions performed directly for the periods 0, 1, and 2 months after the first touch, not the total number.
- Specify the Transactions to see the number of completed transactions in the cells. Check if this option is available in Variables – Metrics. If not, add it at the Variables level and drag it to Values.
- Select the Sum metric type. This will display the actual number of transactions rather than the percentage of transactions.
Congratulations, the cohort exploration is ready!
Report results
First, compare the cohorts who navigated to the site from Google and Facebook.
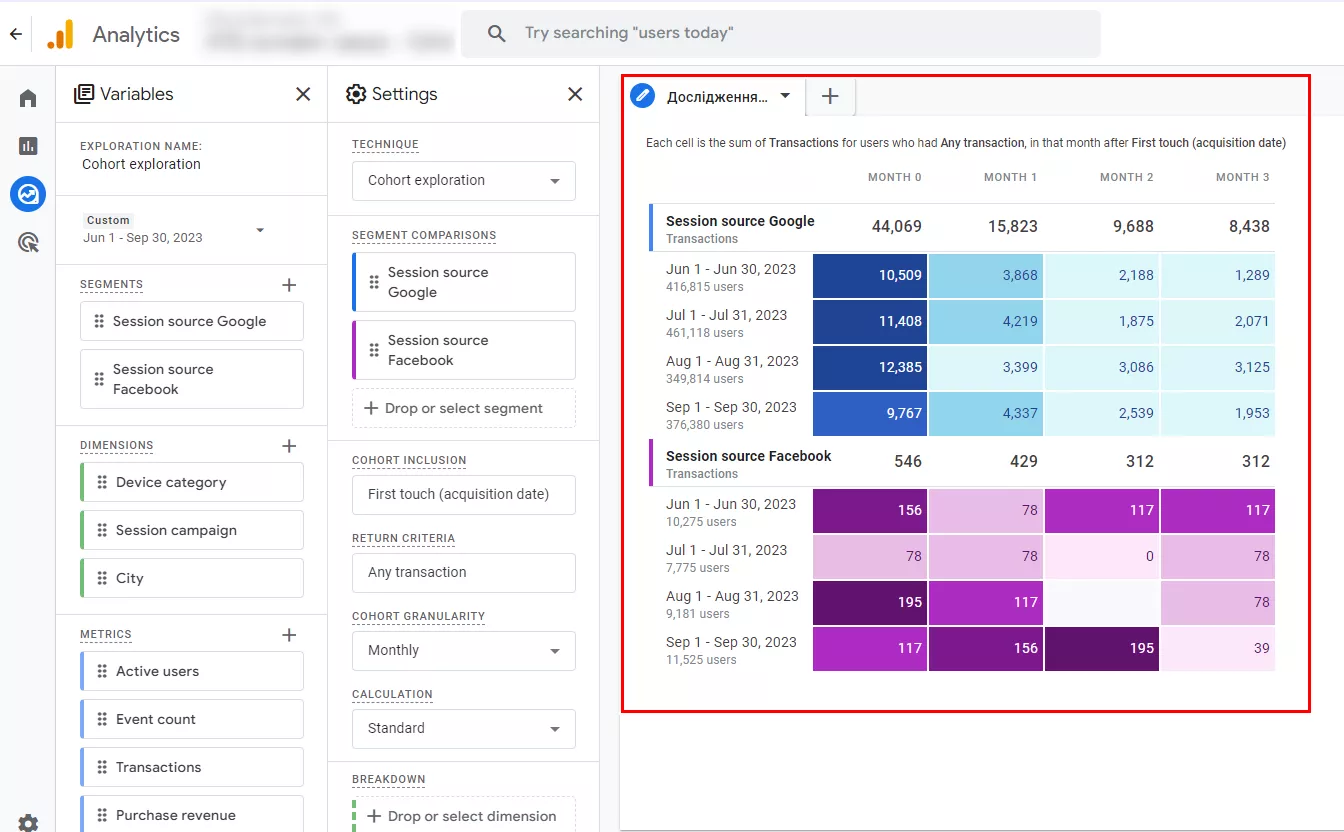
Google highlights cells with significantly better results with more intense colors
- According to Google's source, we can see a positive trend in the number of transactions from June to September, from 6,464 to 9,100 respectively. Since the dynamics of the increase in the total number of new users fluctuates, the increase in the number of transactions is caused by an increase in the budget and quality work on advertising campaigns.
- The Google source cohort with a first contact in August has lower repeat transaction rates in subsequent months than in July. New users from July ads made 2,551 transactions in the following month, while new users from August ads made fewer transactions – 2,211. However, adjustments were made in September to improve the situation and increase the number of repeat transactions to 2,913.
- Facebook source cohorts show interesting results. Compared to Google cohorts, they have a three times lower transaction rate per total number of users in month 0. But at the same time, they show fantastic statistics regarding repeat transactions. For example, the same number of transactions for month zero and month one after the first contact in June and September.
Next, change the value to Active users. If you change the value from Transactions to Active users, the results may differ because one active user can perform multiple transactions.
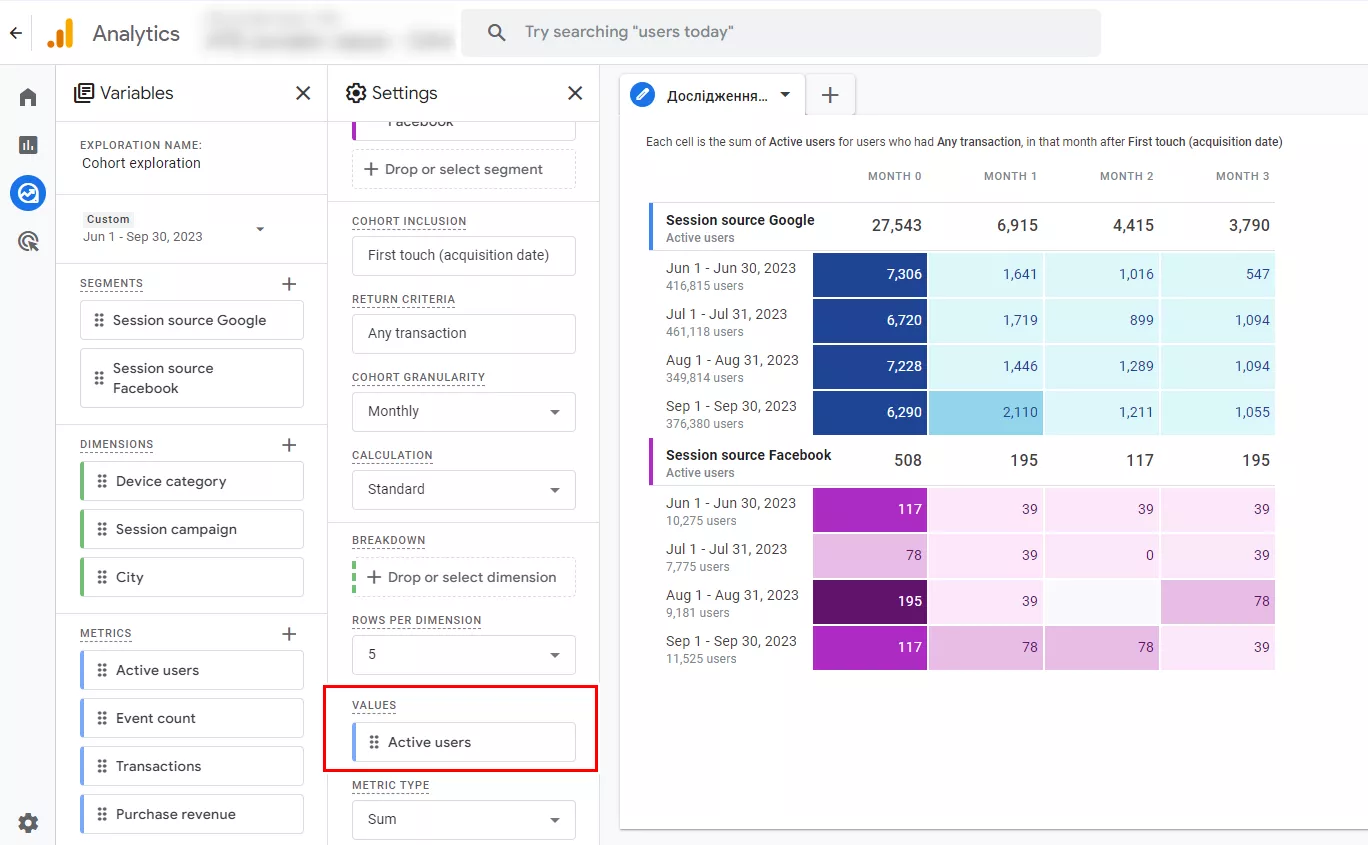
- Let’s point out the cohort of new users from Facebook in August because they have a record month 0 transaction rate for this source. It's worth noting any changes in campaign settings or promotional offers that were in effect in August and trying to replicate that success.
- The September cohort also shows much better results in retaining active users the following month after first contact.
Next, distribute the cohorts by device category. To do this, add Platform to Variables – Dimensions and drag this parameter to Settings – Breakdown.
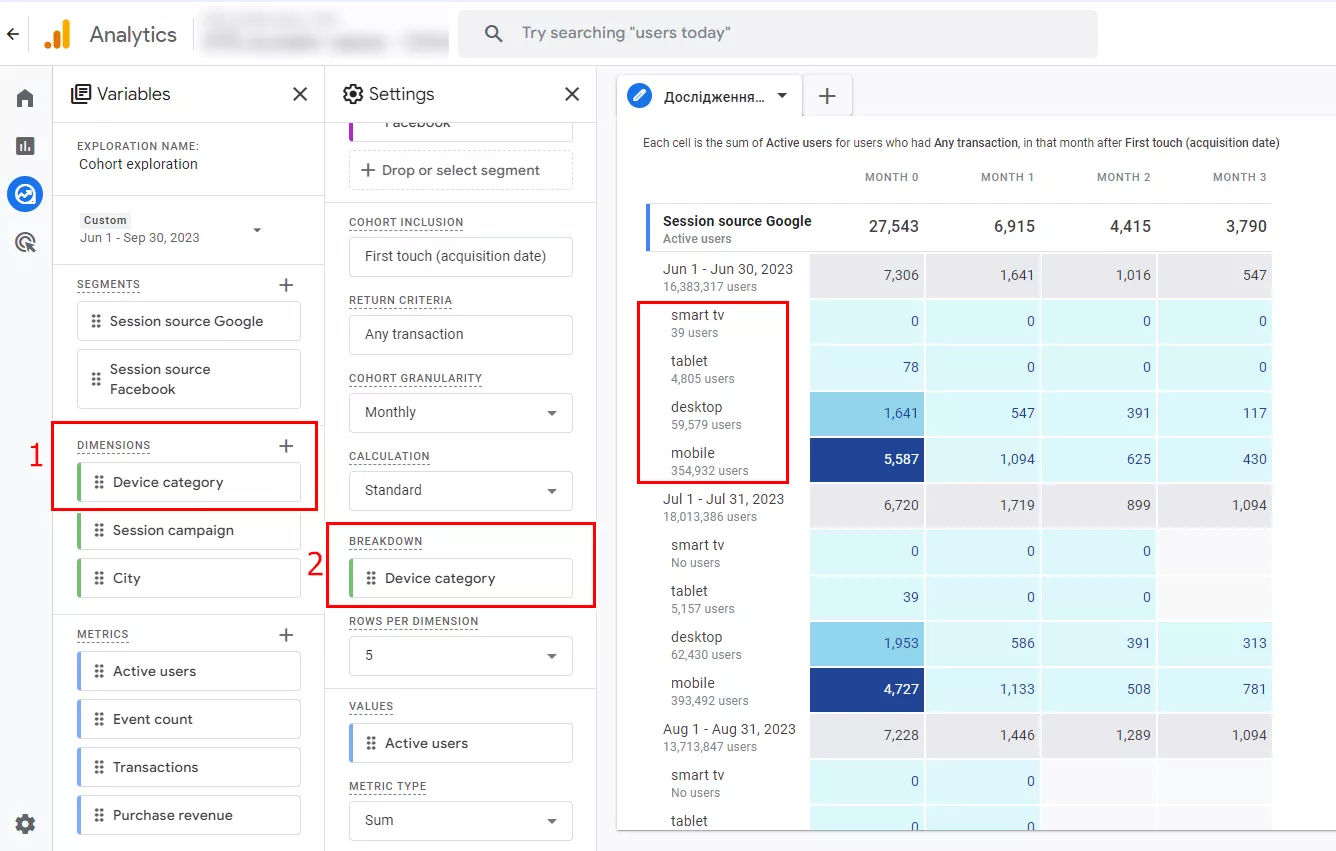
The total number of mobile active users prevails. However, desktop users have completed twice as many transactions in month 0 and have better further retention. We can see it by the ratio of active users who completed a transaction to the total number of users from the respective device category.
However, cohort exploration does not take into account that a user may be accessing the site from different devices. It is worth exploring other reports in Google Analytics 4 for a complete picture.
Limits of cohort exploration reports
Although the cohort study report is very flexible, it has certain limitations.
1. Data thresholds. Some of the data in the study may not be available. Google has a privacy policy to ensure the anonymity of small cohorts of users. For this purpose, system-defined data thresholds are used in the reports.
Therefore, when examining demographics, only data greater than the thresholds are visible. This is hardly a disadvantage since a small sample of users is not enough to form hypotheses and get a complete statistical picture.
2. The maximum number of parameter rows for the distribution is 15. When breaking the cohort into subgroups, only the first 15 values of the selected parameter are available. This data may not be sufficient if the list is very large.
3. The maximum number of cohorts is 60.
4. The cohort definition does not include the User ID. Cohort statistics are calculated based on User ID only.
For example, suppose a user first interacted with the site using a smartphone and was included in the cohort inclusion criteria but later made repeated purchases using a desktop device. In that case, they will not be included in the cohort return criteria. This factor significantly affects the statistical data when customers use multiple devices.
5. Other users of the GA4 resource have only view permission on a report. This can be inconvenient when multiple users are working at the same time.
Fortunately, most of the limitations can be bypassed if you create a report using BigQuery.
Accessing and sharing reports
To find a previously created exploration, open Cohort exploration in Google Analytics 4, go to Explore, and search the list by name.
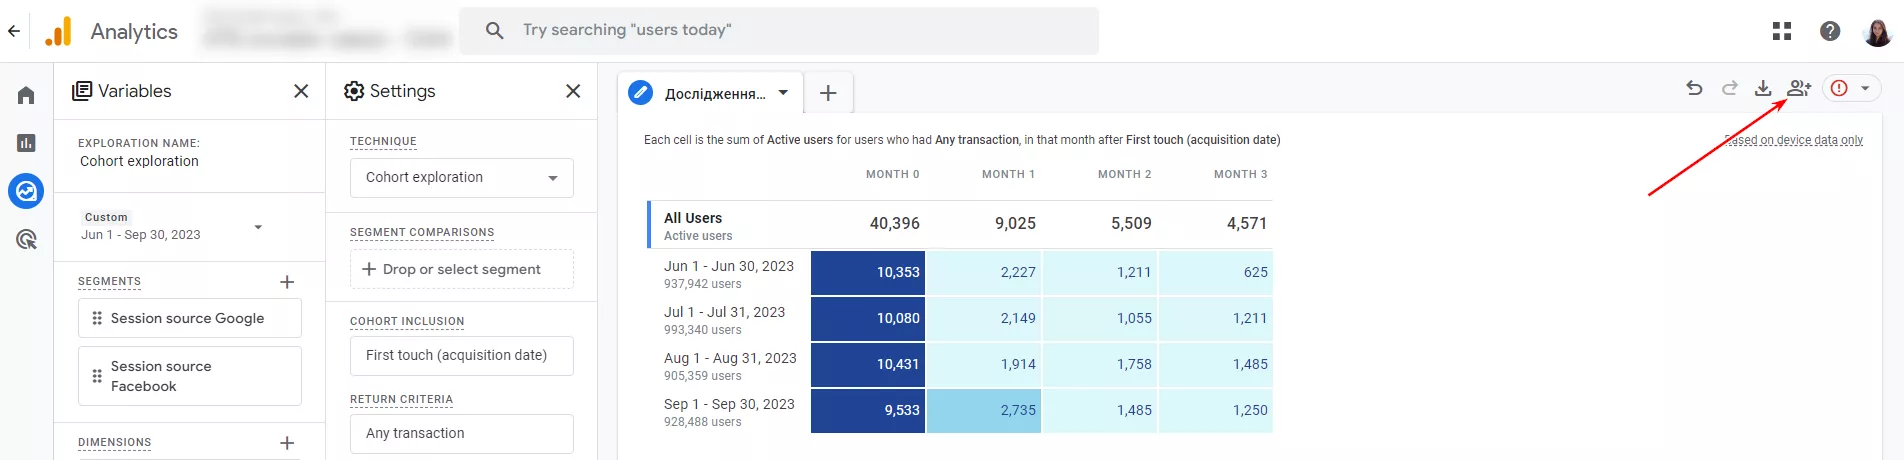
There are several ways to share report results with colleagues and managers.
- Grant access to the exploration directly in Google Analytics 4 by clicking the Share exploration icon in the upper right corner. All GA4 users will have view-only access.
- Export the exploration if you want to share it with someone who does not have access to Google Analytics 4. To do so, open the exploration, click the Export data icon, and choose from several export options, such as Google Sheets. You can then provide access to the data in the report using these options.
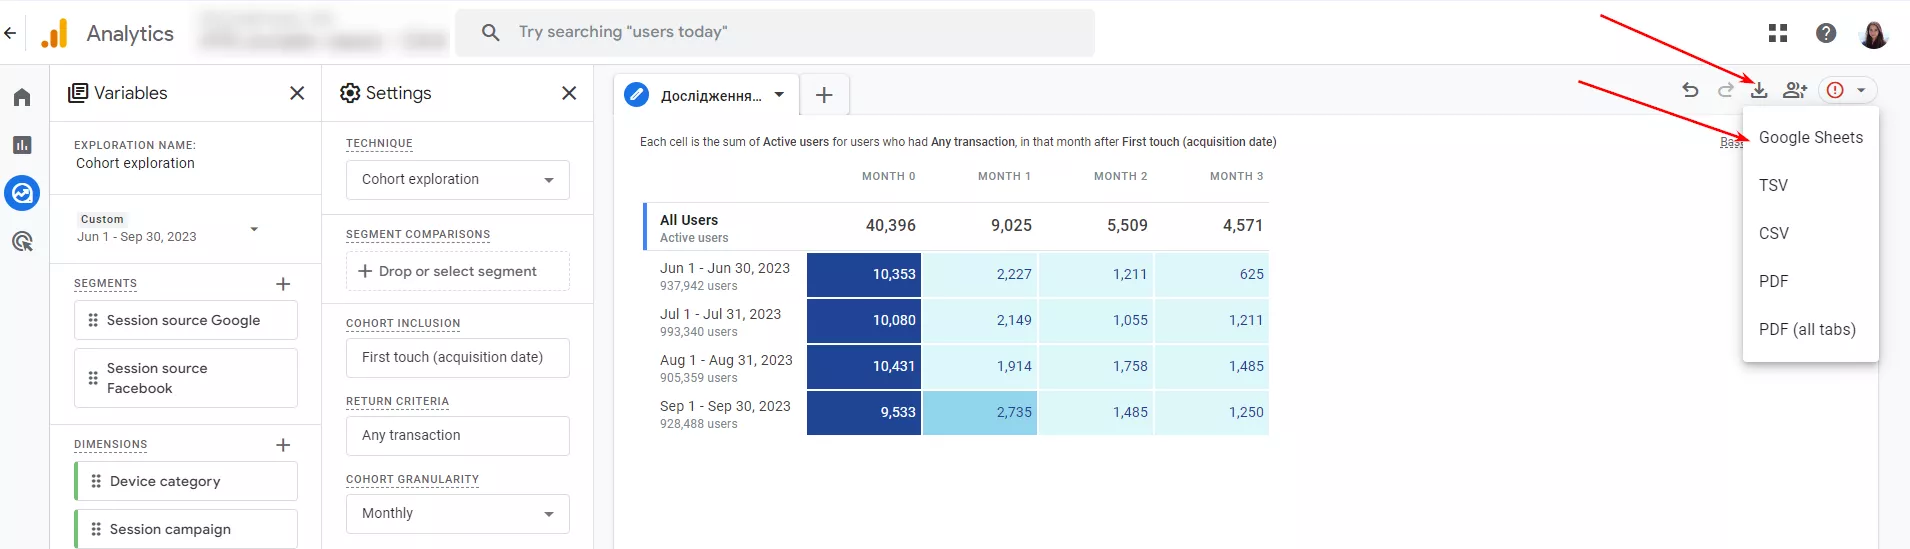
The export function allows you to complete a cohort study with calculations.
For example, select Values – Purchase revenue and Metric type – Sum, to see the actual revenue for the specified periods.After exporting the report to Google Spreadsheets, you can manually add expenses for a given period and calculate them using ROAS (Return On Ad Spend) or CRR (Cost Revenue Ratio) formulas. For a correct calculation, please use Calculation – Rolling when creating a cohort exploration.
Read more about customizing Google Analytics 4 in our blog:
- GA4 Attribution Model Comparison Report: A Complete Guide
- How to Link Google Ads to Google Analytics 4: A Step-by-Step Guide
- A Guide to Custom Dimensions in GA4 Setup
Conclusions
- Cohort analysis is an important marketing analytics services and technique used to measure customer retention.
- With a cohort study, you can better understand your customers and see a more complete picture of your ad campaign performance. Most importantly, you can improve customer retention and increase your company revenue.
- To improve the results of the report, you need to compare the performance of different cohorts, optimize strategies, and regularly monitor the effectiveness of actions by reviewing changes in exploration metrics.

 4
4
 0
0
 0
0
Recommended theme posts
Related Articles
Display Advertising Effectiveness Analysis: A Comprehensive Approach to Measuring Its Impact
In this article, I will explain why you shouldn’t underestimate display advertising and how to analyze its impact using Google Analytics 4
Generative Engine Optimization: What Businesses Get From Ranking in SearchGPT
Companies that master SearchGPT SEO and generative engine optimization will capture high-intent traffic from users seeking direct, authoritative answers
From Generic to Iconic: 100 Statistics on Amazon Marketing for Fashion Brands
While traditional fashion retailers were still figuring out e-commerce, one company quietly revolutionized how U.S. consumers shop for everything from workout gear to wedding dresses