GA4 Attribution Model Comparison Report: A Complete Guide
Modern marketing strategies involve using multiple traffic sources and creating numerous advertising campaigns. It’s important to track which are more effective and drive users to convert. The attribution model comparison report in Google Analytics 4 can help you do that.
Why do we need an attribution model comparison report?
It helps you measure the effectiveness of traffic channels and ad campaigns and identify growth points to increase ROI.
Let’s imagine a situation.
- A user sees an ad on YouTube and visits the website, being assigned to one of GA4’s audiences.
- Next time, after getting to know the brand better, the user sees a carousel ad on Facebook with attractive prices. They click on the link but do not convert.
- Next, they type the product name into the Google search bar, see a Google Ads ad, go to the website, and convert.

You may come up with some questions.
- How do you know which interaction drove the user to convert?
- If a user converted after interacting with a Google search ad, is that the only ad that delivers results?
- Could YouTube and Facebook ad campaigns be a budget drain and should be stopped?
- Is it possible to consider the influence of all interaction points on the path to conversion?
To find the answers, you need to analyze attribution.
Attribution is the act of assigning credit for conversions to different ads, clicks, and factors along a user’s path to completing a conversion. It has rules and algorithms for assigning values that vary by model.
Reports on channels or campaigns for the same period will have different value metrics depending on the attribution model.
What are the different attribution models?
There are two main models in Google Analytics 4 reports: last-click and data-driven.
Last click attribution
It gives 100% of a conversion’s credit to the final touch or visit that occurred right before the eventual conversion. The report shows the channels with the highest performance, considering only the last touchpoint before the conversion event.
For example, a user had three points of interaction: a YouTube video, a Facebook carousel ad, and a Google search ad. In the report, 100% of the conversion value is attributed to the last interaction - the Google search ad. The previous touchpoints show the cost.

Exception. Attribution does not take into account direct conversions to a website if paid traffic channels are involved in the path to conversion. If the last point of interaction was a direct conversion, the conversion value will be credited to the last paid click from Google ads.
Data-driven attribution
It uses artificial intelligence to distribute the value of a conversion across all points of interaction, taking into account a number of factors:
- device type;
- the order in which ads are displayed;
- the total number of touchpoints;
- the types of resources and ads;
- the time between interaction and conversion, etc.
Using AI, the data-driven attribution model can analyze more than 50 points of interaction and calculate the impact of each. It is customized for each advertiser and conversion event to accurately reflect channel performance.
If a user had three points of interaction: a YouTube video, a Facebook carousel ad, and a Google search ad, the report would show that each has its own percentage of influence on the result.

In Google Analytics 4, reports use data-driven attribution by default. The exception is Google Analytics 4 traffic source reports, which are displayed using last-click attribution.
Last-click attribution is used in Universal Analytics reports, where you can analyze historical data. When analyzing long periods, please note that the data-driven attribution model has existed since November 2021. Data for earlier periods will be displayed by last click.
Explore our glossary for essential web analytics definitions to sharpen your data insights!
How to analyze a model comparison report?
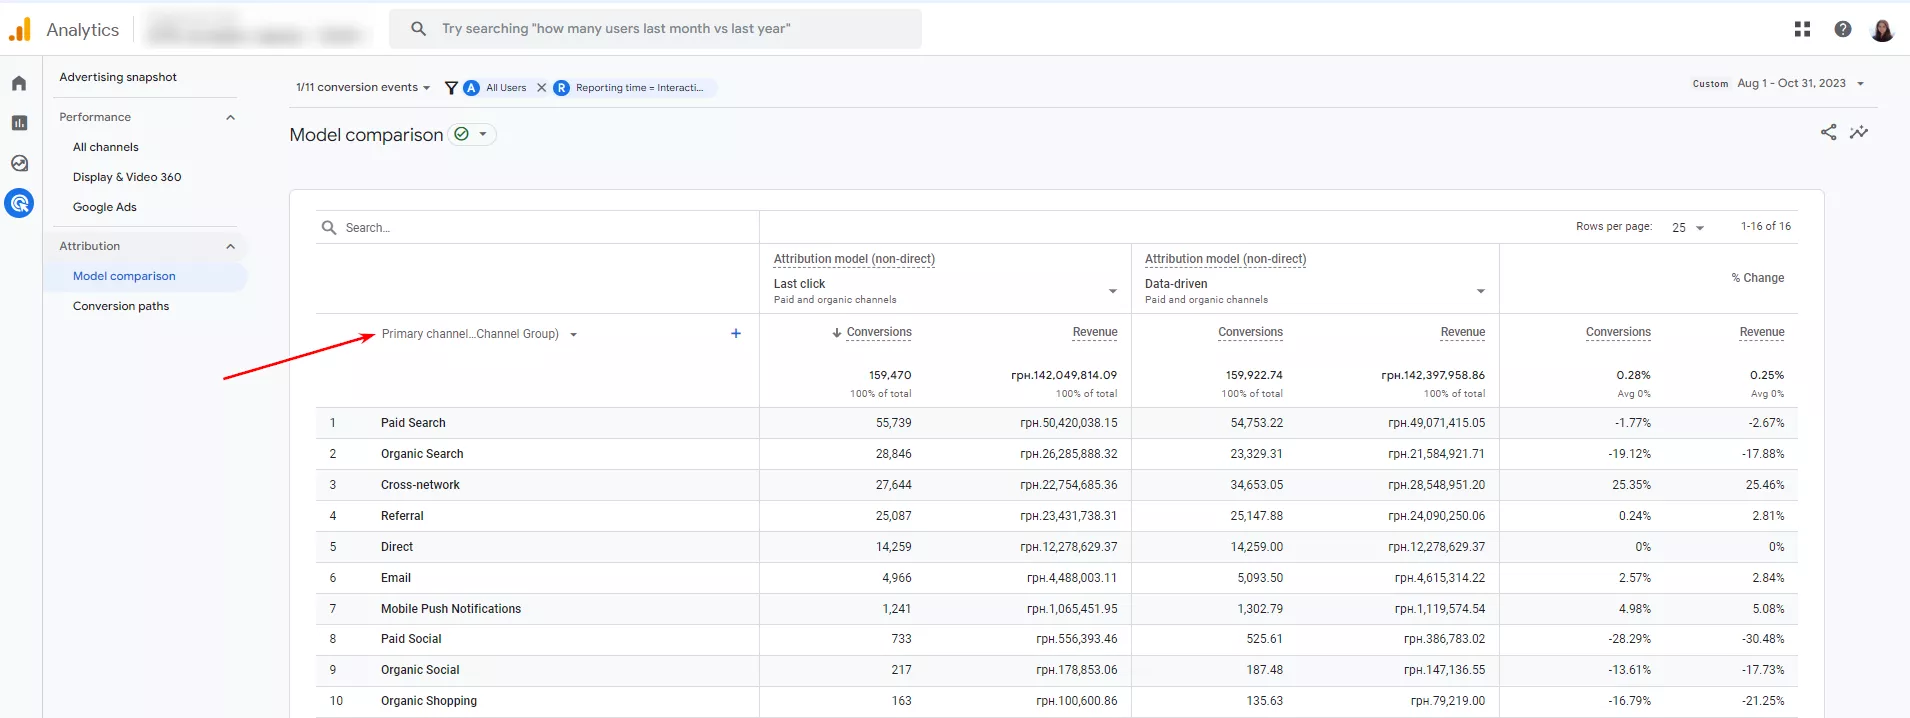
The final model comparison report consists of one parameter block and three metric blocks.
- Metrics are calculated based on the last-click attribution model with actual data.
- Metrics are calculated based on the data-driven attribution model with actual data.
- A block containing the percentage difference in data between two attributions.
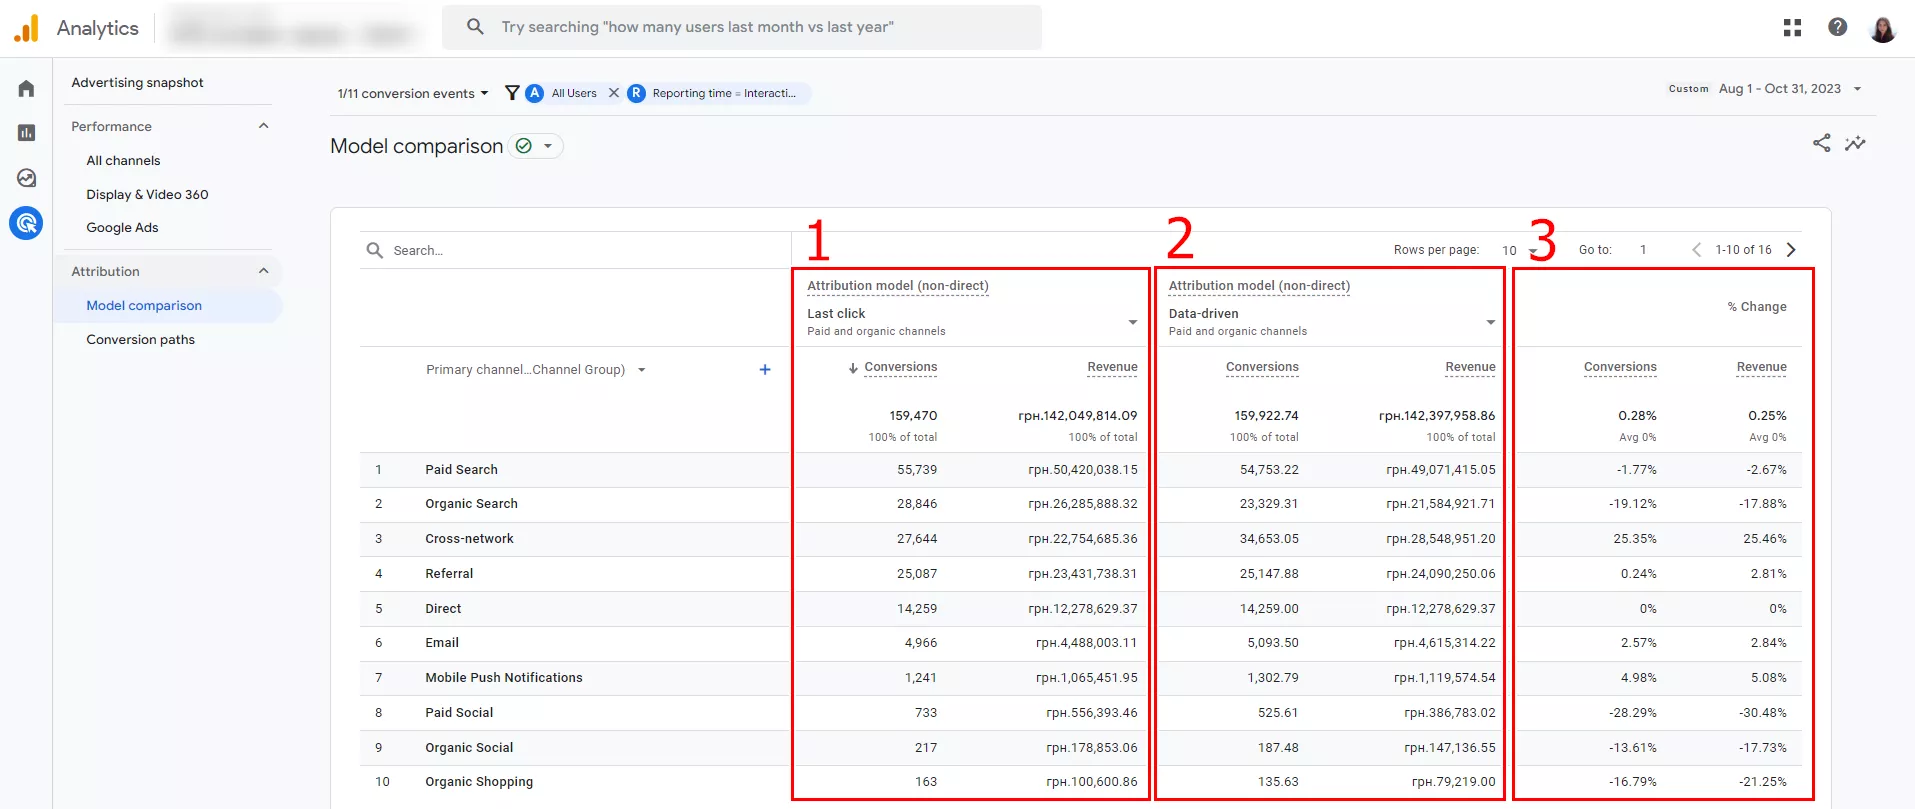
The report shows that the number of conversions and revenue changes next to each channel group depending on the attribution model.
To see the difference in the data for a group of channels, sort them by the largest difference in the number of conversions. For clarity, change the number of rows from 10 to 25.
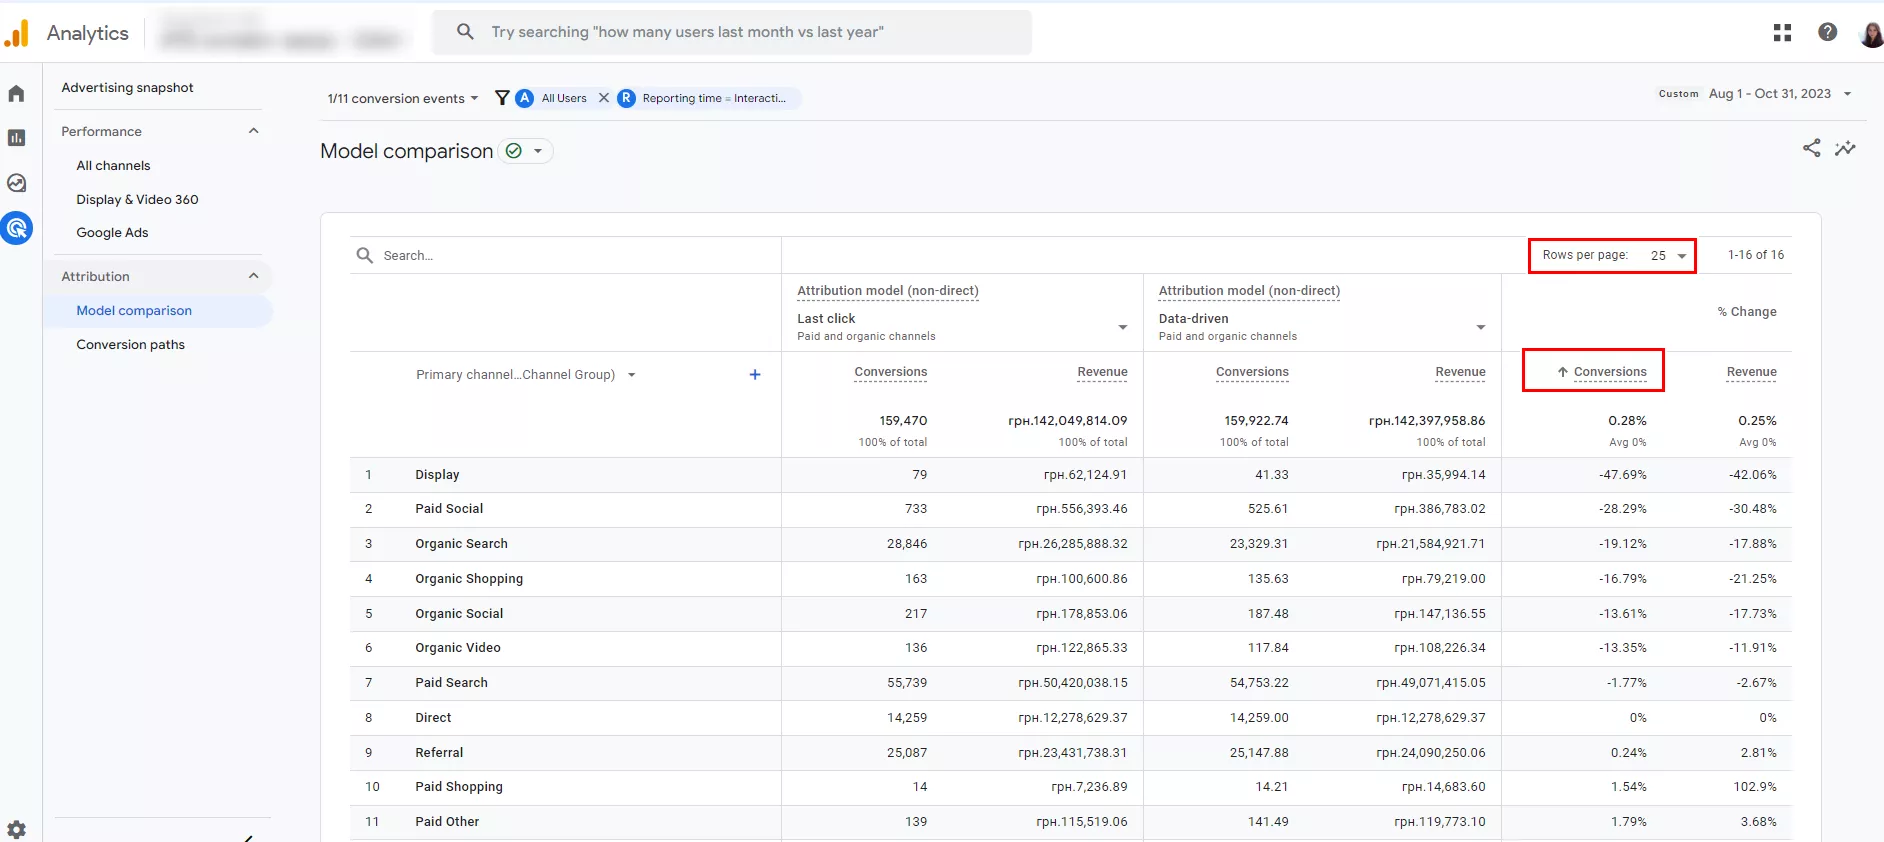
Here are the conclusions I drew from the report.
- Display is the most overvalued last-click channel group. It received 79 conversions, but if you consider the previous touchpoints before the conversion from Display, the value of the campaign drops to 41.33, which is almost half. It’s worth considering optimizing this campaign to improve results and de-prioritizing it in favor of more effective ones.
- The value of Organic Search dropped significantly to 19.12%. Users interact with other channels, including paid, before coming to a site through organic search and conversion. Bottom line: the overall profitability of paid advertising is higher than last-click attribution reports show.
Next, look at the report by the campaign. Select Campaign in the first column. For convenience, sort by the number of conversions from highest to lowest. Click Conversions in the second column with the data-driven attribution model.
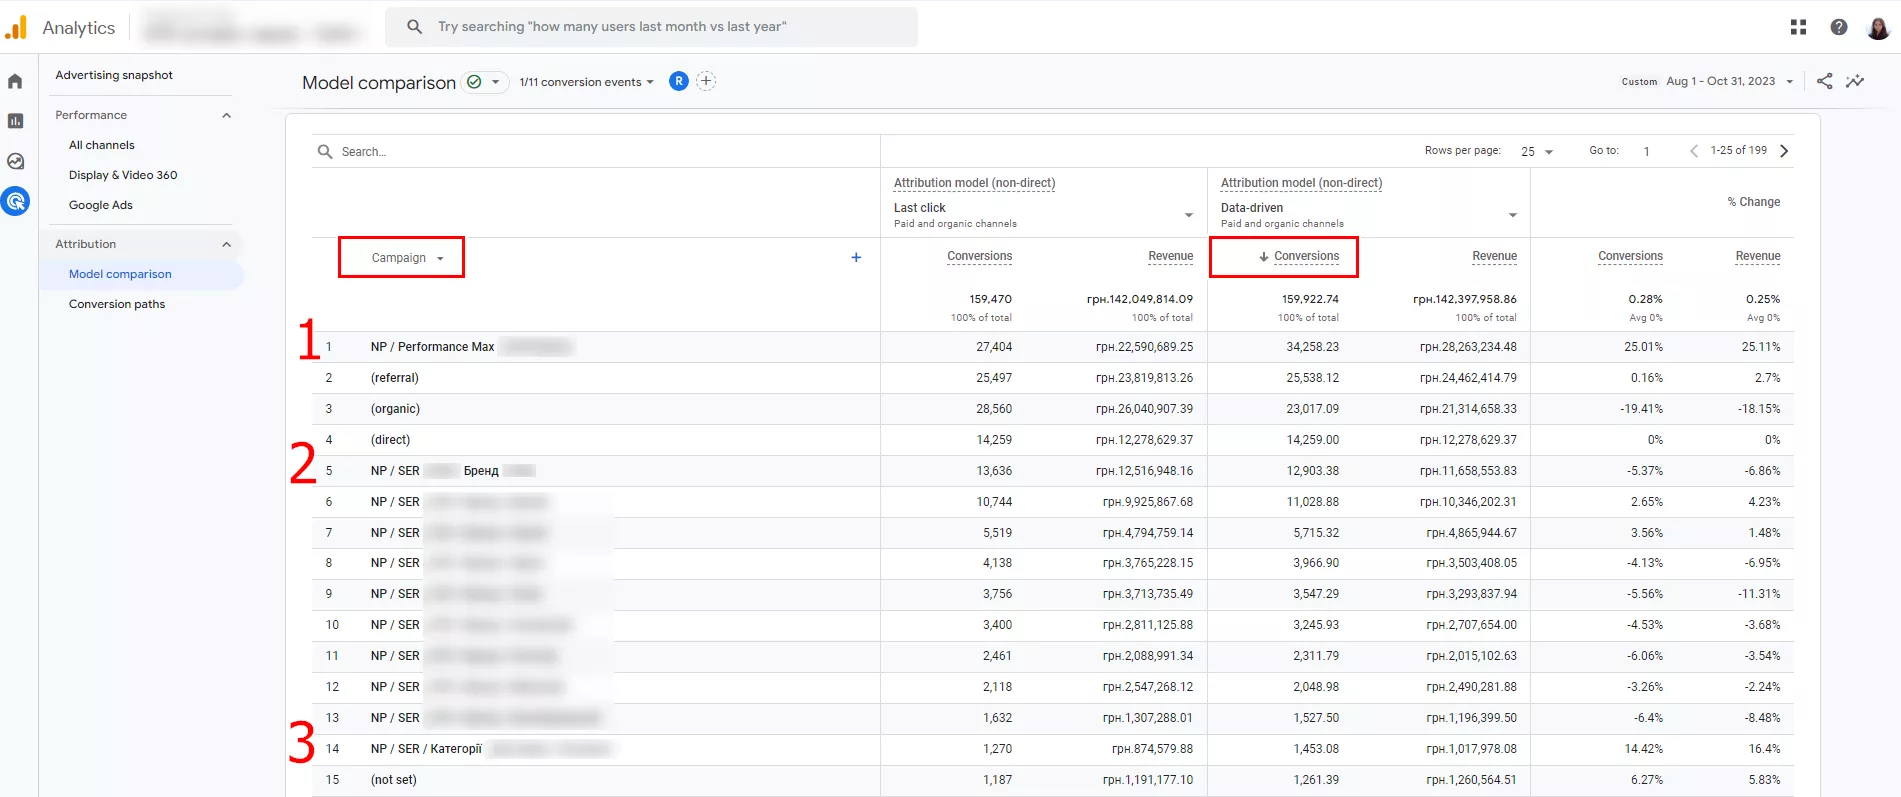
Here are the conclusions we can draw from the report.
- The Performance Max campaign has 25.01% more value. The report shows that campaigns with graphic creatives and videos positively impact conversions and revenue. However, the last touch before conversion may go to search ads or other channels.
- Brand marketing campaigns have 5.37% less value based on data. They can’t get the full value per conversion to their account because the user has to learn about and engage with a brand before they search for it in the search bar.
- A search ads category ad campaign performs 14.42% better in terms of data-driven attribution. Since it aims to attract new customers, this metric is very relevant. It is worth considering scaling it up.
In this article, you can see the ad campaign reports of one of Netpeak’s clients. Taking into account the results, they decided to strengthen their
- campaigns with maximum efficiency;
- campaigns aimed at attracting new customers.
This meant deliberately increasing the price per PPC conversion.
As a result, this increased the company’s revenue and the total number of active customers.
When looking for growth points:
- don’t stop at one or two report settings;
- experiment with levels narrow the data by the audience;
- choose different conversion events;
- analyze specific parameters;
- look for campaigns that are significantly involved in the conversion path and are successful at the last touchpoints.
How to build a GA4 model comparison report?
The report shows the ad campaign and channel performance over a certain period, comparing only attribution models. It is available in Google Analytics 4 for free.
Main requirements for using the report:
- conversion tracking configured;
- at least 30 days of raw data collected — the more data, the better the accuracy.
Let me tell you how to create a model comparison report.
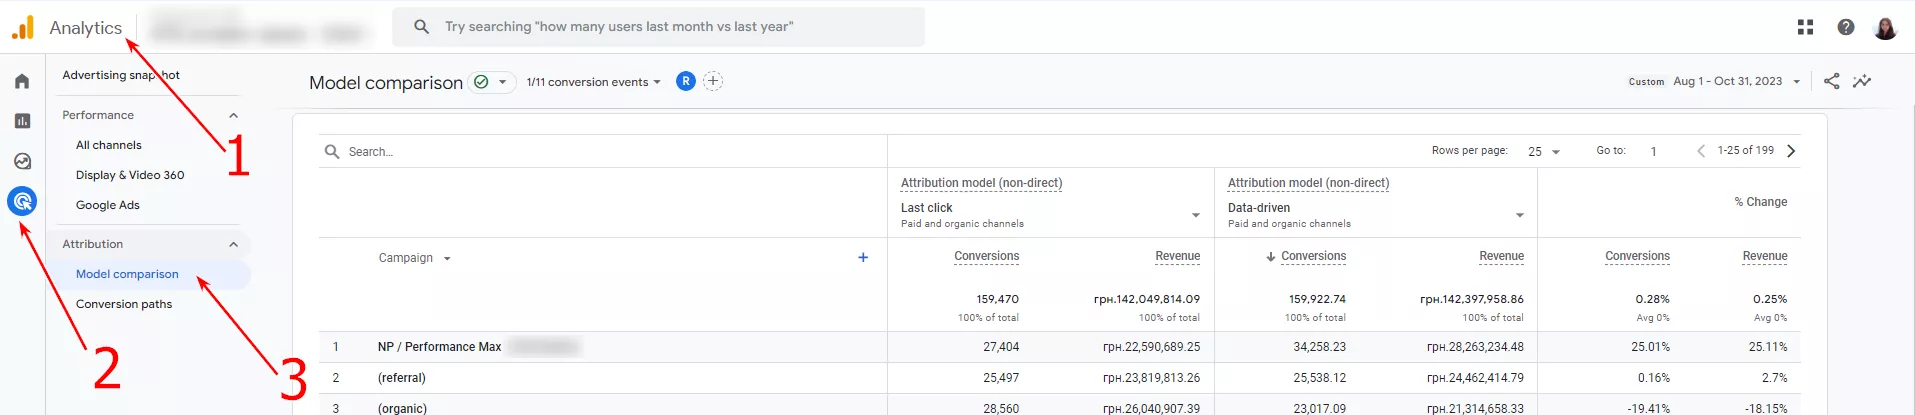
1. Open Google Analytics 4 and select Analytics from the left menu.
2. In the Attribution section, click Model comparison to open the report settings workspace.
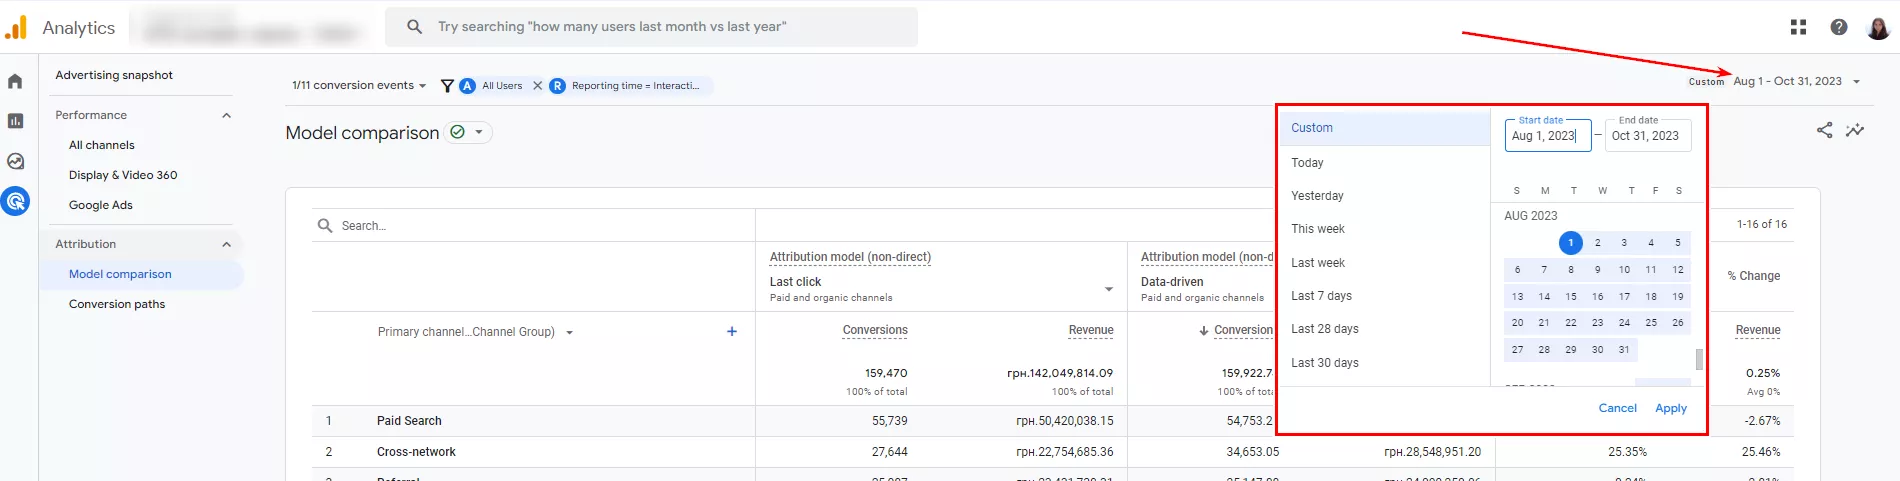
3. Set up the data. Select the desired time period from the drop-down menu. The accuracy of the statistics depends on the length of the period and the amount of data analyzed.
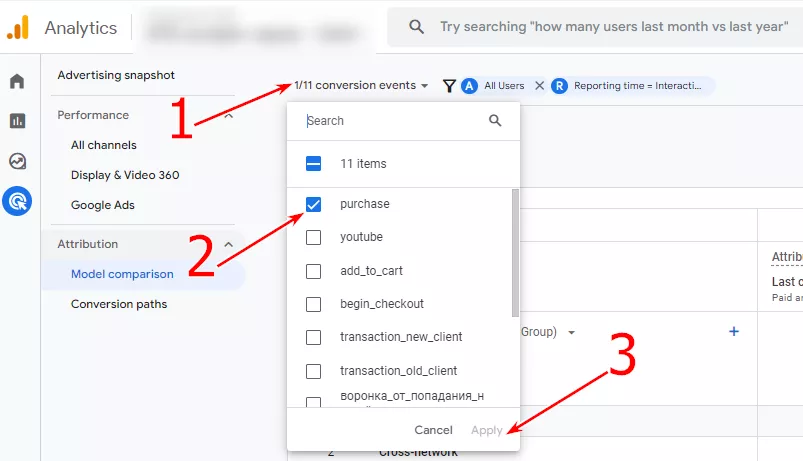
4. Select a conversion event. By default, Google Analytics 4 offers to include all conversion events.
To analyze specific conversions, such as purchases, click the drop-down menu, select the checkboxes next to each, and click Apply.
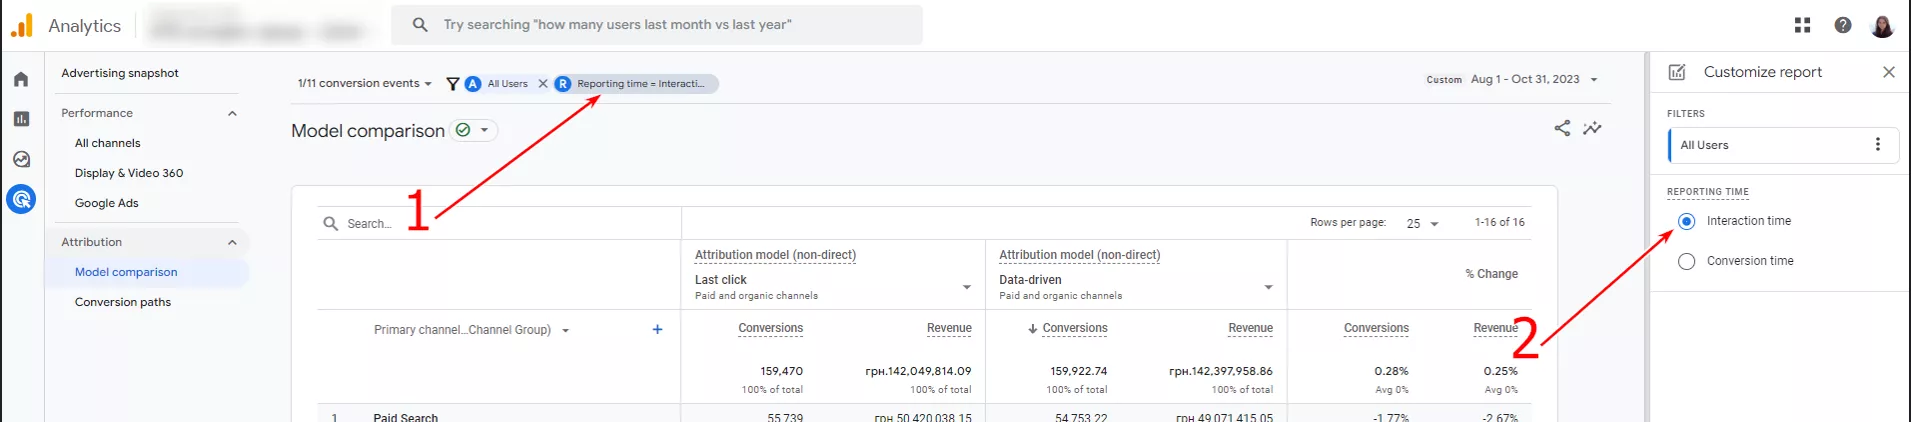
5. Set the time of the report. There are two options:
- Interaction time: the report will include all interaction points for the specified period;
- Conversion time: the report will include only the interaction points that led to the selected conversion event for the specified period.
By default, Google shows the conversion time. To change this, click Conversion time in the right menu and check the box next to your desired parameter.
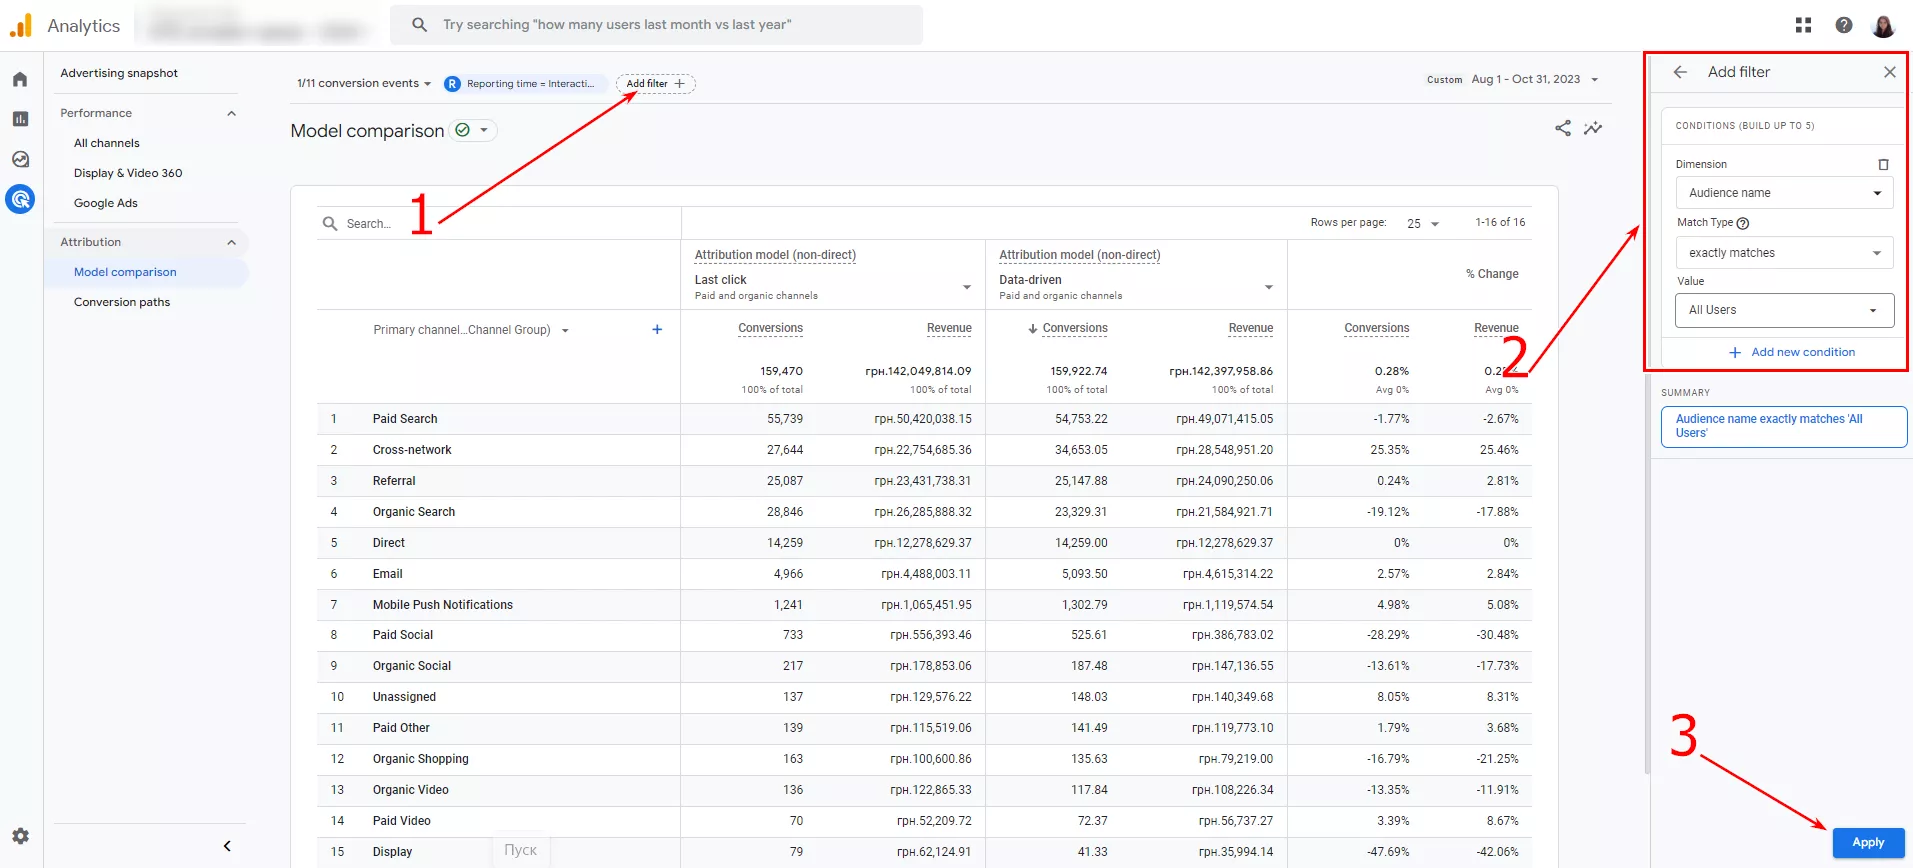
6. Filter audiences by the criteria you need. The report will show all users by default, but you can narrow it down. To do so, click Add Filter + in the top menu. The settings panel with three audience filters will open on the right.
- Dimension. Allows you to specify characteristics such as Geography (city, country, region), Demographics (age, gender), Traffic Source (campaigns, channel groups, ad group names, ad network types), Device, etc.
- Match Type. Select Exactly matches or Does not exactly match the value specified in the filter.
- Value. This includes audience segments created at the Google Analytics 4 account level that are commonly used in Google Ads: All users, Visitors to specific pages on the site, Users in the last 14 or 30 days, etc.
You can add Conditions for audiences to narrow them down by additional parameters: geography, demographics, etc.
7. Select the main parameter for the report from the drop-down menu:
- Default channel grouping
- Source/Medium
- Source
- Medium
- Campaign
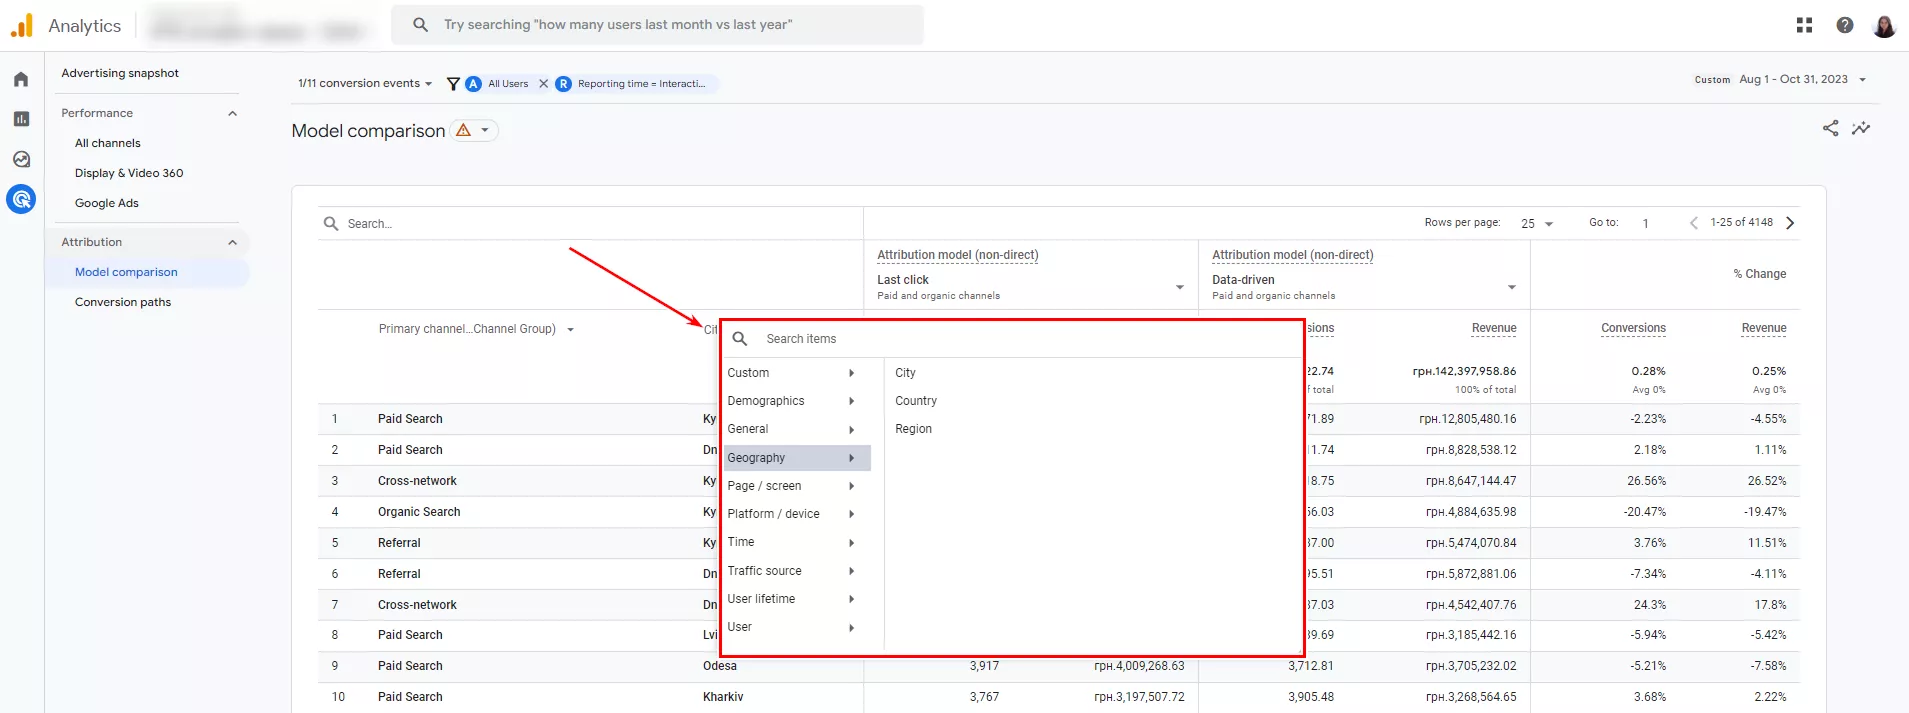
Next to the main parameter, you can refine the report data. Click the + sign to open the menu with items to search by City, Age, Gender, Traffic Source, Device, etc.
When filtering by the audience, the data is shown only for the selected audience (for example, New York). If you refine the parameter, you can see a comparison between several audiences by the selected parameter (for example, a comparison of New York, Los Angeles, Chicago, and San Francisco).
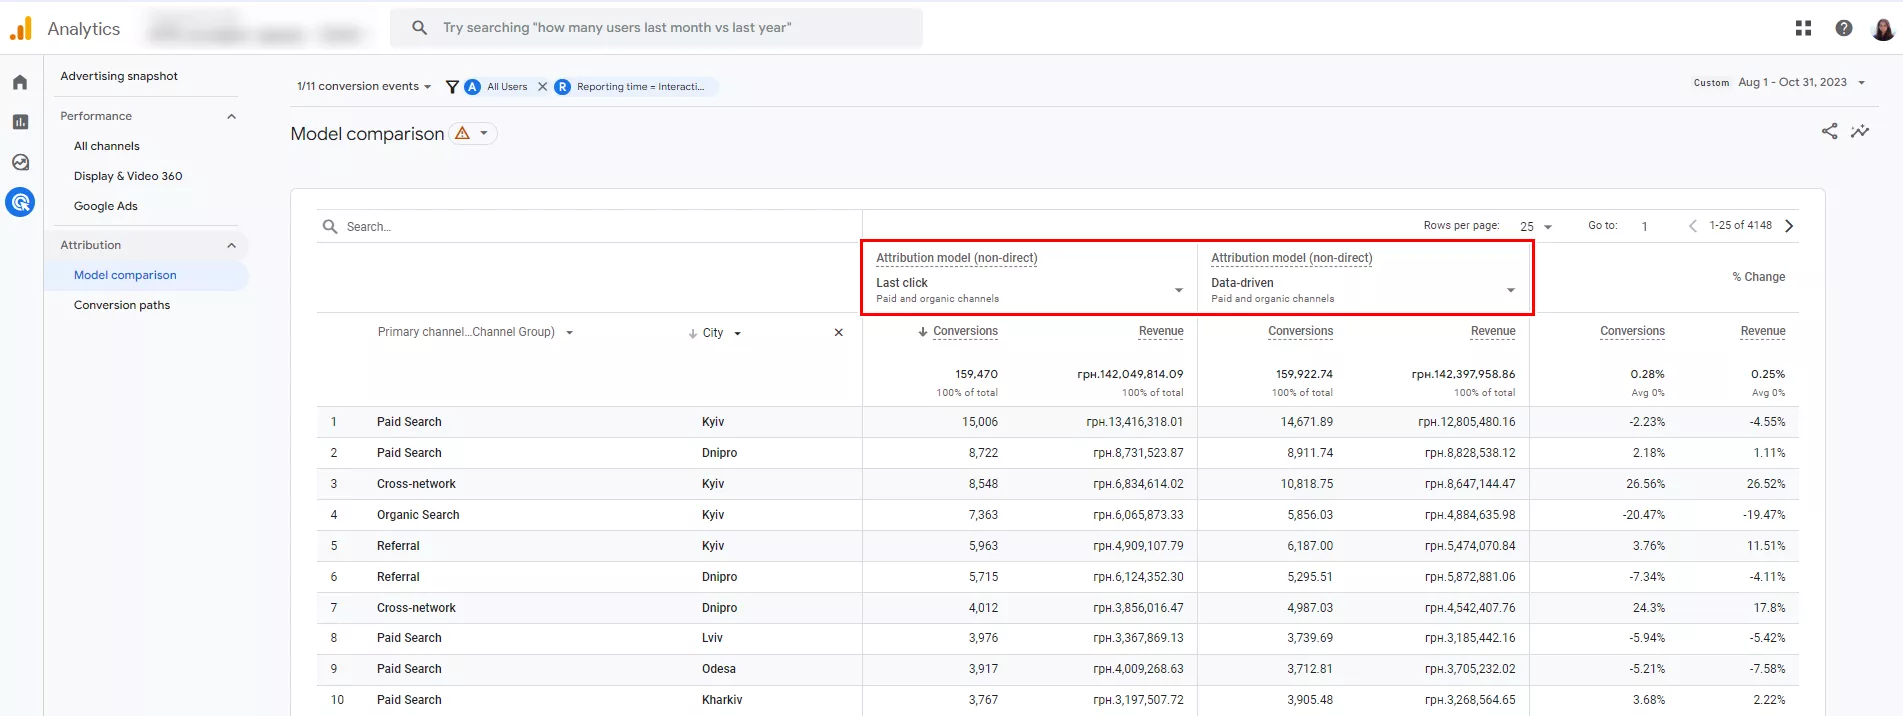
As you continue to work with the report, you can filter the parameters in the search bar.
8. Compare attribution models. There used to be more models available: first-click, linear, position-based, time decay, etc. But as of May 2023, Google no longer supports them. Currently, two main attribution models are available for comparison: last-click and data-driven.
That’s it. You’re ready to go!
How to share a report?
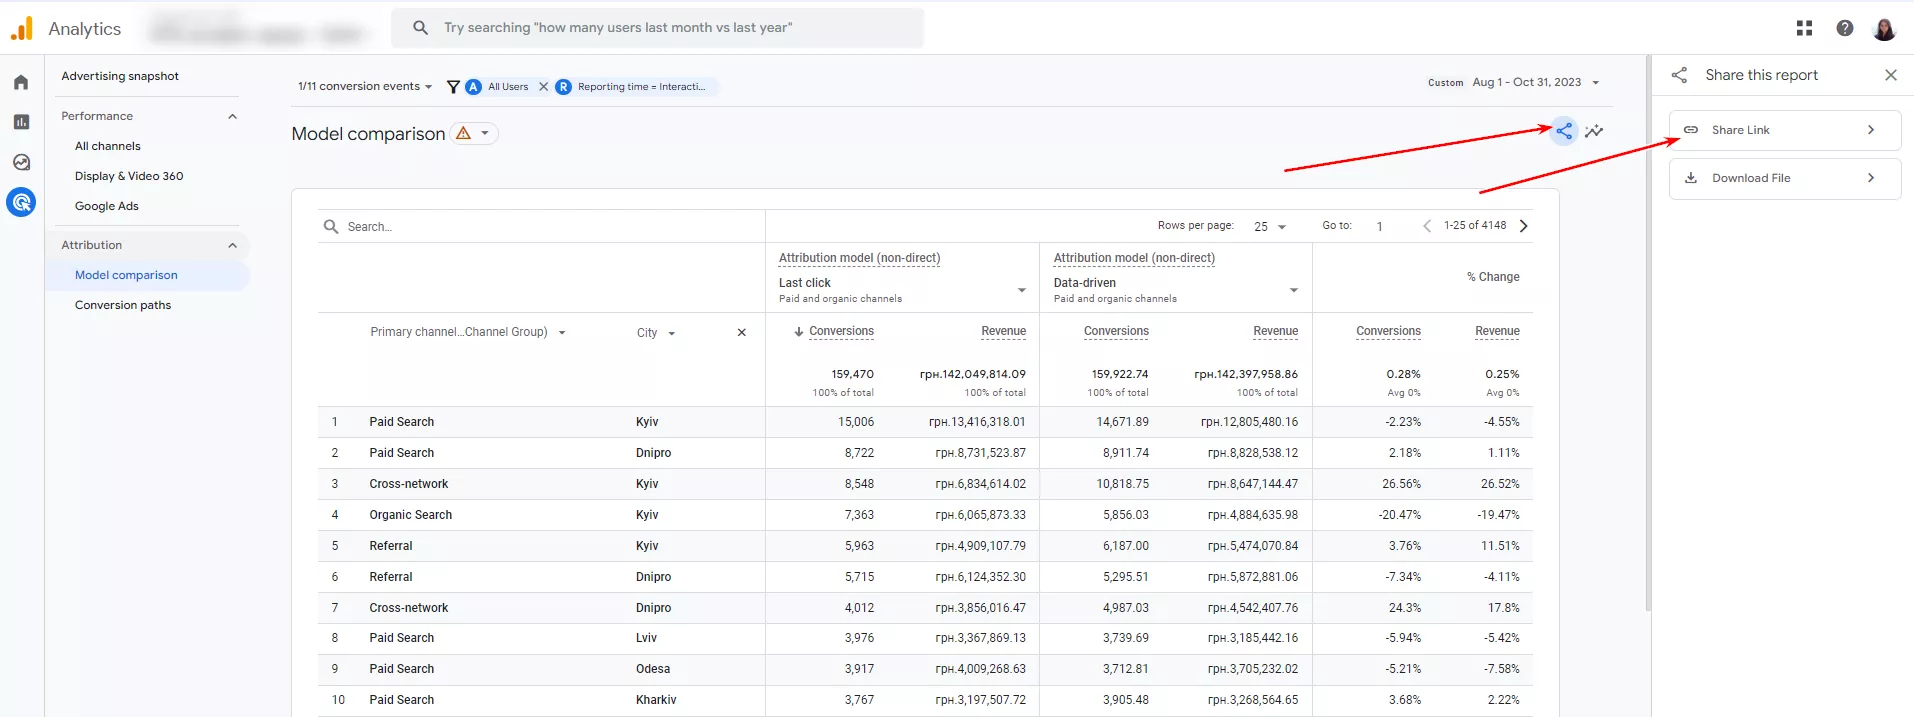
There are two ways to share a report with colleagues or clients.
- Send a link to the report if the recipient can access Google Analytics 4.
- Download and send the CSV file to the recipient. It will work regardless of access to the resource. You can also add additional data and formulas to the downloaded report, such as costs and profitability.
The Share report feature is located in the model comparison report. To access it, click the icon in the upper right corner of the report and select the desired option.
Disadvantages of the GA4 model comparison report
Here are the features of the report that you should consider when working with it.
- The data-driven attribution model became effective on June 14, 2021. Data from prior periods cannot be analyzed using this model.
- Some parameter values may be unavailable or deleted. In this case, the report will contain the values Not specified, Attribution impossible, etc. For example, manually tagged URLs may not have the Campaign, Source, or Channel parameters.
- Data-driven attribution reports include not only actual conversions and profits but also probable ones, that is, hypothetical indicators provided by artificial intelligence. The algorithms and attribution principles cannot be verified; you must blindly trust them.
- Less statistical data in analytics means less accurate modeling. In this case, it is more difficult for marketers to identify real development points and ways to optimize advertising campaigns.
To get around these drawbacks, large campaigns create their own attribution models. The advantages of this solution are as follows:
- full transparency of value attribution;
- flexibility in choosing the principles of attribution;
- taking advantage of existing attributions and eliminating their disadvantages;
- considering all the business details and the ability to find growth points;
- identifying potential problems and better understanding the importance of different ad campaigns and channels.
Read more about customizing Google Analytics 4 in our blog:
- Cohort Exploration in Google Analytics 4: How to Retain Customers More Effectively
- How to Link Google Ads to Google Analytics 4: A Step-by-Step Guide
- A Guide to Custom Dimensions in GA4 Setup
Conclusions
- The attribution model comparison report shows the importance of different user touchpoints on the path to conversion.
- It helps you allocate your advertising budget, increase revenue, and optimize your campaigns.
- The attribution model comparison report helps you analyze how the percentage of conversion value changes over time.
- There are two main models in Google Analytics 4 reports: last-click and data-driven.
- To share the report with colleagues or clients, copy a link to the report or download a .csv file.
To get a complete picture of your advertising performance across all platforms, our Business Intelligence & Analytics Services can help you unify your marketing data and uncover growth opportunities.

 2
2
 2
2
 0
0
Recommended theme posts
Related Articles
Display Advertising Effectiveness Analysis: A Comprehensive Approach to Measuring Its Impact
In this article, I will explain why you shouldn’t underestimate display advertising and how to analyze its impact using Google Analytics 4
Generative Engine Optimization: What Businesses Get From Ranking in SearchGPT
Companies that master SearchGPT SEO and generative engine optimization will capture high-intent traffic from users seeking direct, authoritative answers
From Generic to Iconic: 100 Statistics on Amazon Marketing for Fashion Brands
While traditional fashion retailers were still figuring out e-commerce, one company quietly revolutionized how U.S. consumers shop for everything from workout gear to wedding dresses