Core Web Vitals Report in GA4 and Looker Studio: A Guide to Monitoring Your Website's Page Speed Metrics
*Updated on 20/12/2023:
- Updated the script version
- added data collection for INP metric
- created tabs in Looker Studio for each metric
Core Web Vitals and other
This guide provides instructions on how to create an informative report on the loading speed of your website using GA4 and Looker Studio.
Why Monitor Website Loading Speed in GA4?
It is crucial to receive and analyze data from real users, not lab data (like in Pagespeed Insights).
But why is this important?
Because lab data doesn't truly reflect how well (or poorly) your website performs.
Example:
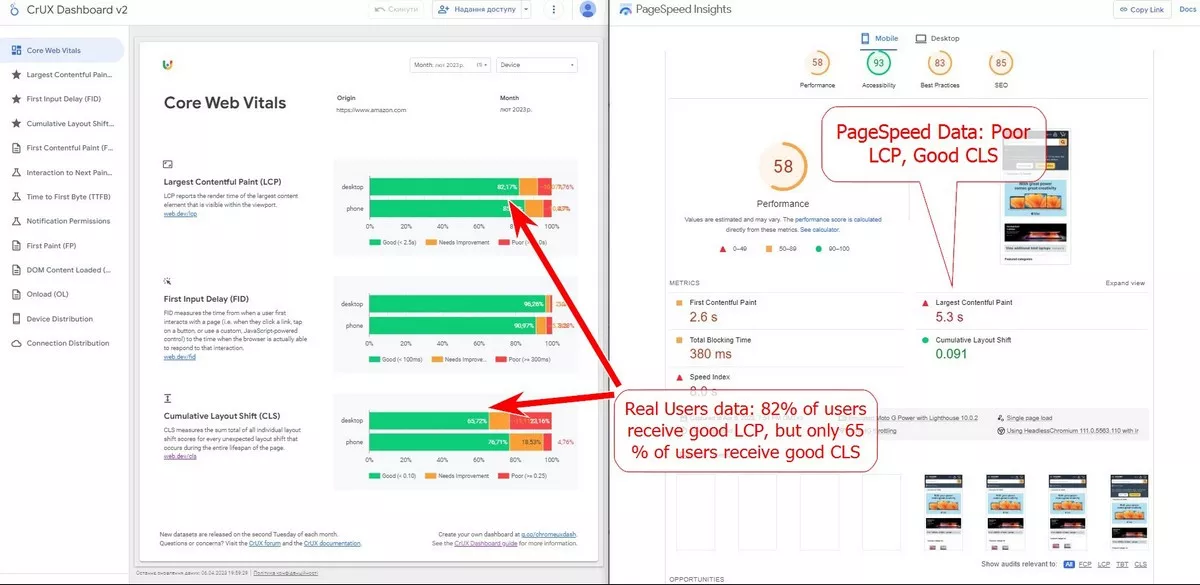
In short, lab data is just an emulation of loading one page on one device. While real user monitoring shows all the important devices and the true performance of your website as experienced by users. You can read more about the differences between lab and field data here.
What does the proposed solution involve?
- Collect data from users’ browsers using GTM, categorize it (good, bad, needs improvements), and send it to GA4.
- Then, create a report in Looker Studio based on the GA4 data.
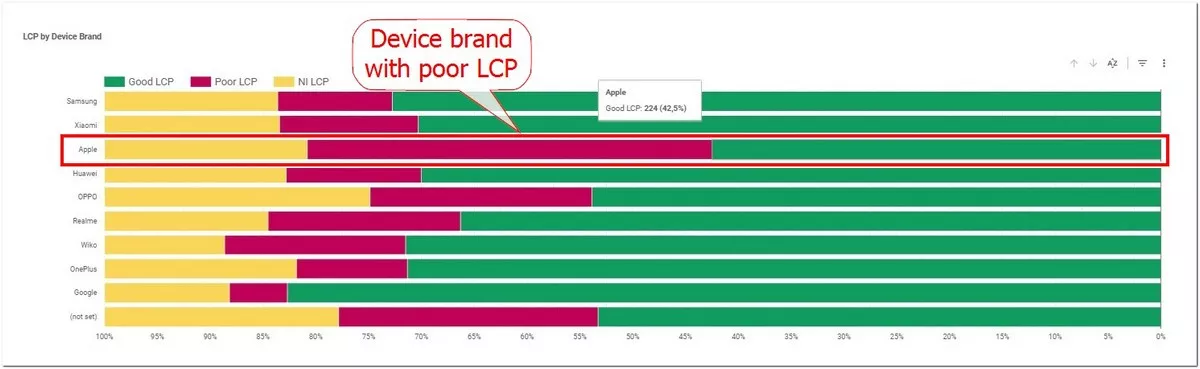
CWV report in GA4
The following data is sent to GA4:
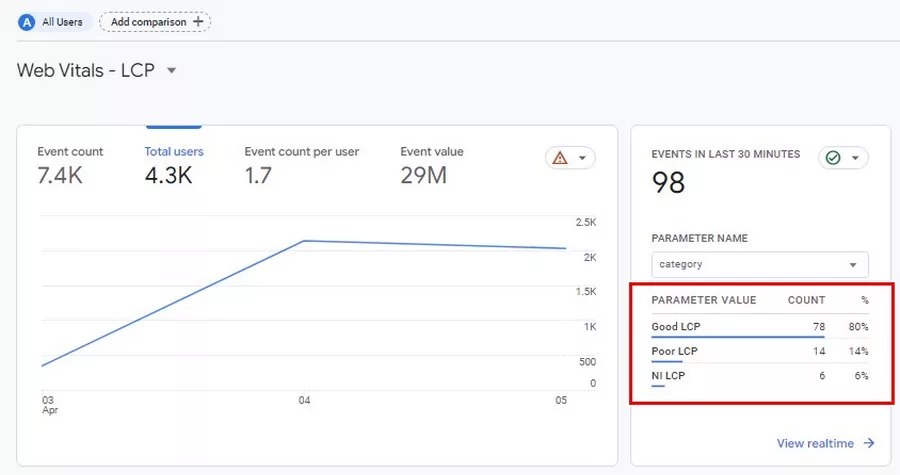
So, you can see the percentage of events in each category and compare it with other periods. For example, if Good LCP was 80% and dropped to 65%, this indicates a significant issue with your website's performance.
CWV Report in Looker Studio
Based on the data from GA4, you can create more informative reports in Looker Studio (formerly known as Data Studio).
View an example of such a report here.
This report provides a detailed breakdown of website performance:
- The total percentage of events in the Good and Poor categories.
- Changes by day and month.
- The difference on different devices, browsers, etc.
- Filtering by countries, page types, and device brands.
- Various other performance measures.
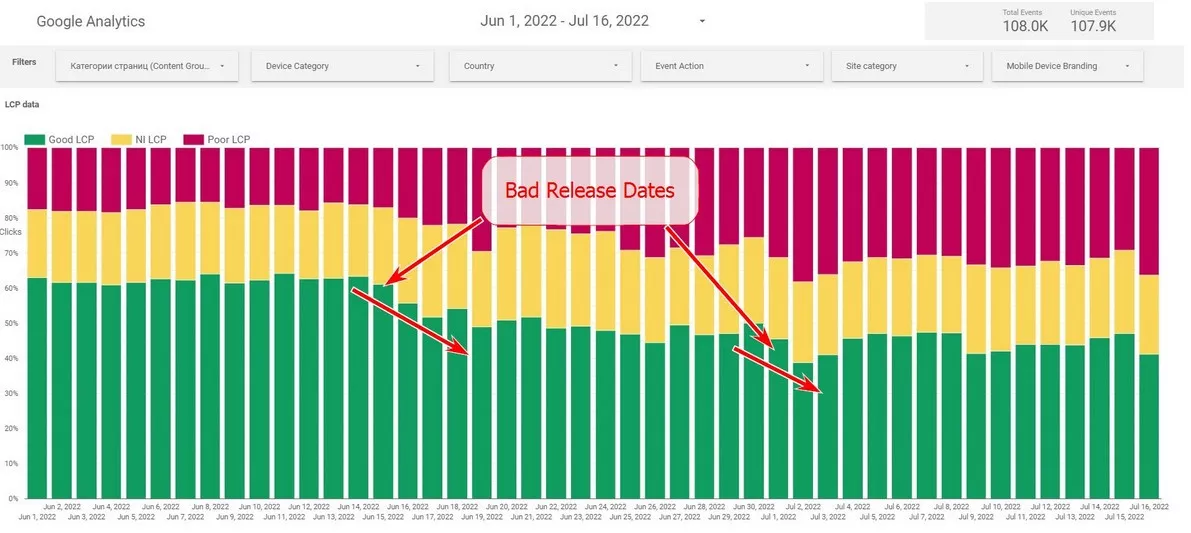
Some real-life examples of report analysis
- By analyzing changes day-by-day, we were able to pinpoint the exact date of the changes and identify the development releases causing the changes.
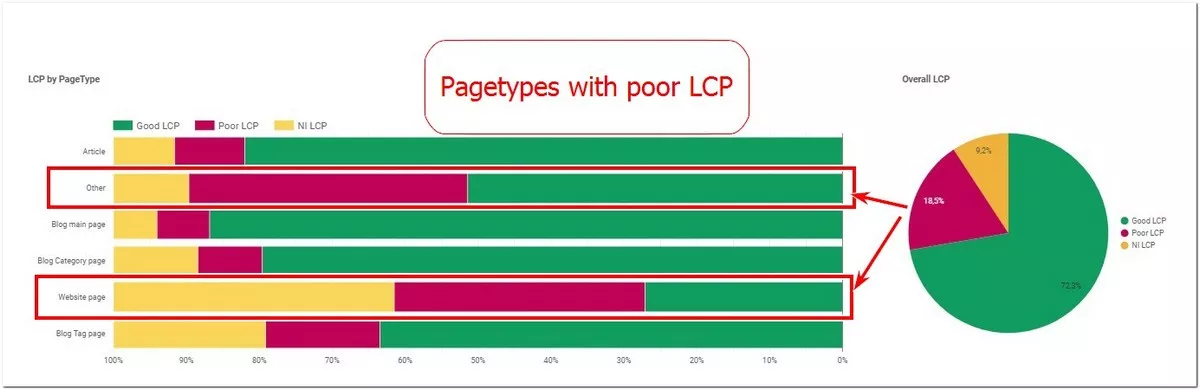
- Analysis of content groups helped us to quickly determine which type of pages had the most negative impact on overall performance!
- Analysis by device type revealed the reason for the decrease in conversions.
Do you want to create such a report?
Follow these steps:
- Import the GTM container (you can find instructions here).
- Change the GA4 ID.
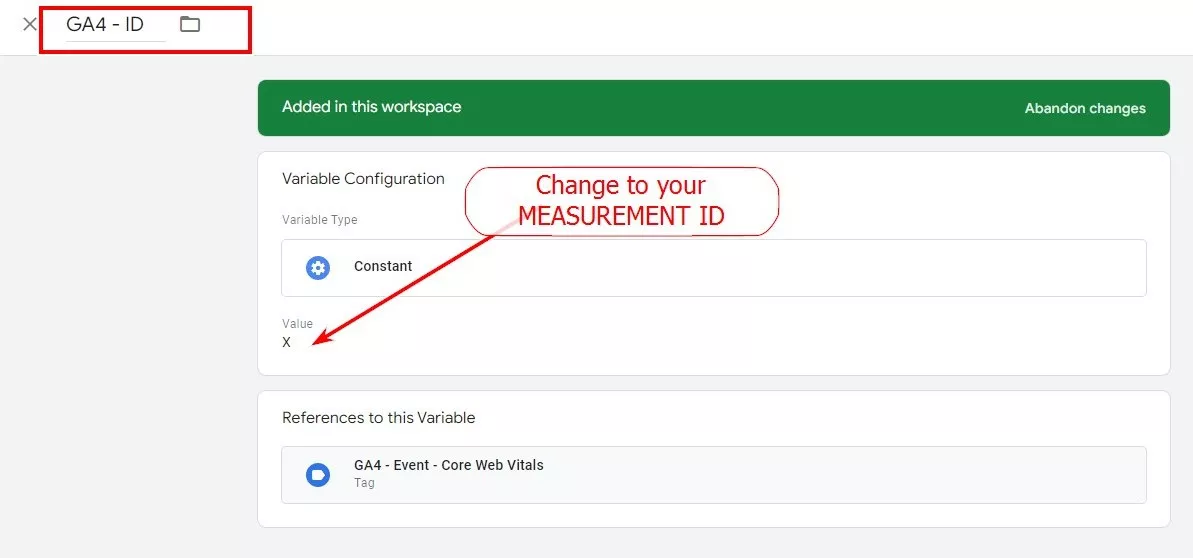
- Publish.
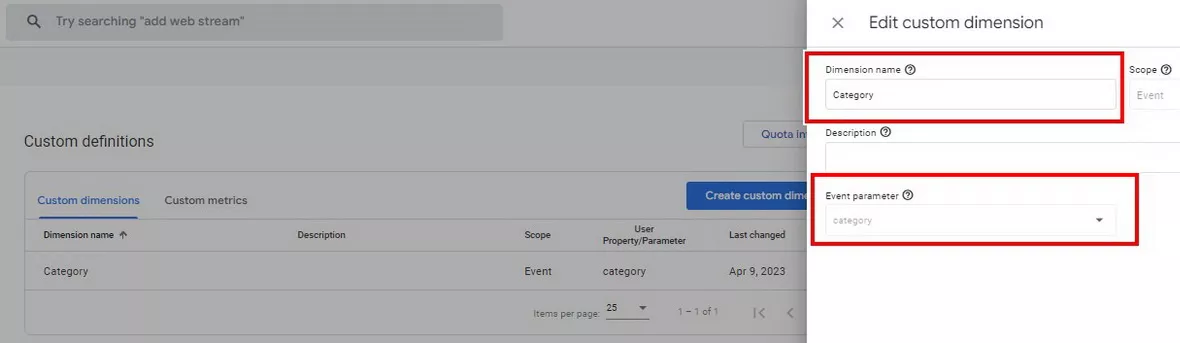
- Add it to a GA4 custom dimension named Category and link it to the event parameter.
- Copy the Looker Studio report.
- Change the data source to your GA4.
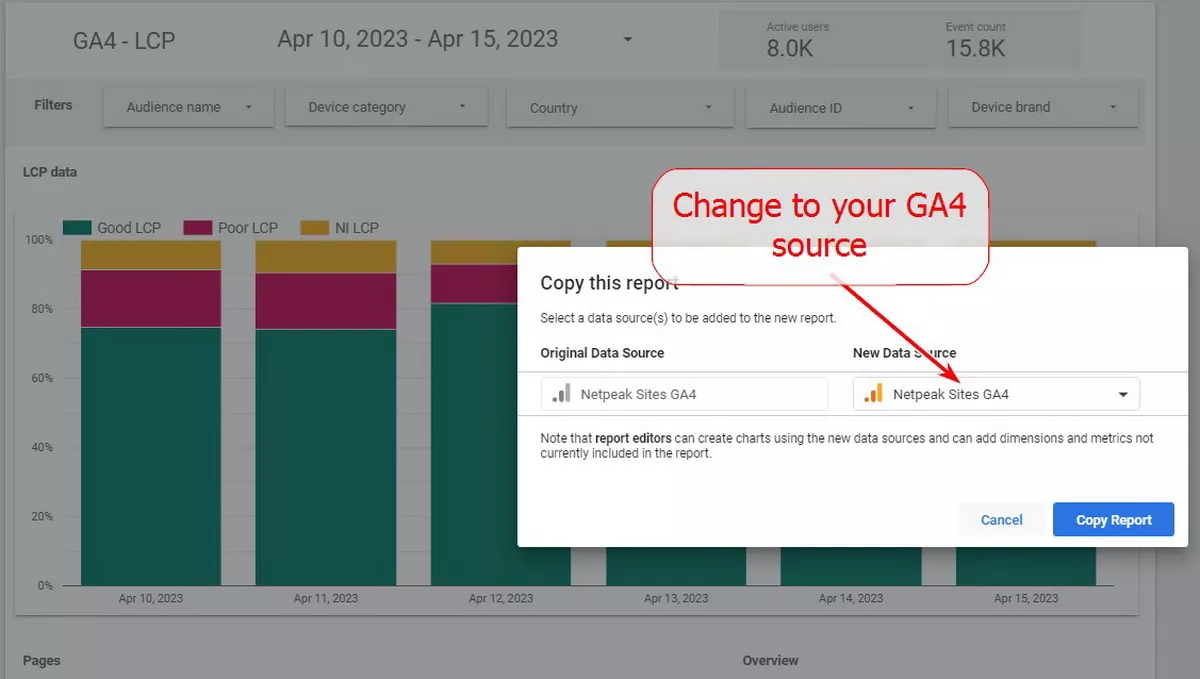
- Check if the Breakdown dimension is set correctly (must be Category).
- Wait a few days to collect data.
Who doesn't need this type of report?
A CMV report in Looker Studio is not a must. Certain businesses may not even need it. For example,
- Small business websites.
- Static websites that are rarely updated.
For these types of businesses, a standard CRUX report that is updated monthly may suffice.
Who will benefit from a CWV report in Looker Studio?
If you belong to one of these categories, such a report could be useful for your business.
- Large websites with different types of pages.
- Websites with active development.
- Websites with a diverse audience from different countries, devices, etc.
Web analytics underpins conversion optimization. What will CRO get you? Find out with Netpeak's calculator.


 2
2
 2
2
 0
0
Recommended theme posts
Related Articles
How to Set Up Consent Mode in GA4 on Your Website with Google Tag Manager
Let's explore how to properly integrate consent mode in GA4, configure it for effective data collection, and at the same time comply with GDPR and other legal regulations
Display Advertising Effectiveness Analysis: A Comprehensive Approach to Measuring Its Impact
In this article, I will explain why you shouldn’t underestimate display advertising and how to analyze its impact using Google Analytics 4
Generative Engine Optimization: What Businesses Get From Ranking in SearchGPT
Companies that master SearchGPT SEO and generative engine optimization will capture high-intent traffic from users seeking direct, authoritative answers