Display Advertising Effectiveness Analysis: A Comprehensive Approach to Measuring Its Impact
In modern marketing, the effectiveness of display advertising is often underestimated due to the difficulty of directly measuring it. Evaluating campaigns based solely on direct conversions can lead to false conclusions and unjustified budget cuts.
In this article, I will explain why you shouldn’t underestimate display advertising and how to analyze its impact using Google Analytics 4 (GA4). I will also cover the concept of associated conversions and two tools: Media Mix Modeling (MMM) and Google’s Meridian.
The rule of seven: why one digital channel is not enough
According to this marketing concept, customers typically make a purchase decision after seven interactions with a brand, particularly for expensive or significant products.
The number of touchpoints varies depending on the product type and niche.
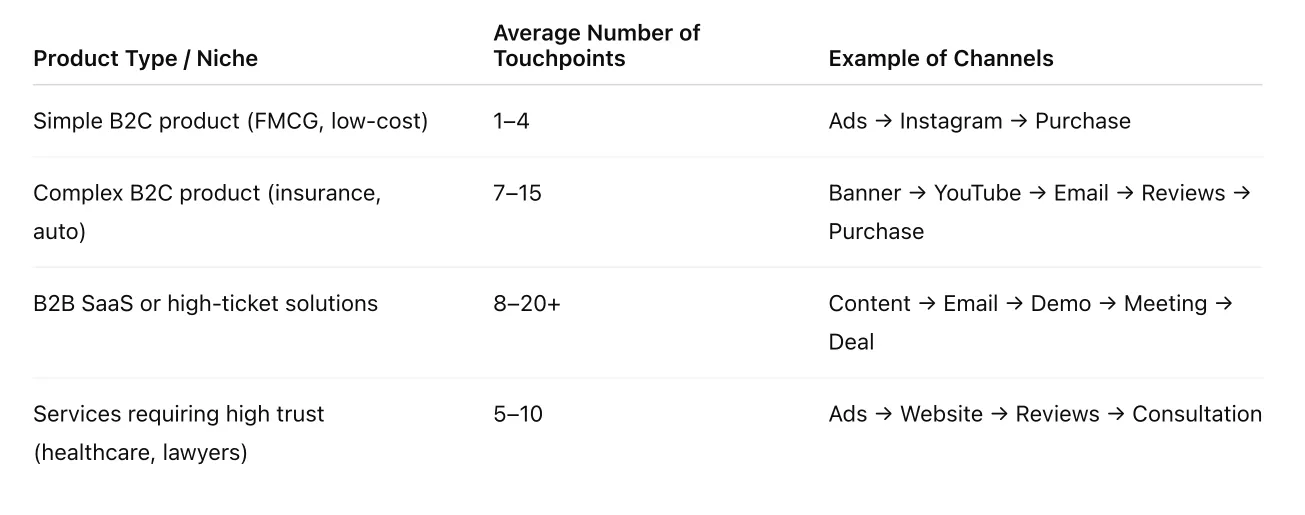
The concept works according to the following algorithm:
- Building recognition. The more often a person sees a particular brand, the more familiar it becomes.
- Growing trust. With each interaction, trust is established.
- Developing interest. This involves progressing from a simple introduction to the brand to a detailed study of the product.
- Decision making. Once all doubts are dispelled, the user is ready to convert.
This is an example of a user’s journey to making a purchase. Each point represents a subsequent contact with the brand.
- Saw a banner ad.
- Came across a mention of the brand on social media.
- Received a remarketing ad.
- Read an article about the product.
- Saw a review from a friend.
- Received an email newsletter.
- Saw targeted advertising with a promotional offer and made a purchase.
Important: Display advertising is often the first or second touchpoint. Its role is to introduce users to brands, but conversions often occur much later and through different channels.
How a combination of marketing channels enhances the overall effect
It’s important to understand that advertising channels work together to strengthen each other’s impact:
- The frequency effect. Seeing a brand across different channels increases memorability.
- The trust effect. Encountering a brand in different places increases trust.
- The confirmation effect. When a user sees an ad on YouTube, for example, and then finds the brand through a search, it confirms that they made the right choice.
Imagine that you are planning to buy a new phone. First, you see an ad on YouTube, which is the first touchpoint. Then, you Google the phone’s specifications, which is the second touchpoint. You read reviews, which is the third touch, and compare prices, which is the fourth touch. The fifth touchpoint occurs when you make the purchase.
In analytics, the conversion will either be credited to the last channel or distributed across channels. However, without the initial YouTube ad, you wouldn’t have started down that path.
Display advertising doesn’t always bring instant conversions, but it creates a foundation of information that supports other channels.
The problem with display advertising. Why is it underestimated?
There are several key reasons why display advertising seems ineffective.
- One is the focus on the last click, which ignores the complexity of the decision-making process. Attribution models typically focus only on the last interaction before conversion. However, many buyers need to interact with a brand multiple times before deciding to make a purchase.
Display advertising is often the first point of contact with a brand, yet its contribution remains invisible in traditional attribution models, which only consider the last interaction. - Technical tracking limitations are a common challenge across all channels.
These restrictions apply equally to display and performance advertising. However, display advertising is more affected due to its role at the top of the funnel.
- Cookie deletion: Users can clear or block cookies through their browsers.
- There are also cross-device tracking issues. It is challenging to track a single user’s actions across multiple devices.
- Users can also use incognito mode. This limits the collection of information about user actions.
- Incorrect UTM tag configuration can lead to the loss of traffic source data.
I will discuss these limitations in more detail below.
- Brand influence. Display advertising primarily builds brand recognition and loyalty rather than generating immediate sales.
The absence of direct conversions in reports does not indicate ineffectiveness. It is worth paying attention to other metrics.
The concept of associated conversions
Conversions rarely occur after the initial contact with an advertisement. For example, a user may see a banner ad, click on a search ad, visit the website, leave, and then return a few days later to make a purchase.
An associated conversion is a conversion in which a particular channel was involved but was not the last one before the final action. In other words, the channel contributes to the process, but does not receive direct "credit" (value) in the traditional attribution model.
Why are associated conversions important for display advertising?
Display advertising often serves as the initial point of contact with a brand or the channel that maintains user interest. At the same time, however, the user may convert through another channel, such as direct traffic (when the user visits the site without going through other channels) or search. Without understanding associated conversions, you may mistakenly believe that display advertising is ineffective.
Assisting channels are often underestimated because their contribution is not visible in standard analytics.
How to analyze user paths in GA4
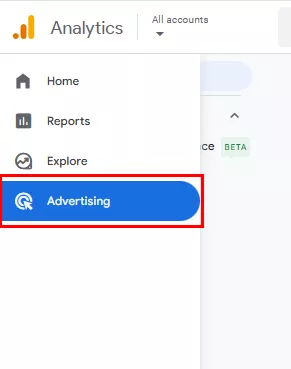
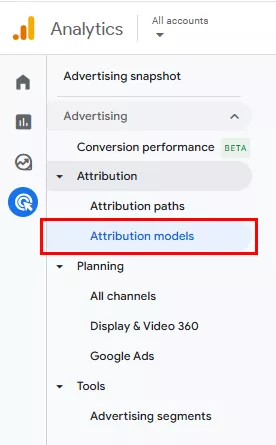
Use the Attribution paths report to do this.
- In the left menu, click Advertising.
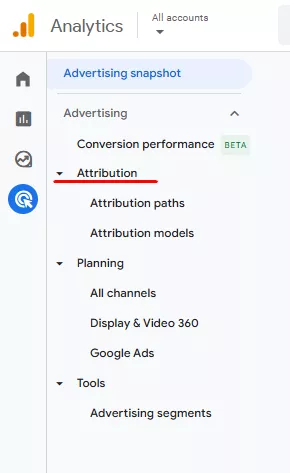
- Find Attribution.
- Select Attribution paths.
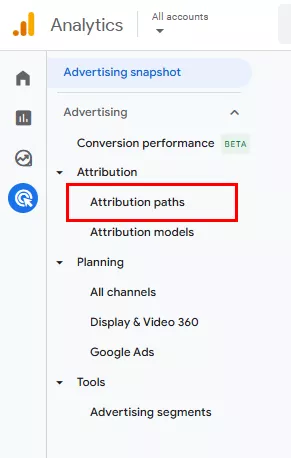
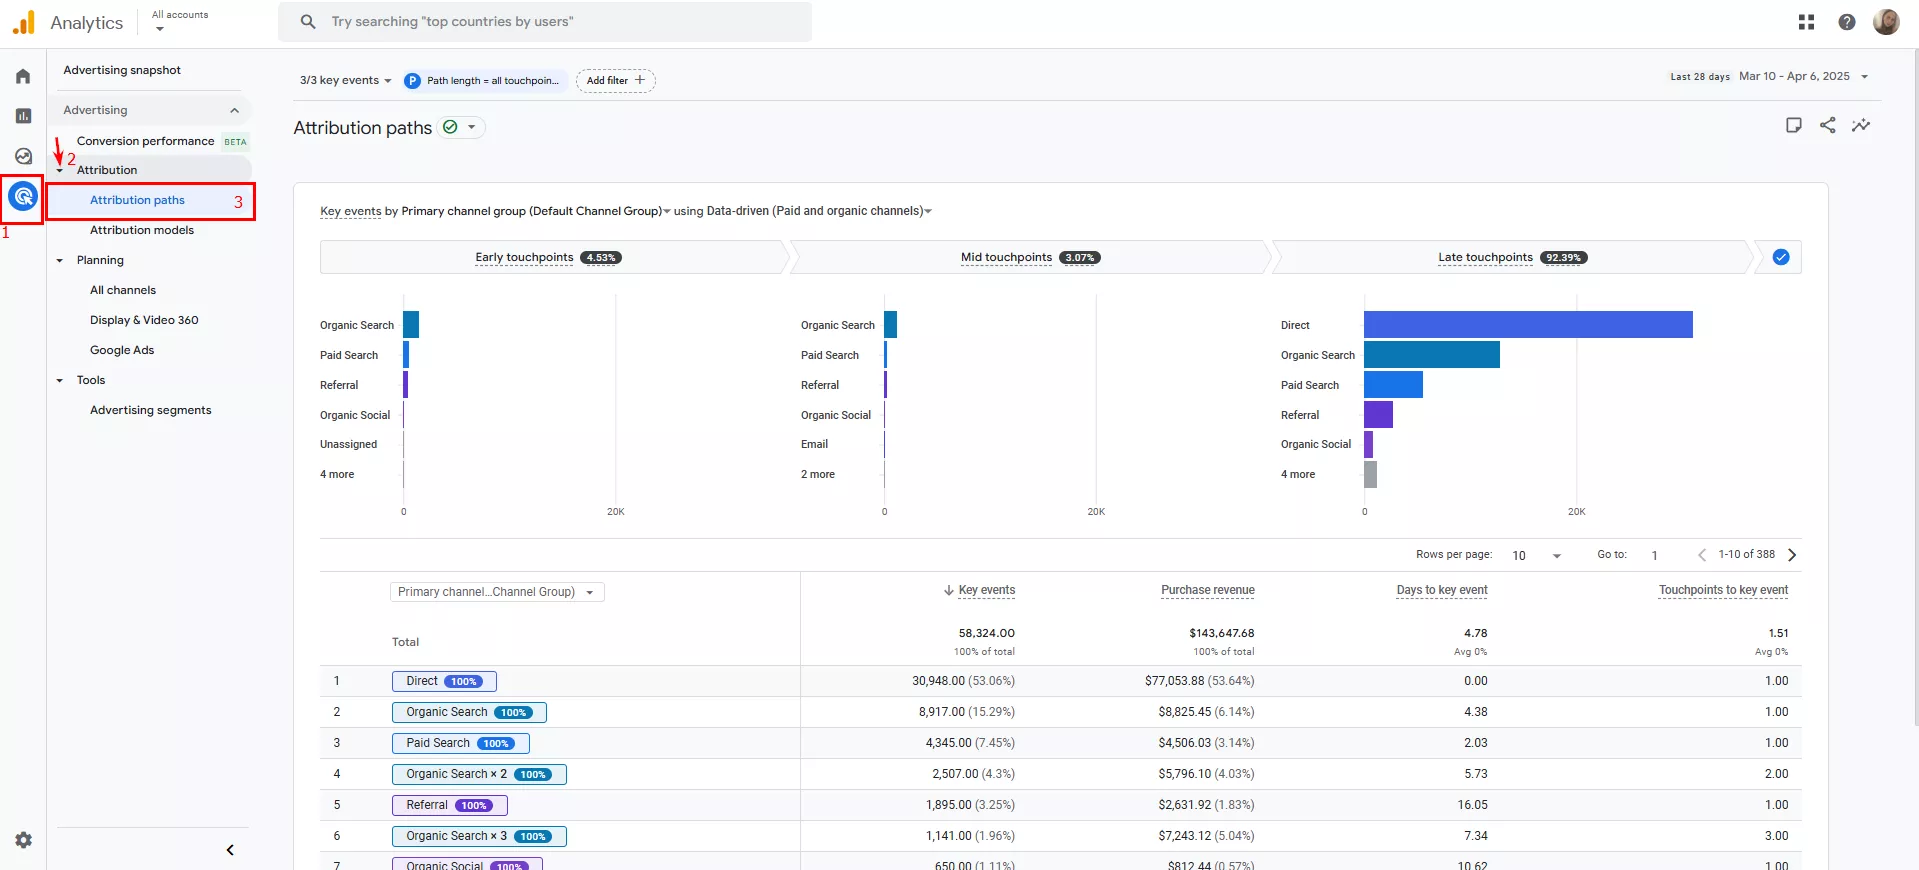
- Here, you can see which channels the user went through before converting.
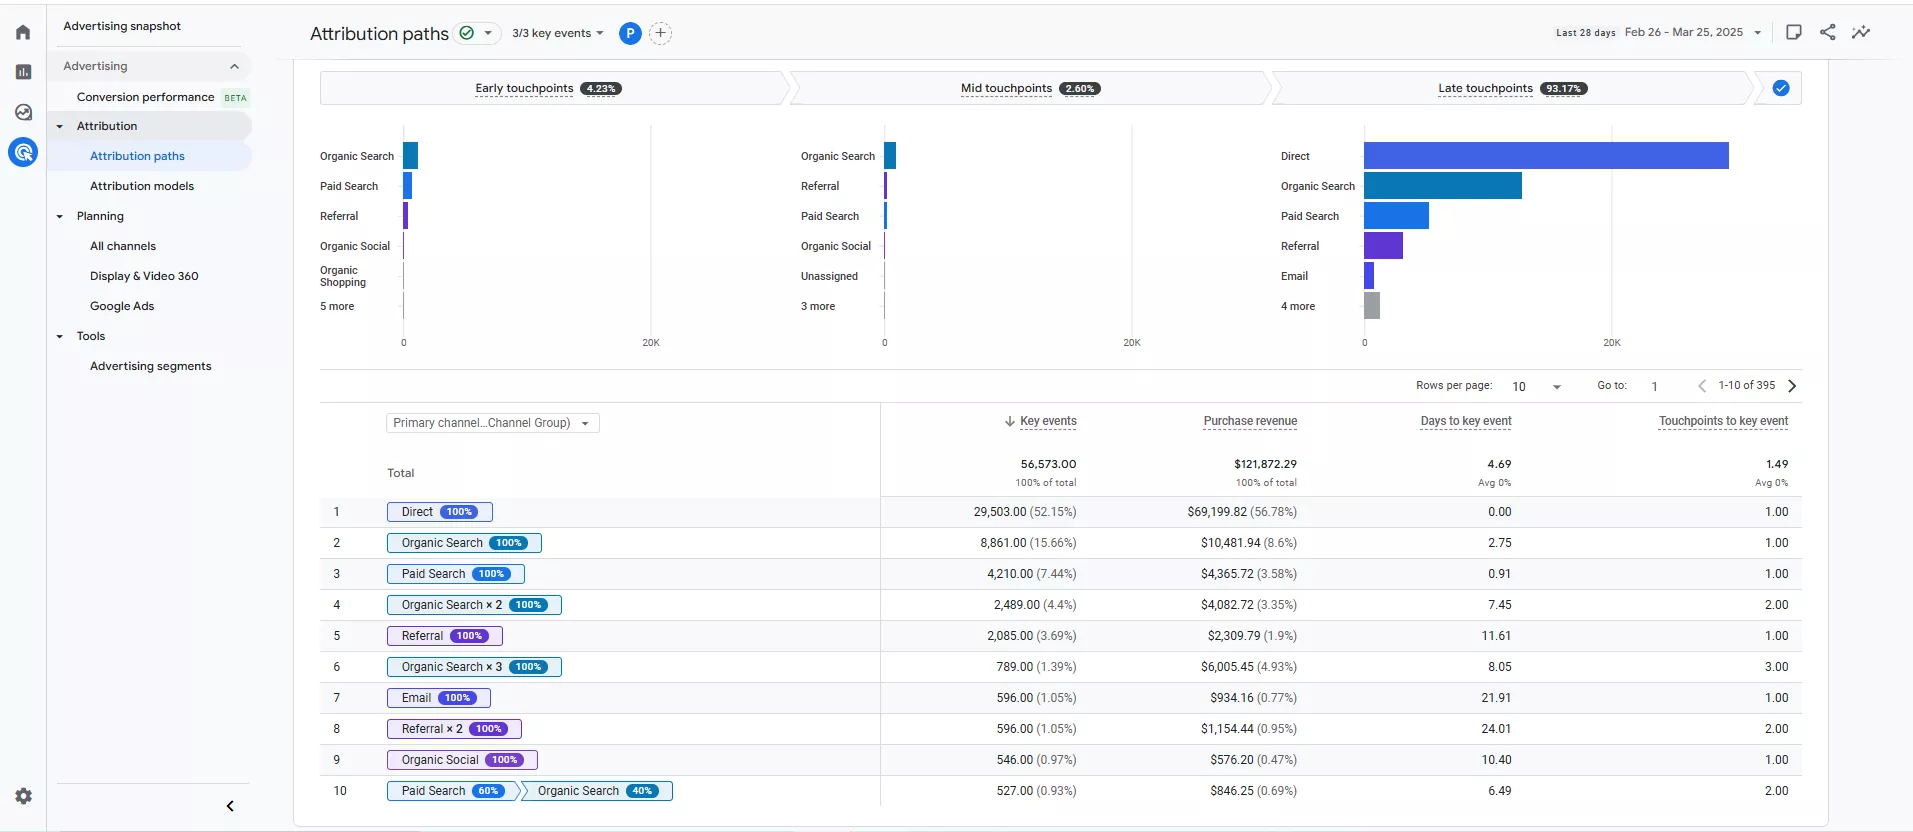
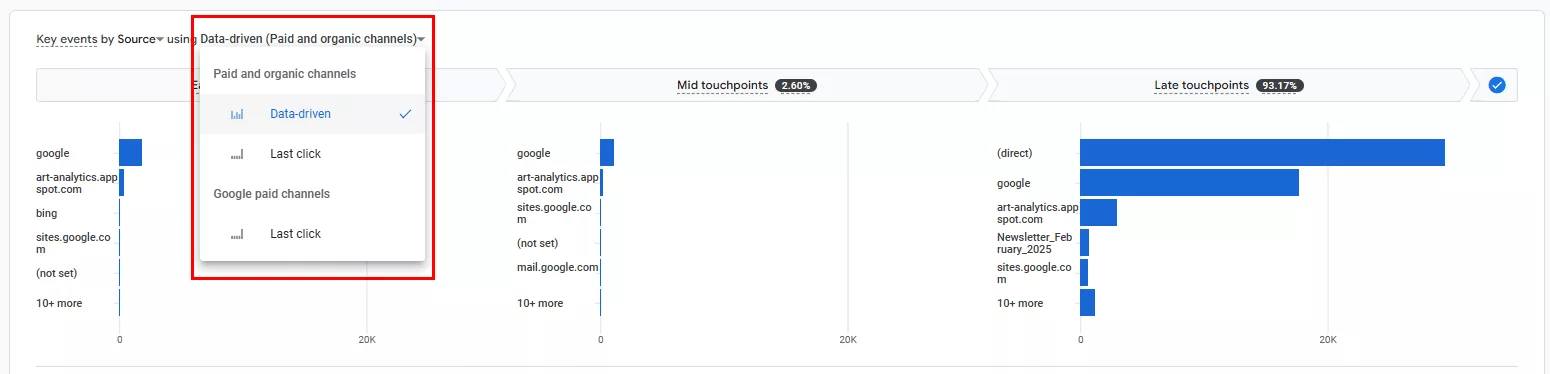
A combination of channels, such as Paid Search → Organic Search, illustrates the stages users go through before making a purchase.
Organic Search x3 means the user visited the site three times through organic search before converting.
You can change the data grouping parameters: source and medium.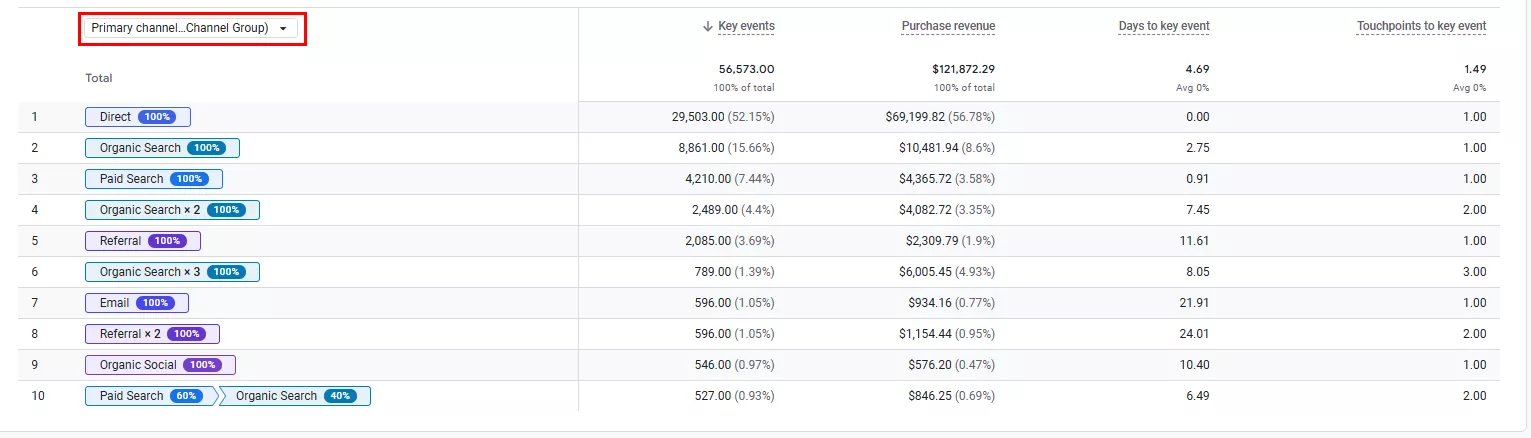
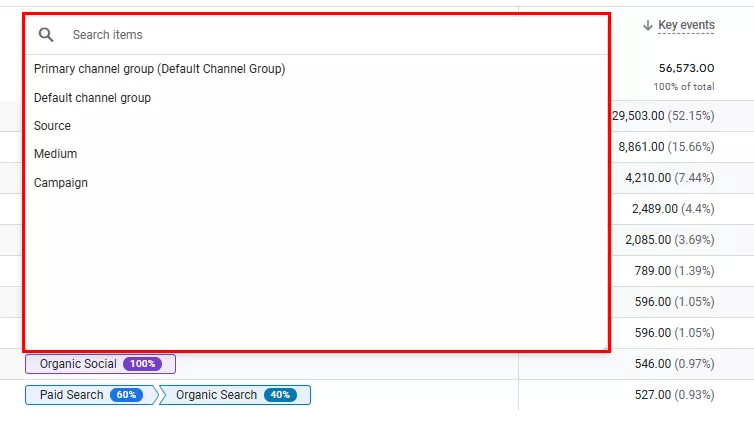
In addition to the grouping method, you can select an attribution model. This is a method of distributing value among the channels that influenced the conversion.
Attribution models in GA4
Google Analytics 4 (GA4) supports several attribution models that determine how conversion value is distributed across different channels. Below is a brief description of the main models available in GA4 reports. You can read more about all the models in the Google Help Center.
|
Data-driven |
Value is distributed based on the results of each conversion event. The algorithm evaluates the effectiveness of each click using information from your account. GA4 uses machine learning to determine the contribution of each channel. |
|
Last click (Paid and organic channels) |
Direct traffic is not considered, so 100% of the conversion value is assigned to the last channel where the user clicked the ad before converting. |
|
Last click (Google paid channels) |
One hundred percent of the conversion value is attributed to the last Google Ads channel on which the user clicked before converting. |
Unfortunately, GA4 no longer allows direct comparison of the first-click model, in which all value is assigned to the first channel, and the linear model, in which value is distributed evenly across all channels. Use the raw data export to BigQuery to create your own attribution models.
Let’s model the situation.
- A user saw an ad on Telegram or YouTube.
- Three days later, they searched for the brand on Google.
- A week later, they visited the website via Facebook.
- Then, after receiving an email newsletter, they finally placed an order.
Important: with the last click attribution model selected, the conversion will be attributed to email. However, without Telegram or YouTube at the beginning of the journey, it would not have happened.
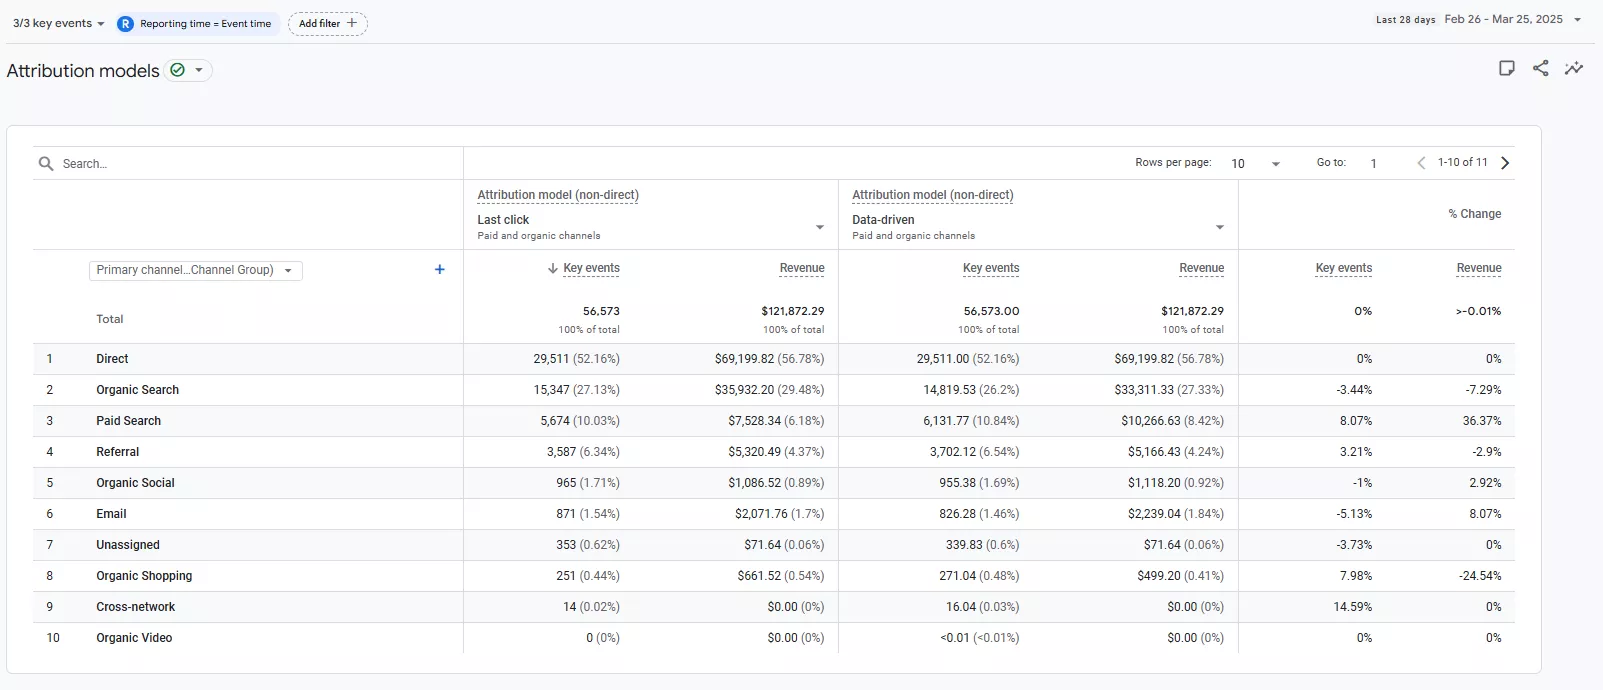
The Analytics section includes an Attribution models report. Here, you can compare the different models.
How to compare different attribution models in GA4?
Follow these steps:
- In the left menu, go to Advertising.
- Find Attribution.
- Select Attribution Models..
Compare different attribution models and quantify how the conversion rate changes depending on the model used.
Why doesn’t the channel appear in the chain, yet still affect conversions?
This can happen for several reasons.
- Cross-device issue. For example, a user may see an ad on their phone and then make a purchase on their computer, but the system may be unable to link these sessions.
- Deleted cookies. The buyer may have cleared their browser history or be using incognito mode.
- Problems with UTM tags. Incorrectly configured UTM parameters lead to incorrect channel identification in analytics.
- Direct transition. The user remembered the URL and entered it into the browser.
How to prove the impact of “invisible” channels?
Not all channels are easy to track using standard attribution. For example, display advertising and offline activities often have an indirect impact. Here are a few ways to identify their effectiveness:
- Brand query analysis. Assess the impact of advertising campaigns on demand and brand awareness. Track changes in the number of brand queries in search during a display advertising campaign.
- Direct traffic analysis. Record the growth in direct traffic after launching a display advertising campaign.
- A/B testing. A drop in conversions from other channels after turning off advertising indicates its impact on the overall result.
Case Study. When analyzing the impact of YouTube advertising, the client does not view YouTube as a means of achieving conversions. However, after disabling these ads for a week, conversions from searches decreased by 30%. This clearly demonstrates the impact of YouTube display advertising on overall results.
Methods for analyzing the effectiveness of display advertising
Since display advertising cannot typically be tracked directly, indirect methods must be employed.
- Organic traffic and brand search analysis:
- Organic traffic growth. An increase in organic traffic following the launch of display advertising confirms that the advertising is effectively building brand awareness.
- Brand search growth. Use Google Search Console to track changes in the number of search queries containing your brand name before, during, and after a display advertising campaign.
- Direct traffic analysis:
- An increase in direct traffic may indicate that users who have seen display advertising remember the brand name and later enter it into their browser. An increase in direct traffic after launching display ads is an important indicator of their effectiveness.
- Phone number tracking:
- Use a unique phone number for advertising to track calls from this channel.
- Implement unique promo codes in display advertising to track conversions in GA4.
Why organic growth is proof of the effectiveness of display advertising
One of the most important indicators of the effectiveness of display advertising is growth in organic traffic. Here’s why:
- A user sees a display ad on YouTube, for example.
- They remember the brand or product name.
- Later, when they need it, they search for the brand or product on Google.
- They go to the brand or product website via an organic search.
- However, the conversion is credited to organic traffic, even though display advertising was the initial source.
How can you determine if organic traffic growth is proof of the effectiveness of display advertising?
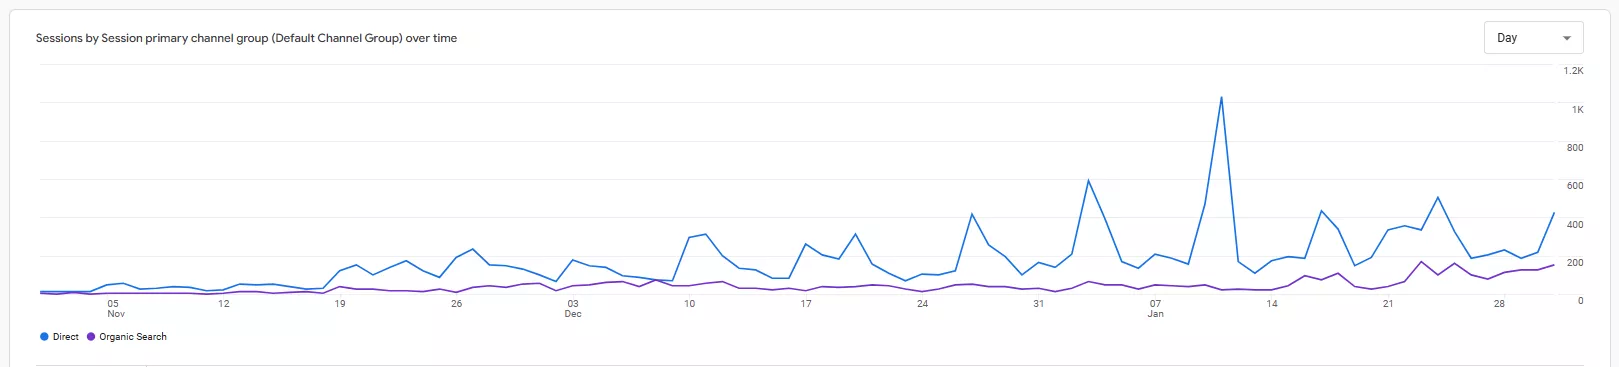
- Compare the charts of your organic traffic before and after launching a display campaign.
- Analyze search queries in Google Search Console. Brand queries tend to increase after an advertising campaign.
- Track the correlation between your display advertising budget and organic traffic volume.
Case Study. Before launching the display advertising campaign in early January, the average number of organic visits per day was ~ 200–300. After launching the campaign on YouTube around January 11, there was a sharp increase of over 1,000 organic sessions within just a few days. In the following weeks, traffic stabilized at 400–600 visits per day, almost twice the number of visits before the campaign.
This growth indicates increased user interest and potentially more brand queries.
Allow me to provide an example from my colleague Anton Hembarskyi, the Telegram Promotion Team Lead at Netpeak Ukraine.
Case Study. How Telegram Ads increased organic traffic by over 130%?
The investment group ICU approached the Netpeak team to test Telegram Ads as a new tool for increasing brand awareness and promoting domestic government bonds (DGP).
Due to Telegram’s restrictions on promoting government products, we redirected the campaign to the online.icu landing page and engaged an additional channel and chatbot. In seven months, the campaign received over 5.3 million impressions at an average cost per click (CPC) of €0.3.
Most importantly, organic traffic to online.icu increased by 135.76%, and to the main website, ICU.ua, by 47.77%. This indicates that users who saw the ad searched for the brand on Google, and the media campaign triggered these interactions.

15.08.2024 – 15.09.2024, before Telegram Ads

15.02.2025 – 15.03.2025, during Telegram Ads
The absolute increase in organic traffic, which increased by 2,536 sessions, represents a 135.76% increase.

15.08.2024 – 15.09.2024, before Telegram Ads

15.02.2025 – 15.03.2025, during Telegram Ads
There was an absolute increase of 1,607 sessions in organic traffic, which is a growth of 47.77%. Additionally, the share increased from 7.41% to 42.88% (+35.47 points).
This case study shows how display advertising can influence long-term organic growth, even without direct traffic in analytics.
Advanced methods of display advertising analysis: MMM and Meridian
Media Mix Modeling (MMM) is a method of analysis that helps evaluate the impact of different media channels on sales and other key performance indicators. MMM enables you to evaluate the influence of various media activities, such as Google Ads, Telegram, and TV, as well as non-media factors, including economic conditions, seasonality, and promotions, on the final results. MMM is a barometer for your marketing strategy.
Here’s how the method works:
- First, you collect data on all advertising channels, such as YouTube, Telegram, Facebook, and Google Ads.
- This data is then uploaded to a model that analyzes each channel’s contribution to sales.
- The results show the actual effectiveness of every hryvnia spent on advertising.
Important: The quality of the MMM results depends on the completeness of the provided data. If certain channels or variables are not considered, the analysis results may be invalid.
Unique features of MMM:
- Determines the most effective channel.
- Helps optimize advertising costs.
- Calculates the impact of external factors (e.g., seasonality, promotions).
Meridian. An open tool for MMM from Google
Google introduced Meridian, a modern, open-source tool for analyzing the marketing mix. Meridian helps companies build their own MMM models and obtain transparent data for decision-making.
What makes Meridian unique?
- It simplifies the modeling process for marketers.
- It integrates with other analytics tools.
- It uses modern statistical methods for accurate forecasting.
How MMM and Meridian help analyze display advertising
Their combination of advanced analytical methods provides unique opportunities.
- Accurately identify the most effective channels.
- Calculate the actual return on each advertisement.
- Find the optimal contact frequency with customers.
- You can also avoid wasting money on ineffective channels.
In addition to Meridian, there are other MMM tools, including Robyn, an open-source project created by Meta as part of its Open Source initiative.
Please note that MMM is not a magic button that will give you instant results. This tool requires a professional approach, time, and investment.
What is needed for implementation?
- Data history from the past 1.5 to 3 years, preferably including seasonal sales fluctuations during this period
- In-depth knowledge of statistics
- Programming skills
- A data specialist must be involved
- High development costs ($5,000 approximately)
- Complex model configuration
Conclusions
- Display advertising is a tool for building brands, not just generating direct conversions. It often serves as the initial touchpoint, working to build brand awareness.
- To accurately evaluate its effectiveness, the entire user journey must be analyzed, not just the last step before conversion.
- A combination of channels is more effective than using each channel separately.
- Channels invisible in analytics can significantly impact the final result.
- MMM and Meridian are powerful modern marketing tools. They transform advertising from an intuitive activity into an exact science, helping businesses make informed decisions.
- If you plan to use MMM, begin by collecting historical data and testing simple Meridian-based models.

 5
5
 2
2
 2
2
Recommended theme posts
Related Articles
Generative Engine Optimization: What Businesses Get From Ranking in SearchGPT
Companies that master SearchGPT SEO and generative engine optimization will capture high-intent traffic from users seeking direct, authoritative answers
From Generic to Iconic: 100 Statistics on Amazon Marketing for Fashion Brands
While traditional fashion retailers were still figuring out e-commerce, one company quietly revolutionized how U.S. consumers shop for everything from workout gear to wedding dresses
How to Rank in ChatGPT Results With Generative Engine Optimization (GEO)
The best name brands are already figuring this out, and if you want to join their ranks in ChatGPT answers, it’s time to understand how to get listed on ChatGPT and master the game of ranking in ChatGPT