Google Analytics 4 and Google BigQuery: Why Work With Raw Data and How to Set Up Its Export
One of the main advantages of Google Analytics 4 (GA4) is the ability to work with raw, i.e., unprocessed, data. GA4 makes it easy to transfer this data to Google BigQuery, perform an in-depth analysis, and use the results for marketing strategy.
In this article, I'll explain what raw data is and why it's so important, how to properly connect GA4 with BigQuery, and how this integration can help improve your analytics.
What is raw data?
Most of the time, marketers work with aggregated data that has already been processed. These include sums, averages, percentages of the total, and so on.
Raw data is the data collected from a source before processing, and it comprises records of what users do on the site or in the application. This data includes information about each user action: clicks, page views, purchases, etc.
Here are some of the things you can do with raw data:
- Choose which information to include and which not to include to calculate the metrics you want.
- Decide which summarization or averaging methods to use.
- Select parameters and metrics for calculation, including those not available in the tool interface.
- Generate reports that include data from other sources, such as a Meta Ads account or your own CRM.
Essentially, raw data allows you to dig deeper into user behavior on a website or app and create analytics reports tailored to your business.
Why is it important to work with raw data?
Aggregated data is convenient, but it has its drawbacks. Here are the most common ones.
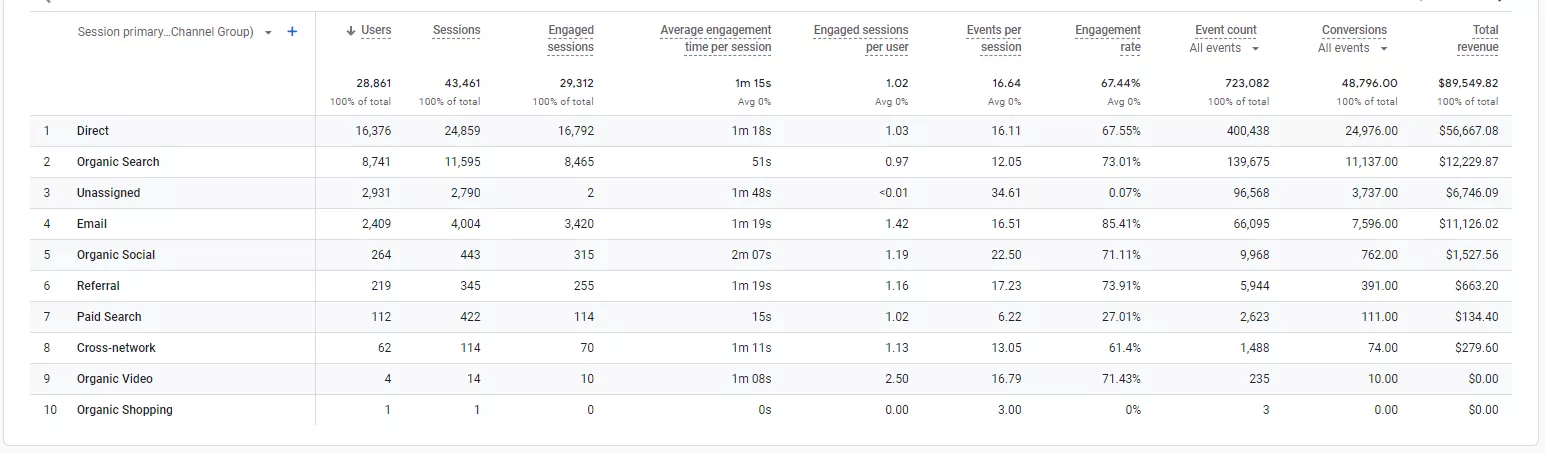
1. Sampling
When there is too much information to analyze, the system selects only a portion of the data to process. This is like trying to find out what people worldwide like to eat for breakfast by surveying people from only a few countries. You run the risk of missing important details and getting inaccurate results.
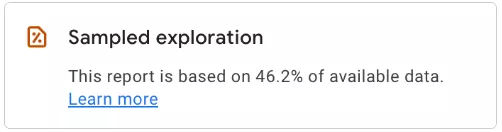
By default, custom reports in GA4 are sampled when you analyze more than 10 million events.
2. Data thresholds
GA4 uses data thresholds to protect user privacy. For example, GA4 hides demographics or interests when the number of users for an event is too small.
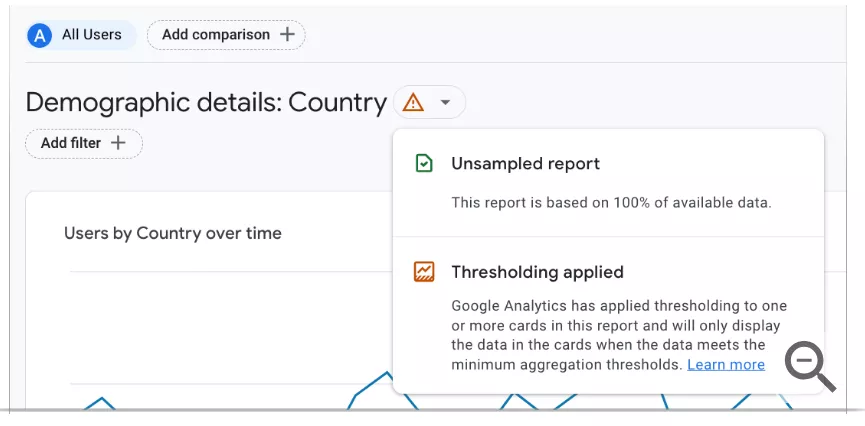
Here’s another example. When you apply a short date range that has less than 50 users, data thresholds are put in place. They minimize the appearance of information in the report that can be attributed to and therefore identify specific users.
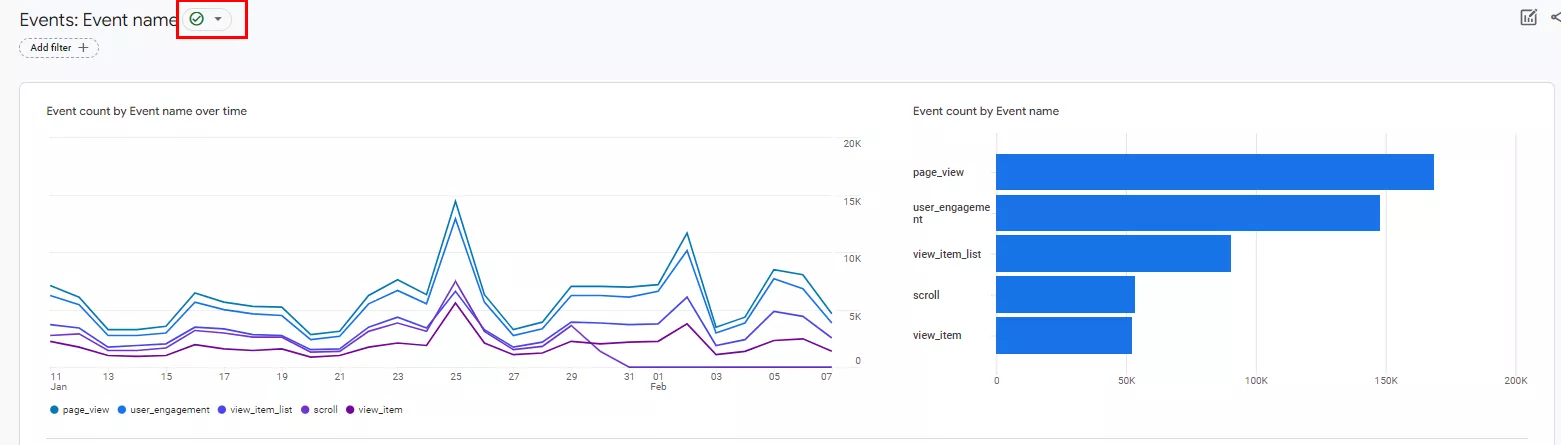
If you see a green check mark next to “Event name”, your report contains 100% of the available data without applying sampling and data thresholds.
3. API limits
An API (application programming interface) is a set of rules or protocols that enables software applications to communicate with each other.
In GA4, you need an API to access and interact with report data for both standard and custom reports. However, when working with data through the API in GA4, there is a limit to the number of requests you can make in a given period.
For example, the maximum number of requests per day per project could be 50,000 or 2,000 requests per project in 100 seconds. This limitation could slow down data retrieval or even make it impossible to retrieve the full amount of information.
Such an error in Looker Studio means that the data quota limit has been exceeded.
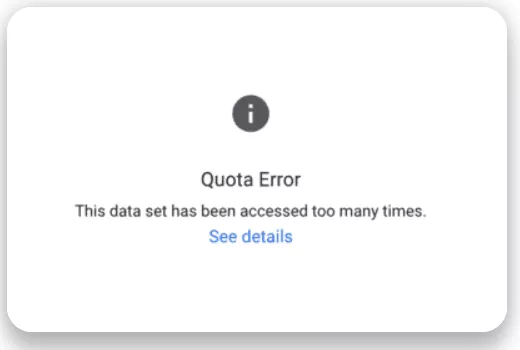
GA4 has different quotas for the standard version and the 360 version. If these limits are exceeded, data in Looker Studio won’t be visualized before the time set by the quota expires.
4. Missing client IDs
When using an API to retrieve data from GA4, there is no Client ID information. This makes it difficult to track the behavior of specific users and analyze their interaction with a product or service.
5. Google Analytics limitations
GA4 only provides pre-built reports; it is impossible to learn anything beyond them.
Even if there are tools to create your own reports, they will still be limited by the analysis system. And you won’t always get all the information you need, especially if you have specific requirements.
6. Business process limitations
Raw data is crucial in industries where transactions take time, such as real estate or industrial machinery. Without raw data, it would be difficult to understand which advertising channels are delivering the most value and which are paying off.
The transaction cycle in such industries is not just online, and the buyer decision process is time-consuming. They may use multiple channels to research a product or service and take several steps before making a transaction, making it difficult to determine which channel has attracted more customers.
Raw data provides a more accurate and complete analysis, allowing you to uncover hidden trends and gain a deeper understanding of customer behavior.
Explore our glossary for essential web analytics definitions to sharpen your data insights!
Advantages of working with raw data
- Flexibility and in-depth analysis. Raw data allows you to customize reports and web analytics to meet your business needs.
- Custom reports. You can select the parameters you want, customize filtering and data as needed, and create custom metrics (e.g., session time, time a user spent on a particular page) and reports. GA4 does not always combine the metrics and parameters you are interested in into one report.
- More accurate metrics. Raw data minimizes the loss of information during aggregation.
For example, if a page was viewed by only a few users because the channel had low traffic, GA4 will hide this information, while raw data will show it. - Historical data retention. Long-term data storage allows you to analyze and compare long periods of data. In GA4, it is possible to create custom reports only for the last 14 months.
- Integration with other sources. Uploading raw data to the storage facilitates integration with other data sources, such as CRM systems or external databases. This way, the data is compiled in one place, making it easier to analyze.
The importance of centralized data storage for businesses
When a company has access to centralized marketing data in the cloud, it can easily implement the following tasks:
- Reverse ETL. Move data from the storage back into operational systems, such as CRM or order management systems, to use it for personalized communications with customers.
For example, sending customers a notification about a product discount or suggesting items that complement their previous purchases. - Segmentation. Create groups of customers based on different characteristics and behaviors for more targeted marketing and service.
- Prediction. Predict future trends and outcomes by analyzing historical data to optimize sales and marketing strategies.
- Marketing mix modeling. Analyze the impact of different marketing channels on final sales results. This will help optimize marketing campaign budgets.
Disadvantages of working with raw data
Raw data requires more experience and expertise to analyze than standard Google Analytics reports. In particular, you will need to build attribution yourself.
Attribution is the process of assigning a value to individual actions, which lead to certain outcomes, from different marketing channels..
But when you let the experts do the work, this disadvantage becomes an advantage. You'll have a unique analytics model that effectively determines the best marketing channels to achieve your goals.
Why Use Google BigQuery?
Google BigQuery is a cloud-based data warehouse. As a powerful tool for analyzing raw data, BigQuery instantly processes massive amounts of data in real time. This allows you to quickly spot trends and dig deeper into user actions on a website or app.
Unlike similar systems that require you to deal with configuration and administration, Google BigQuery uses SQL to work with data, making it much easier to use.
In addition, Google BigQuery easily integrates with various BI tools, such as Looker Studio, Power BI, and Tableau. This makes it convenient and efficient to visualize and process data.
Google BigQuery pricing
GA4 provides free data export to Google BigQuery for all users. Fees are only charged for actual data storage and when the free usage limits in Google Cloud are exceeded.
The fee is charged to your credit card when you reach a threshold of 1 TB of queries per month and 10 GB of storage (10 GB of data ≈ 6 million GA events).
Upon registration, the user will receive $300 to pay for the service, which is valid for 90 days. See Google Help for more details on the terms and conditions.
Google also offers the use of BigQuery sandbox (a BigQuery testing environment) without a credit card, but the data tables are stored for only 60 days.
For example, GA4 receives 3 million events per month, which is approximately 5 GB of data. 10 GB of data is provided for free, which is enough for two months of free use. You will see the first charge after two months.
After that, the cost of 1 GB is $0.02. The project cost will be 5 GB*$0.02=$0.10. Also, the payment for historical data is added here ($0.01 per GB).
On average, smaller projects spend $1 to $5 per month for the service. There are projects where the fee for BigQuery reaches $400-1500, but the increase in charges is controlled. Larger projects with more events in GA4 and more complex data processing will naturally cost more.
How to export data from GA4 to BigQuery
Step 1: Create a project.
Create a project on Google Cloud Platform (GCP). If you already have a GCP account, create a new project. If not, sign up first.
Important: Both Google Cloud and GA4 must be registered with the same Google account. In addition, you must have an Owner role for the BigQuery project and at least an Editor role for the GA4 resource.
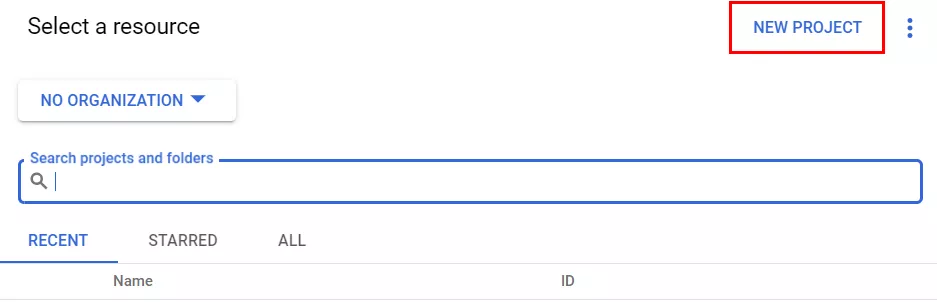
- Click the name of an existing project. If the account is new and no projects exist, you will be prompted to select a project.

- Click New project.
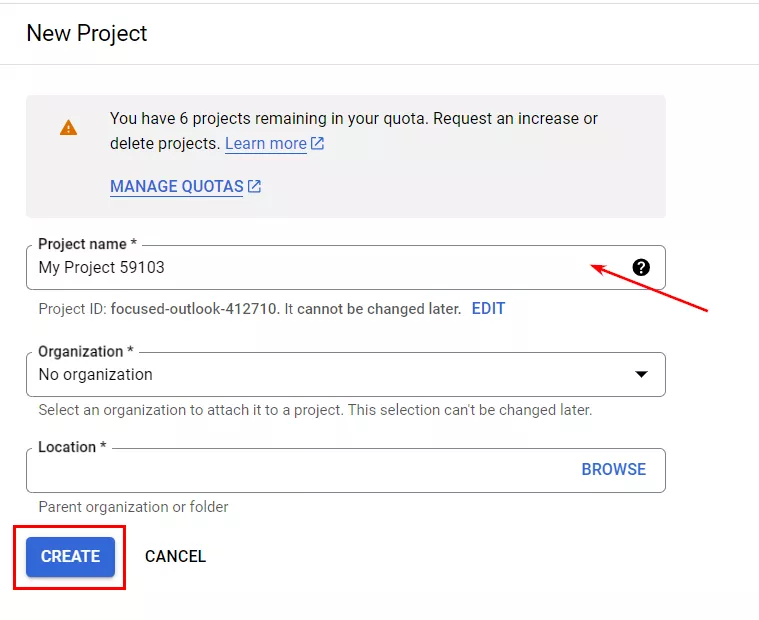
- Enter a name for the project and click Create.
Step 2: Enable BigQuery API.
Enable the BigQuery API for your project in the GCP console. This is required for GA4 to interact with BigQuery.
To do this:
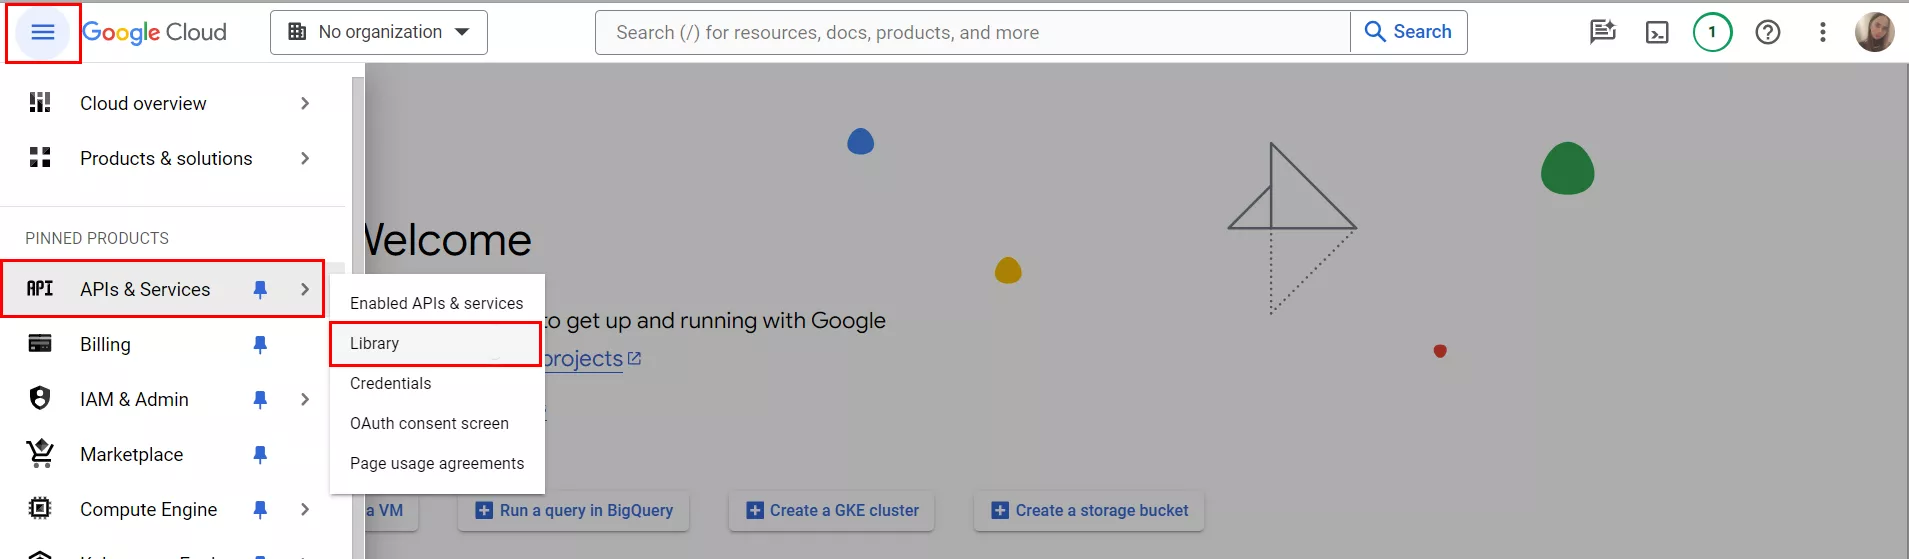
- In the left navigation menu, select APIs & Services and then Library.
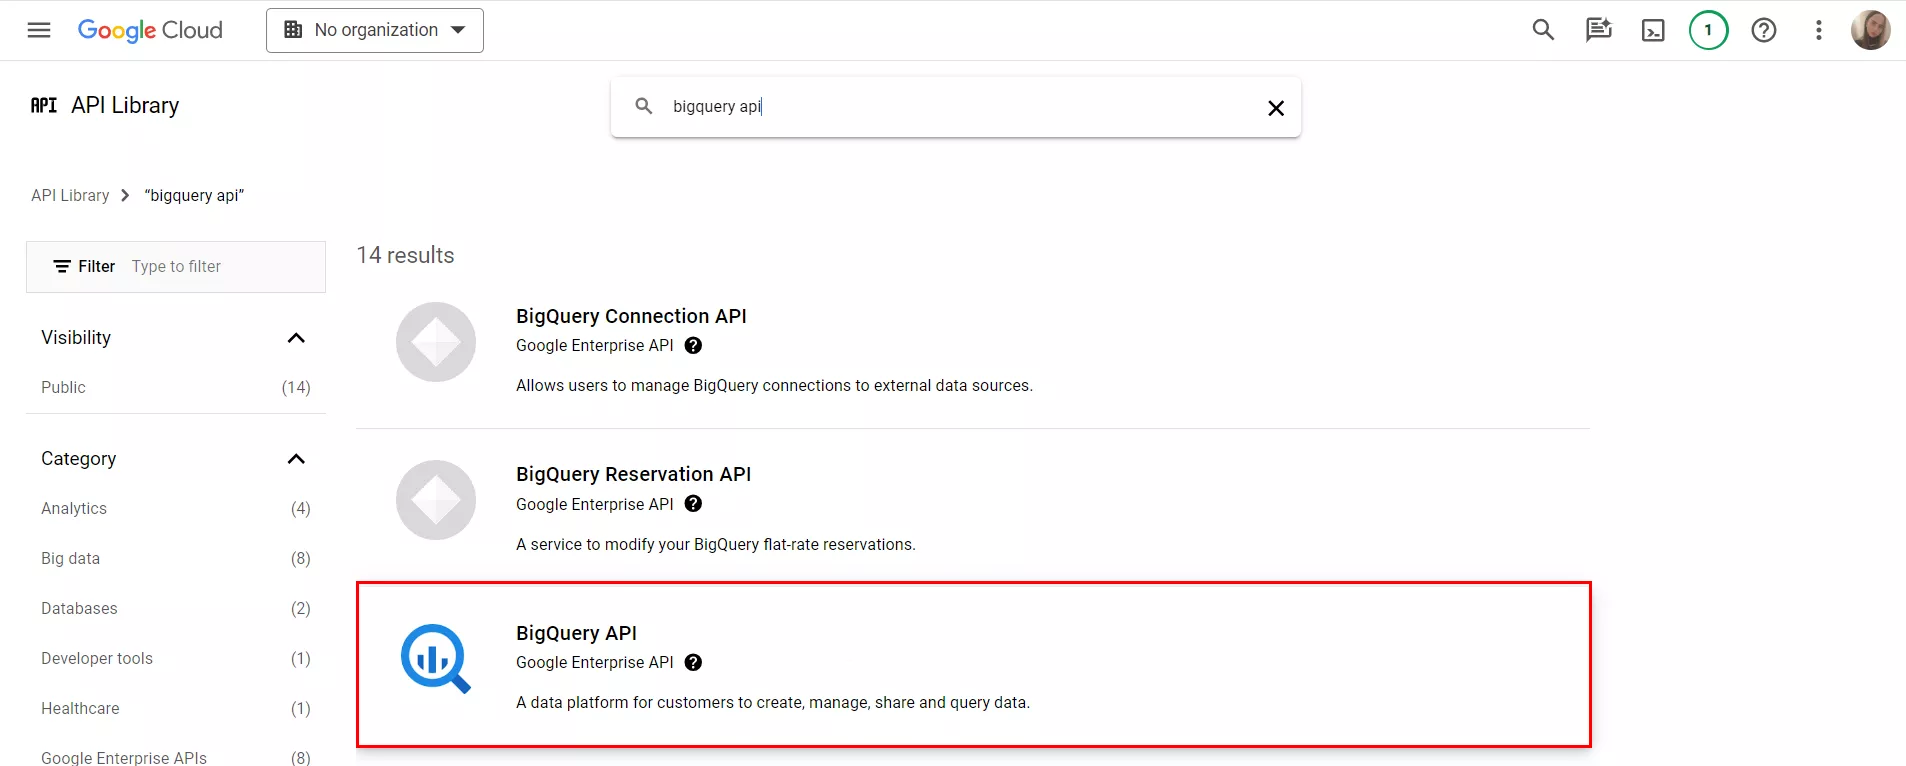
- In a new window, type bigquery api in the search box.
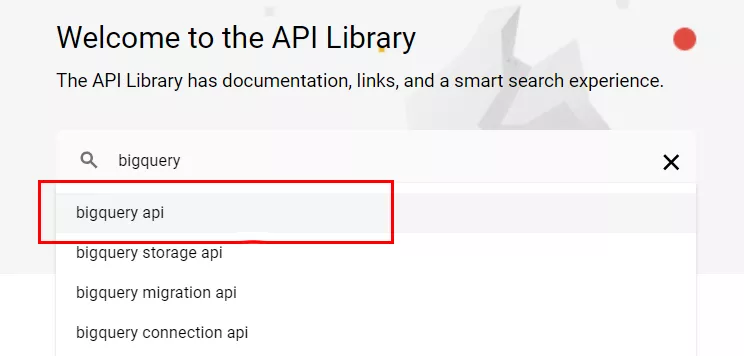
- Select BigQuery API.
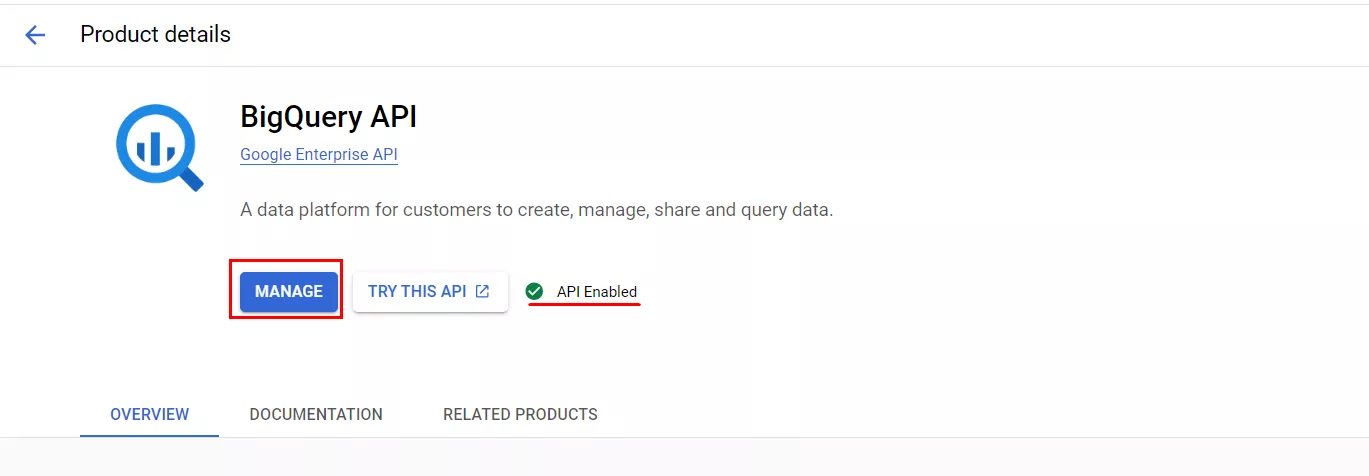
- If you have not enabled the BigQuery API service, click Enable. Make sure that the API Enabled icon turns green (this confirms successful activation). Then proceed to management by clicking Manage.
- Go to Credentials. Then click +Create Credentials > Service account.
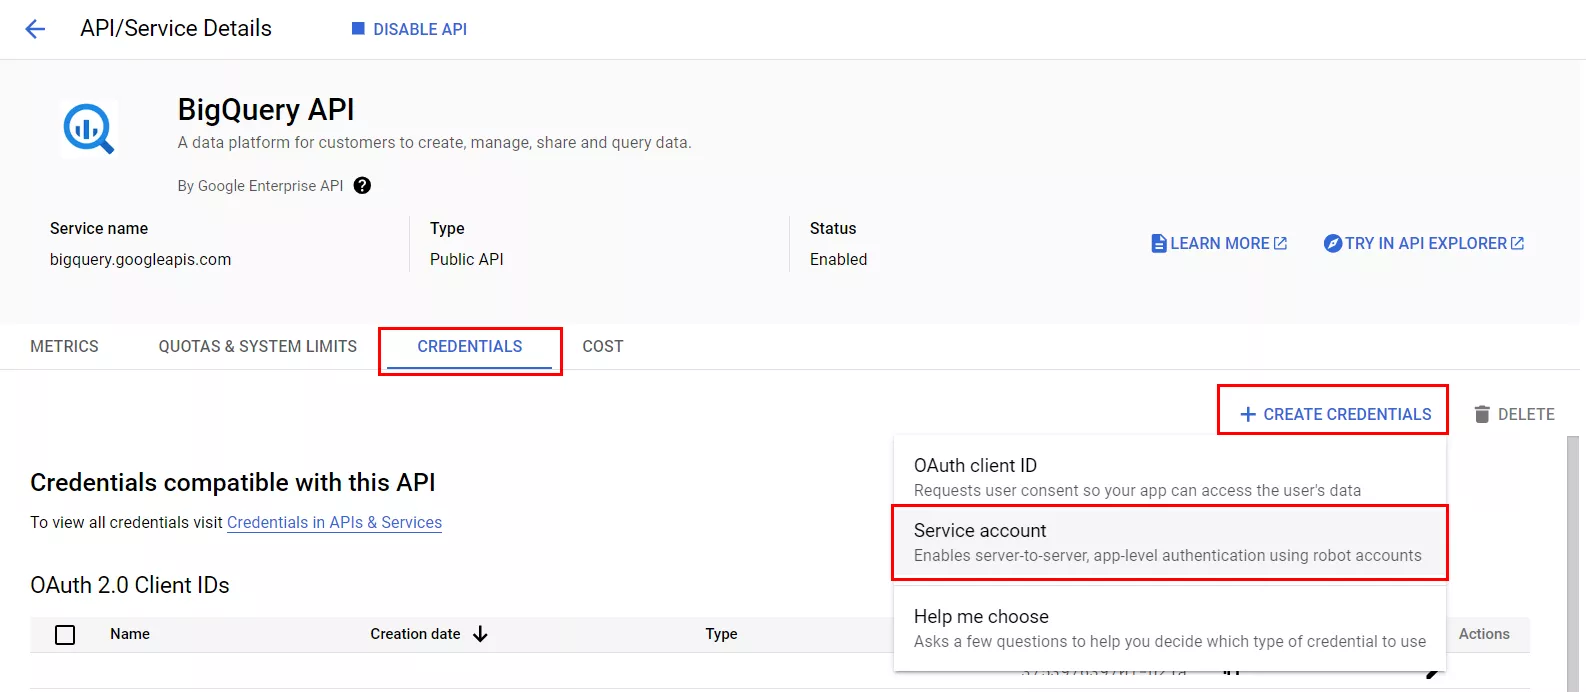
- Add the value firebase-measurement@system.gserviceaccount.com to the Service account name field and click Create and Continue.
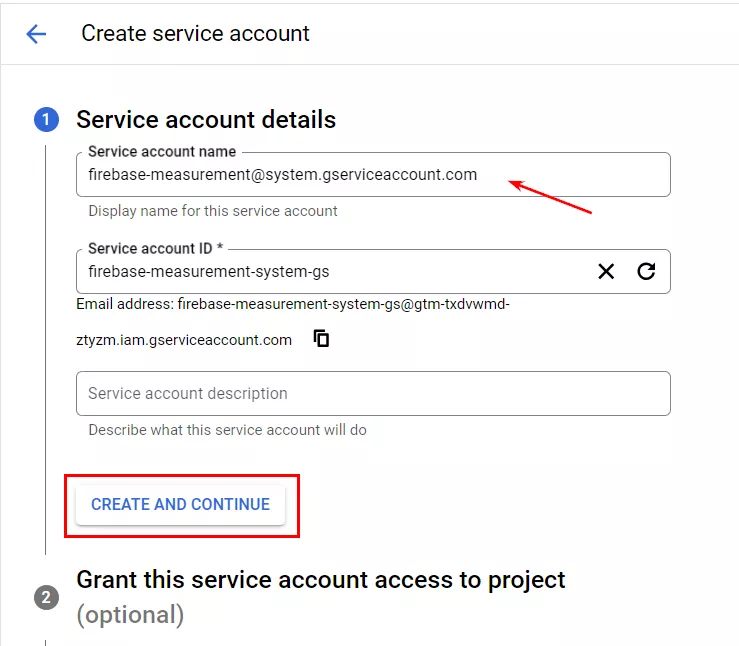
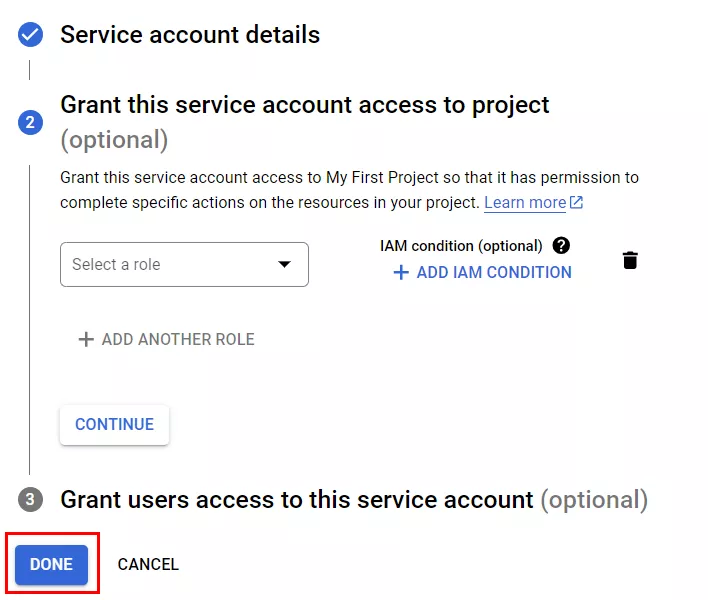
- Click Done.
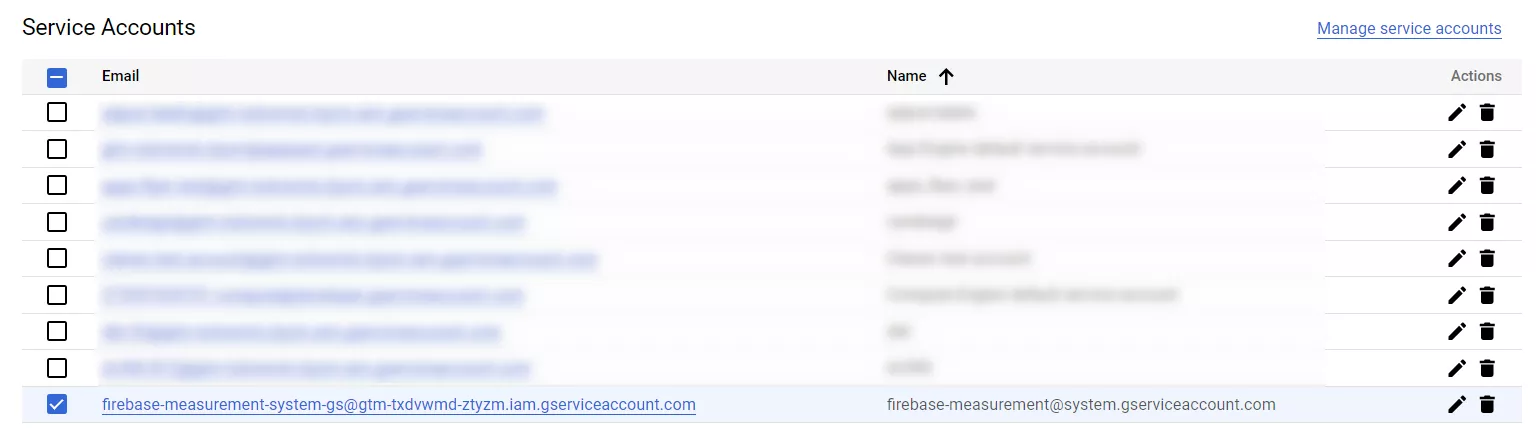
- If you have added it successfully, your service account will appear in the list of Service Accounts.
Step 3: Create a Data Stream in GA4.
Go to your GA4 account and follow the steps below:
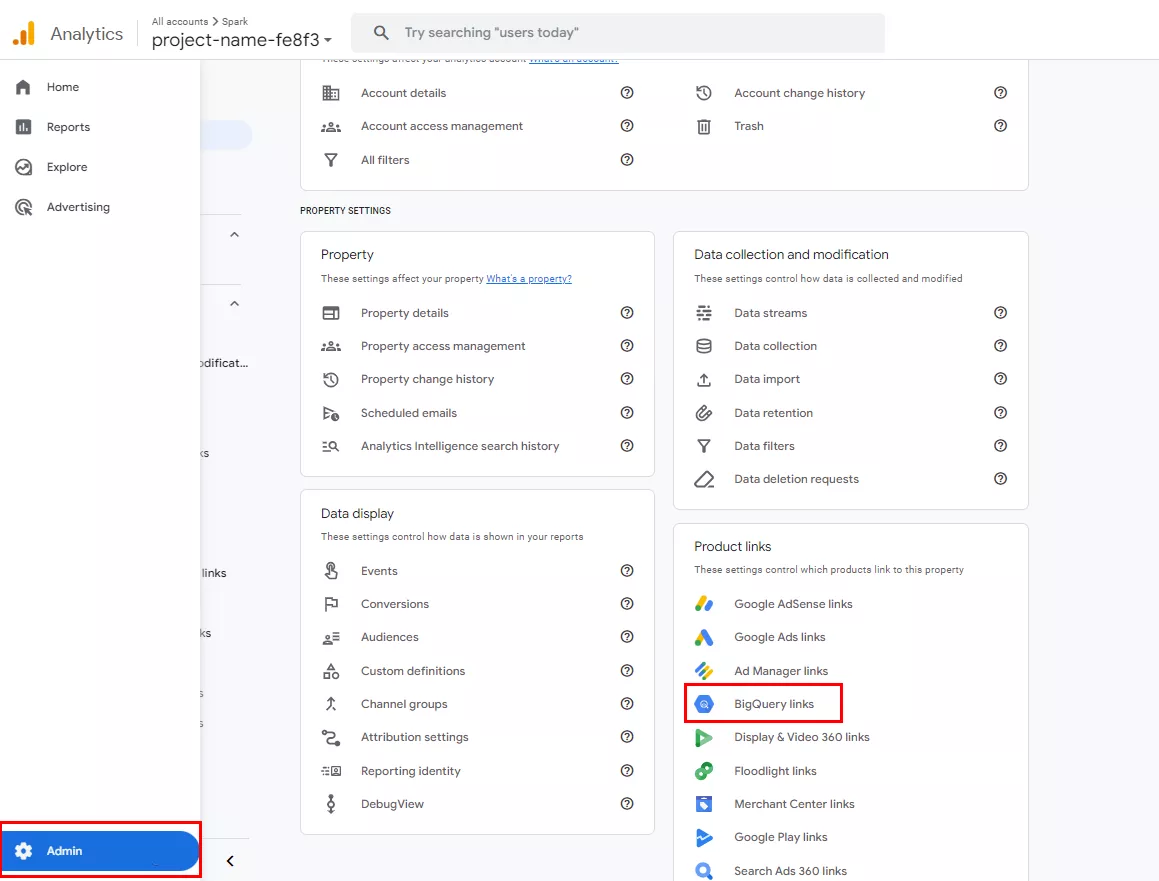
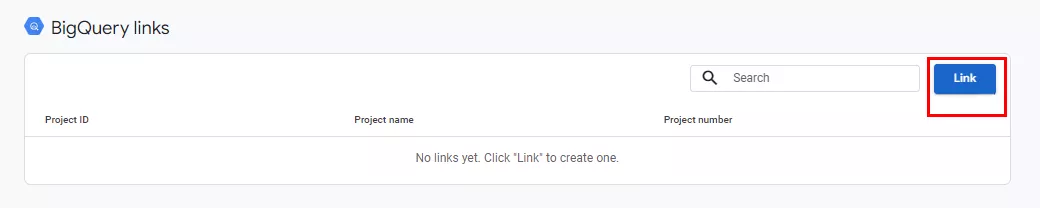
- Go to settings (Admin). In the Product links section, select BigQuery links.
- Click Link.
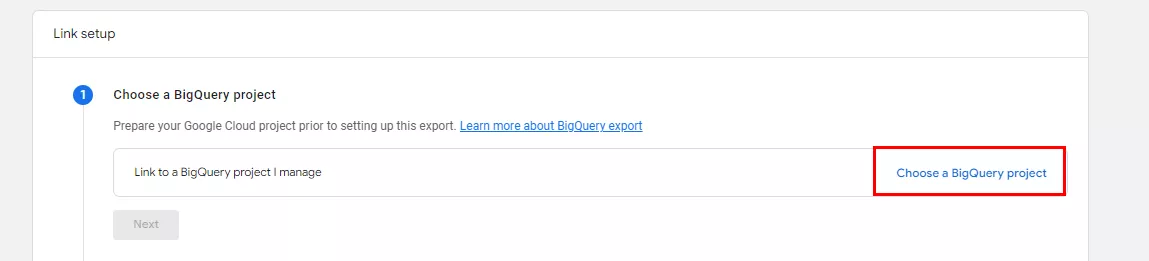
- In a new window, configure the connection to BigQuery. To do this, click Choose a BigQuery project.
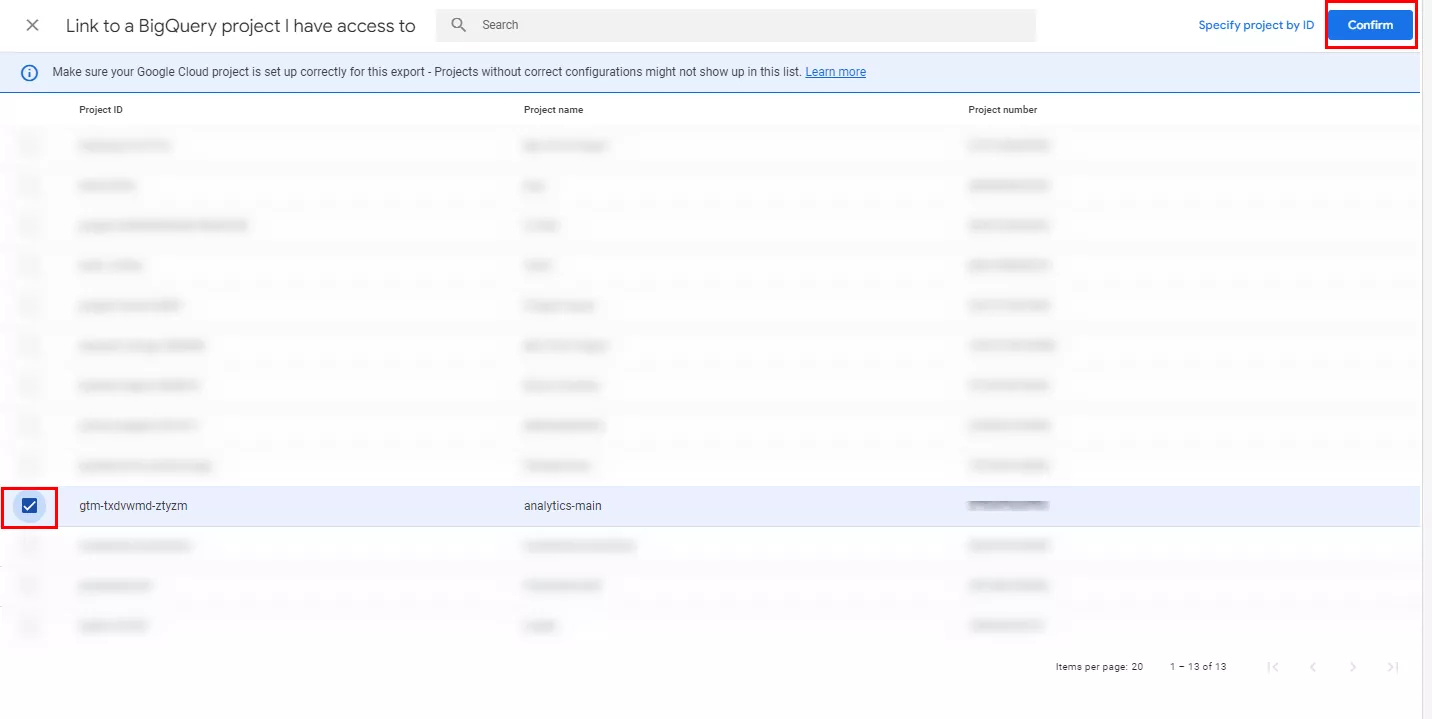
- Select the created project in BigQuery from the list of available projects. Click Confirm.
-
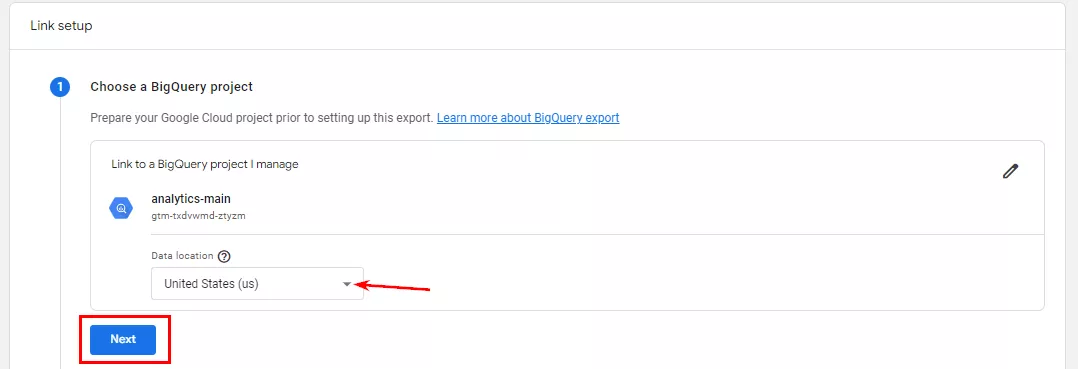
Select the Google Cloud region where your data will be hosted. Once selected, you cannot change the location. The United States (US) is the default location.
Selecting a data location affects the physical distribution and processing of information in the Google Cloud infrastructure. Once you have made your selection, click Next.
-
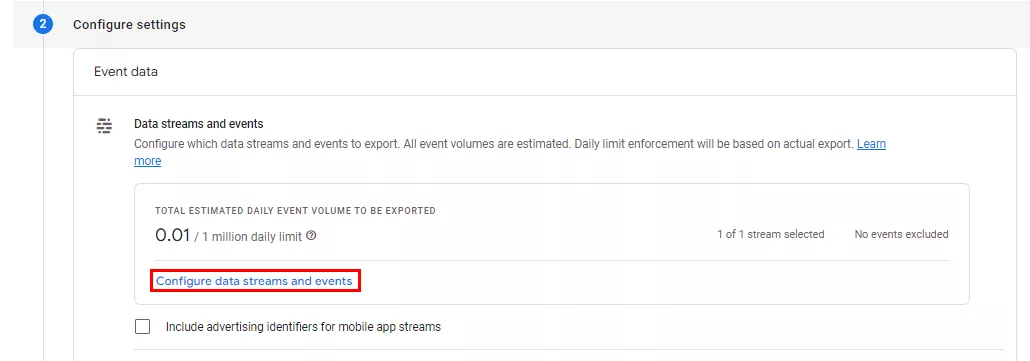
Configure the data transfer by selecting the streams you want to export to BigQuery.
Initially, all streams are selected by default. If your GA4 resource contains website and mobile application data streams, and you want to transfer data to BigQuery only from the website, change the selection using the Configure data streams and events button. You can also exclude certain events from export there.
If there is a data stream for a mobile app on Android, select the Include advertising identifier for mobile app streams checkbox. This will store user ad IDs for further analysis.
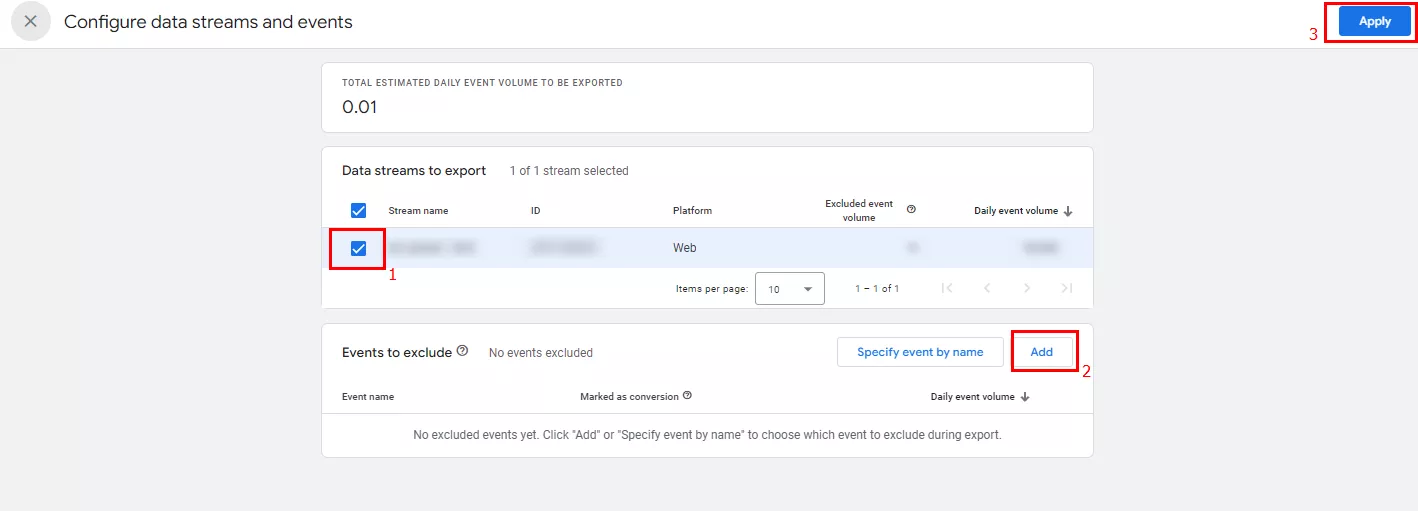
To exclude streams and/or events:
- Select the data streams you want to export (1).
- Exclude events from the export, if necessary (2).
- Apply changes (3).
-
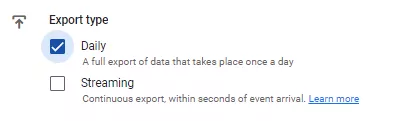
Next, select the frequency of the data transfer:
- Daily – full data export for the previous day, performed once a day;
- Streaming – continuous data export in real time, which occurs within seconds of a user-triggered event.
Streaming data is only available after adding a payment account to Google Cloud Platform.
You can select both daily and streaming data exports at the same time.
Important note: The BigQuery export limit for standard GA4 resources is 1 million events per day for daily (batch) export.
There is a charge of $0.05 per 1 GB of data (1 GB of data ≈ 600,000 GA events) for using streaming exports.
Let's say the daily GA4 data upload does not fit within the 1 million events per day limit. Then, you will have to use streaming export. For example, if you send about 2 to 2.5 million events per day, it will cost about $6 per month.
Alternatively, you can exclude certain events from the export. But I wouldn't recommend this, simply because data you don't need for analysis now may be needed later.
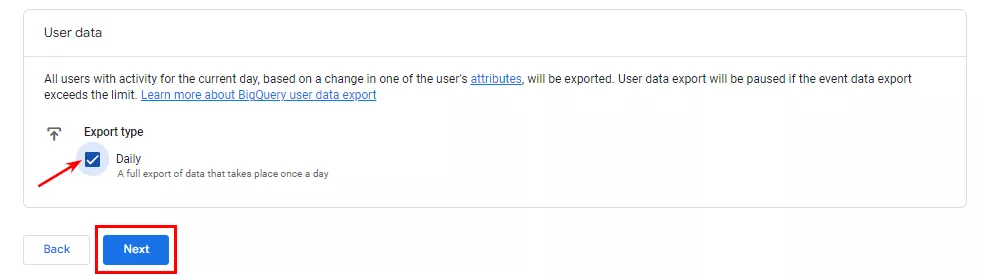
- Enable user data export and click Next.
-
Next, Google will prompt you to double-check your data. If everything is correct, click Submit.
You will now see your link in the list of BigQuery links.
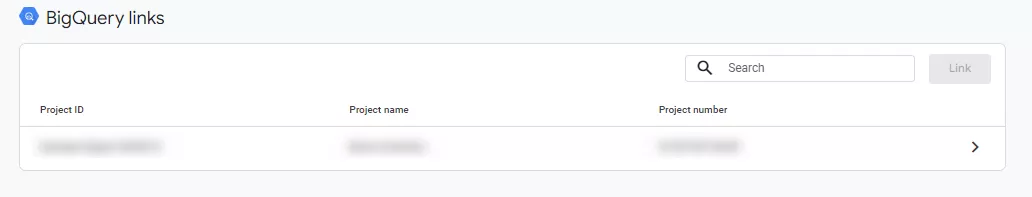
The Link button is no longer available. This is due to the restriction that only one link can be created for each GA4 property.
Step 4: Check and monitor.
After setting up the export, wait 24 hours for the integration to complete. It is important to regularly check that the data is being transferred correctly so that you can quickly identify and fix any problems.
This is how the data is loaded into the BigQuery project:
- After uploading, a data set called analytics_XXXXXXXXX is created, where XXXXXXXXX is the identifier of the Analytics property.
- In this dataset, a separate table is created for each day:
- events_YYYYMMDD, which is the daily table;
- events_intraday_YYYYMMDD, which is the table for the current day.
The second table is deleted after all the data is loaded into the events_YYYYMMDD table. Each row in the table represents an event.
Usually the data is uploaded at night, but it can happen that a day is missed. In this case, the data will be uploaded and refreshed within 72 hours.
Conclusions
- Raw data is the data collected from a source that hasn't been processed. It contains information about each event, i.e., user actions: clicks, page views, purchases, etc.
- The opposite of raw data is aggregated data, which is what GA4 presents. While this is convenient, it doesn’t provide much information about site visitors due to privacy, sampling, and API limitations.
- There are several benefits to working with raw data:
- Independently choose which data to include or exclude when calculating the metrics you need.
- Decide which summarization or averaging methods to use.
- Calculate parameters and metrics that are not available in the tool interface.
- Update reports with data from other sources.
- One of the best tools for managing and analyzing raw data is Google BigQuery. Its main advantages are speed, availability, and ease of use.
- IGA4 and Google BigQuery can be integrated in just a few clicks. The service has a limit for exporting standard GA4 resources: only 1 million events per day for daily (batch) export. There is no limit on the number of events for streaming export.
If you need expert help with setup or strategy, explore our Google Analytics 4 Services to unlock the platform’s full potential.

 1
1
 1
1
 0
0
Recommended theme posts
Related Articles
How to Set Up Consent Mode in GA4 on Your Website with Google Tag Manager
Let's explore how to properly integrate consent mode in GA4, configure it for effective data collection, and at the same time comply with GDPR and other legal regulations
Display Advertising Effectiveness Analysis: A Comprehensive Approach to Measuring Its Impact
In this article, I will explain why you shouldn’t underestimate display advertising and how to analyze its impact using Google Analytics 4
Generative Engine Optimization: What Businesses Get From Ranking in SearchGPT
Companies that master SearchGPT SEO and generative engine optimization will capture high-intent traffic from users seeking direct, authoritative answers