Google Analytics 4 for Different Types of Websites: What You Need to Get Your Business Up and Running
Selecting the right reports for your business can be a time-consuming task. To make the process easier, I’ve written this article to help you choose the most relevant reports in Google Analytics 4 for various types of websites. This guide will highlight the key metrics you should focus on when analyzing different site categories.
In this article, I will tell you how to select events to track, what role KPIs play in analytics, and review useful reports in Google Analytics 4 for:
- Landing pages
- Information resources
- Online stores
- SaaS products
While this list is not exhaustive or even comprehensive, it is definitely enough to get you started. It will also position you for success in further analytics development in your project. As always, I will include a lot of comments, additional explanations, and theories to provide a complete picture.
How to decide which events to track
This is one of the most common questions I get in my work in analytics consulting. Companies often don’t know what data they need to look at to make decisions and what user actions on the site they need to track, so they ask questions like:
- What events are important to track on my site?
- Is it enough to track form submissions and purchases?
- Is it better to set up tracking of page scrolls or clicks on all buttons?
- Do we need to set up e-commerce?
- What other reports do we need to build in GA4?
But you don’t need an analyst to answer these questions. You just need an understanding of business goals and key performance indicators (KPIs). Start by answering the following questions:
- Why do you need analytics?
- What do you want to get out of it?
You then need to build your analytics strategy around the answers to these questions. Usually, when I explain this simple truth and give a few examples, people start generating the right ideas immediately. So, in this article, I will not only give you a list of specific metrics, but I will also explain the goals that they are related to.
Note that I won’t discuss the most obvious indicators in this article, such as the number of leads or calls. Of course, they are extremely important, but there are already a lot of resources on them. This article will help you find answers to more nuanced questions like:
- What type of content should you write for your blog?
- What percentage of SaaS service users use the service daily?
- As many as 98% of website visitors do not leave their contact information, so why are we losing them?
I will talk about the peculiarities of user interaction with your websites and products. As part of that, I will explore how to analyze interactions and what events, metrics, and reports can help you with this.
Metrics vs. KPIs
First, let’s take a look at the basis of site analytics and clarify the differences between the terms. Metrics, indicators, and KPIs may sound similar, but the devil is in the details.
Metrics are indicators used to analyze the various aspects of a website. For example, the number of users, transactions, total revenue, key event ratio, etc.
Key Performance Indicators (KPIs) involve the same indicators but in relation to the goals of the site. They are key to analyzing a particular business because they reflect its performance.
Although I will guide you on working with KPIs, a business typically has too many unique features to talk about KPIs in a generic sense. So, I will use the term indicators from now on.
A summary and navigation of the series
To make the material easier to digest, I have created a mind map summarizing the entire series of articles. It briefly outlines the main indicators for each type of site.
In addition to that, here is an outline for your convenience. Use it to jump directly to the relevant section based on the type of site you need:
- Google Analytics 4 for landing pages
- Google Analytics 4 for information websites
- Google Analytics 4 and online store analytics
- Google Analytics 4 and SaaS analytics
As you can see, the article will be long, but it will be interesting and useful. For each type of site, I will analyze the following factors in order:
- The main feature of this type of website
- Questions that will help increase conversions
- Key indicators
- How and where to analyze the key indicators
I will emphasize specific indicators for certain types of sites, but that does not mean they are not useful for other types of sites. For example, I’ll start by analyzing analytics for landing pages, and the same landing pages are often used for SaaS. I won’t repeat the same thing in another section, but keep in mind that you can use the information from one section for different sites.
Google Analytics 4 for landing pages
The logic of a classic landing page is usually based on the buy-or-die principle. This means that the user who visits the site will either perform the desired action, such as make a purchase or fill out a form, or simply leave the site. There is no third option.
Note that this section discusses classic landing pages. There are variations where the landing page presents several products or their different versions with the possibility to go to other pages with other products. However, since these types of pages are more commonly used in online stores, their analytics will differ.
Once you know the basic principle, it is easy to ask the right questions. That is, all you need to do is maximize the number of customers and minimize the number of people who leave the site without making a purchase. You need to answer two questions:
- At what point do you lose a user, or at what point do they lose interest?
- What interactions increase the likelihood of conversion? What encourages a customer to buy?
Let’s discuss the indicators relevant to these questions, starting with the first one.
At what point do you lose a user?
Since the classic landing page is usually a single page, the depth of scrolling will be one of the main indicators for analytics.
The standard scrolling tracking in GA4 shows whether the user has scrolled 90% of the way down the page (scroll event in the analytics interface). However, this information doesn't give you the whole picture. For example, it tells you that five people scrolled to 90%. But what about the other 95 visitors?
Considering that on most landing pages, you can make a purchase or order without scrolling to the bottom of the page, this default metric is of questionable value.
Therefore, you need to dig deeper using custom settings, such as:
- A funnel for analyzing scrolling by specific percentages, like 25%, 50%, 75%, and 100%
- A funnel for analyzing scrolling by landing page blocks
It is not a bad idea to use services that will help you build a scroll map and determine the specific stage of user loss. However, I will focus on evaluating this indicator using GA4.
First, let’s see what a page depth funnel might look like. Here’s an example of the landing page from one of my Google Analytics 4 courses.
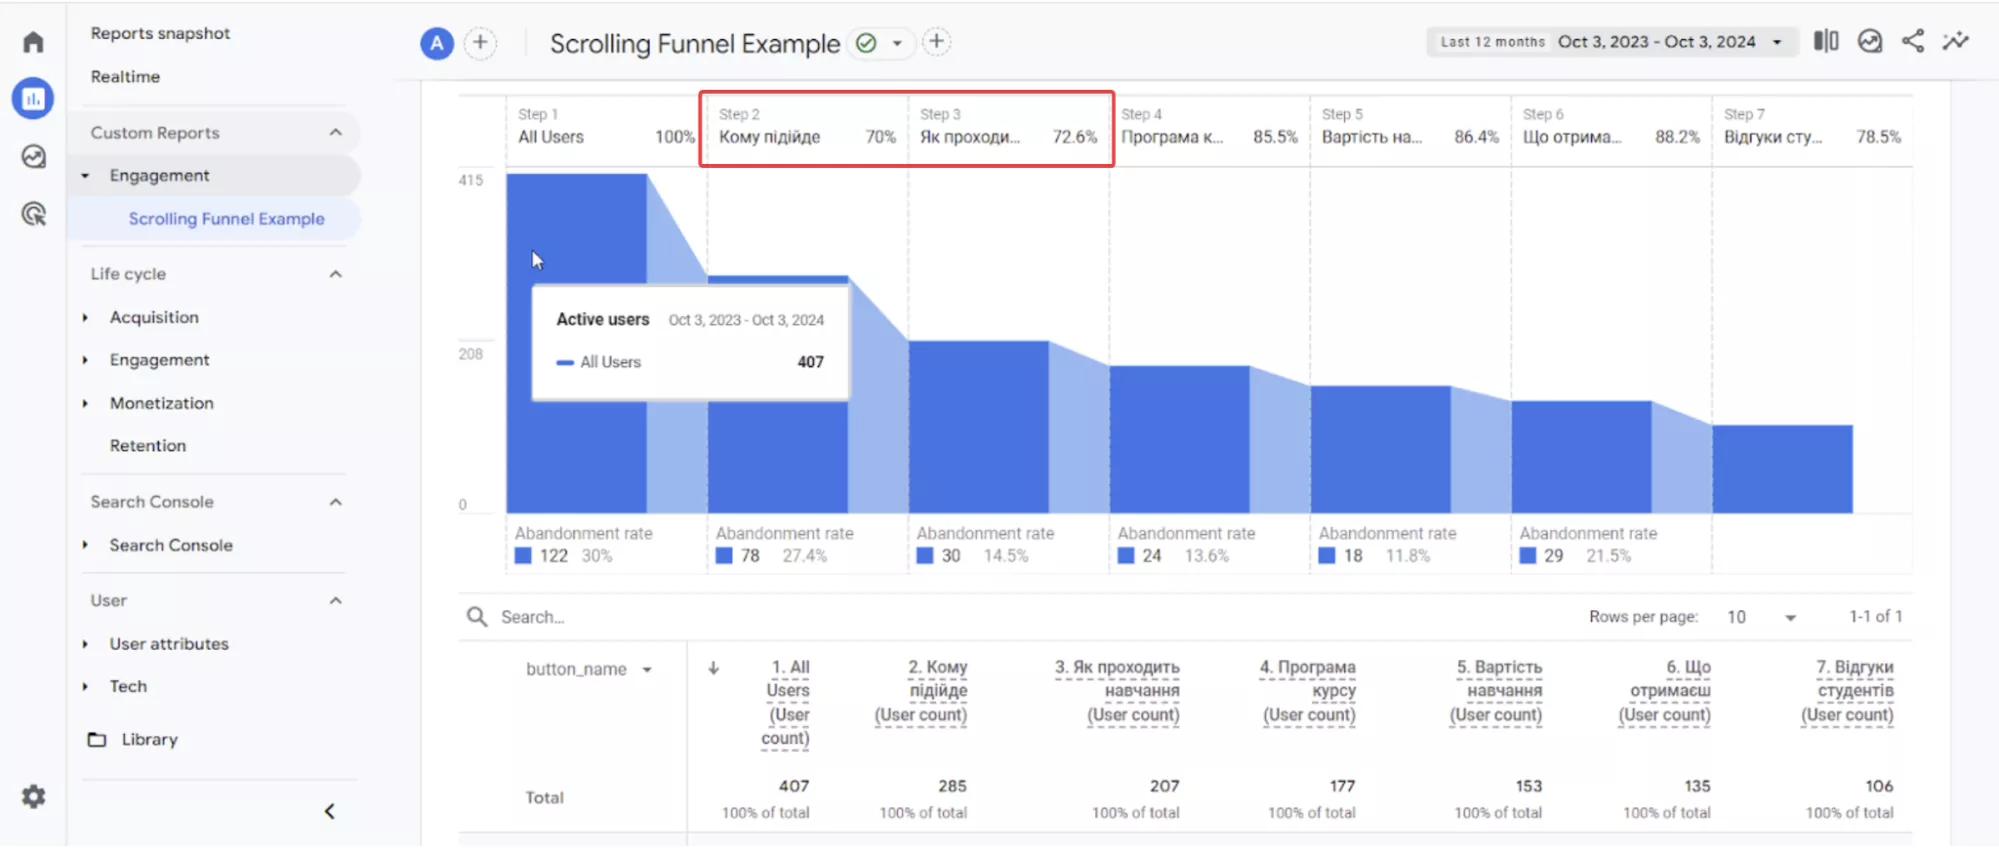
This report clearly highlights which block users are leaving after viewing the landing page. For example, I can see that 30% of visitors do not scroll to the “Who is this course for?” block, which comes after the first screen. And only 73% of those who scroll to the “Who is this course for?” block reach the “Learning experience” block. In other words, only 51% of all visitors get to the third block of the landing page.
Of course, looking at this data alone, it is impossible to say exactly why this is happening. It could be for several reasons:
- The first screen has a start date that does not suit the student.
- The student read the “Who is this for?” block and realized that the course was not suitable for them.
- Untargeted traffic is coming to the landing page.
- The landing page does not display well in the Safari browser, so its users leave after the first few blocks.
GA4 reports will help you investigate the last two reasons on the list, while the rest require additional tools.
To get a similar report in your GA4, do two things:
- Set up scroll tracking on your site through GTM using the instructions in my blog post.
- Create a funnel in the Explore block.
Now that we’ve solved the first question, let’s move on to the next one.
What interactions increase the likelihood of conversion?
This question is more complicated. Typically, complex mechanics such as A/B testing or logistic regression confirm that an interaction with a specific element increases the likelihood of conversion. GA4 reports do not cover this, but I will show you an approach to help you generate hypotheses. Note that the generated hypotheses will still need to be confirmed separately.
Sequence analysis will help. We need to compare the conversion rate to the required action between two groups of visitors:
- Those who took a specific action whose impact on conversion we want to evaluate, such as clicking a button.
- All visitors to the landing page.
If the conversion rate of those who performed a certain action is lower than the average for the site, that action has no impact on conversion. If the conversion rate of those who took a particular action is higher than the site average, we hypothesize that there is an impact.
Note: At this stage, the impact of an action on conversion is only a hypothesis that needs to be tested. To do this, create an alternate version of your landing page and run A/B tests.
While this method won’t give you an exact answer to whether a certain interaction increases the likelihood of conversion, it will save you time by eliminating things that probably won’t work.
This analysis should be repeated for every important interaction on the landing page. In most cases, this is limited to clicks on a certain number of buttons and other clickable elements. Sometimes, it’s also worth analyzing information about how users interact with forms: how many of them start filling out the form and in what order they interact with the fields.
Analysis of interaction time with landing page elements
This is more complicated to evaluate.
For example, consider a landing page with the following blocks: “Who is this course for?”, “Course syllabus”, “What you will gain”, etc. The “Who is this course for?” section contains a description:
- “This course is good for a marketer because...”
- “This course is good for a web analyst because...”
- “A PPC specialist will benefit from this course because...”
All elements in the block are not clickable, so how would you evaluate their effectiveness?
The best solution would be to analyze the amount of time a user interacts with a particular block and assess whether longer viewing of the block affects the final conversion. Unfortunately, GA4 no longer tracks these metrics.
You can collect the necessary data using Google Tag Manager and transfer it to GA4, but you won’t be able to analyze it in detail in the interface. To solve this task, you will have to work with raw data in BigQuery.
Despite this shortcoming, GA4 remains the tool of choice for tracking conversions and traffic source efficiency.
Google Analytics 4 for information websites
Information websites are primarily media sites, but company blogs can also be included in this category. For landing pages, I used the slogan “buy or die”, but not every type of site has such a catchy phrase. However, there is still a certain logic that will correlate with the necessary indicators. For information sites, it sounds something like this:
The most important element is regular visitors, not submitted forms or sales.
Typically, information resources make money by selling banners, affiliate PR placements, or advertising integrations. At first glance, it might seem like it is important for them to have a constant flow of requests for such placements. But in reality, things are a bit more complicated:
- If an information resource has enough traffic, others will notice and naturally want to advertise on such a resource.
- If there is no traffic, companies usually would not want to invest in advertising on such a site.
Having loyal traffic that trusts the information site and its materials is especially valuable. In other words, creating a solid reader base of regular readers is the highest priority, and it is impossible without quality content. It is around this idea that the main indicators for information resources are formed.
There is another reason why regular visitors are important for information resources. Such sites do not usually make sales, so running ads to attract new traffic, only to have them read one article and never come back, will lead to significant losses. If you do attract a new audience through paid activities, you need to convert them into regular readers as much as possible.
Taking all of the above into consideration, there are three groups of metrics worth focusing on.
- Content metrics:
- Number of views and number of unique visitors who interacted with the content
- Engagement rate
- Website metrics:
- Engagement rate
- Number of pages (per session and viewed on average by a user)
- Time on site (per session and viewed on average by a user)
- Audience engagement and retention metrics:
- Number of new users
- Retention rate
I will talk about them in more detail below, starting with the one I consider the most important.
Content metrics
It’s hard to imagine a trustworthy, well-established information resource without quality content. And I’m not just talking about the uniqueness of the material or their meaning: different materials have their own audience, but the main thing is that they should be interesting.
There are two main things you should be concerned about when it comes to the content you publish:
- How popular it is
- How engaging it is
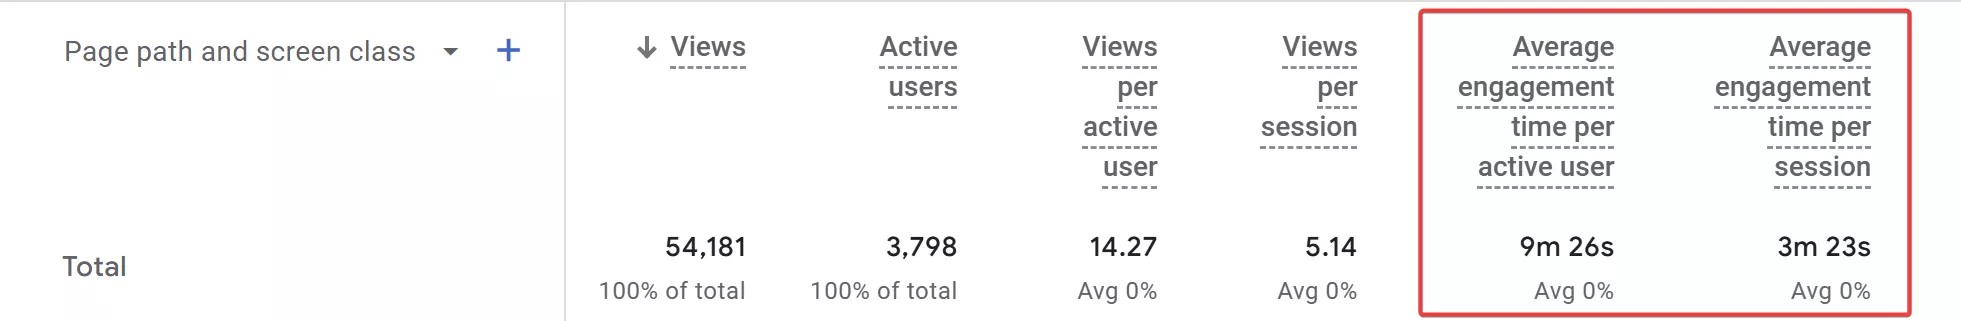
The first, popularity, is assessed by the number of views (number of page_view events) and the number of unique readers of the content (Total users). These are collected by default in GA4 and can be found in the standard Pages and screens report.
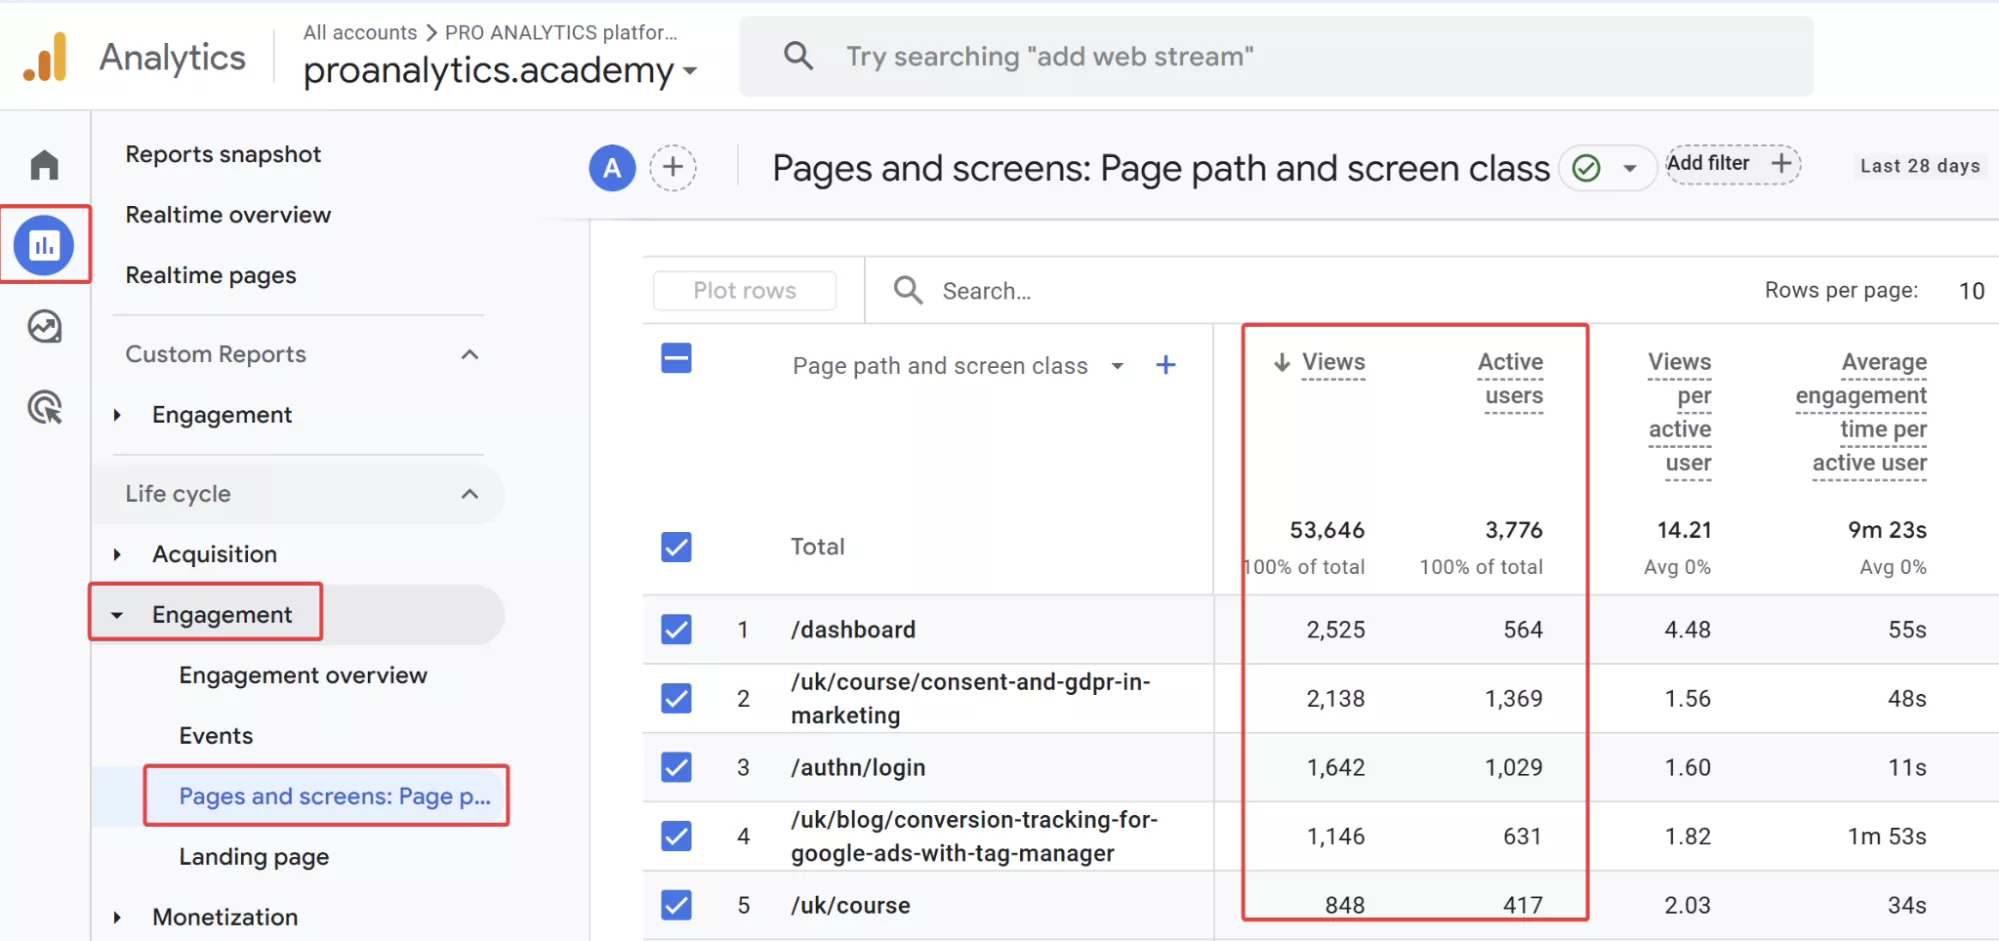
Above I have mentioned Total users, but the report will show Active Users, as seen in the screenshot. That said, for most information resources, the values of these metrics will be close.
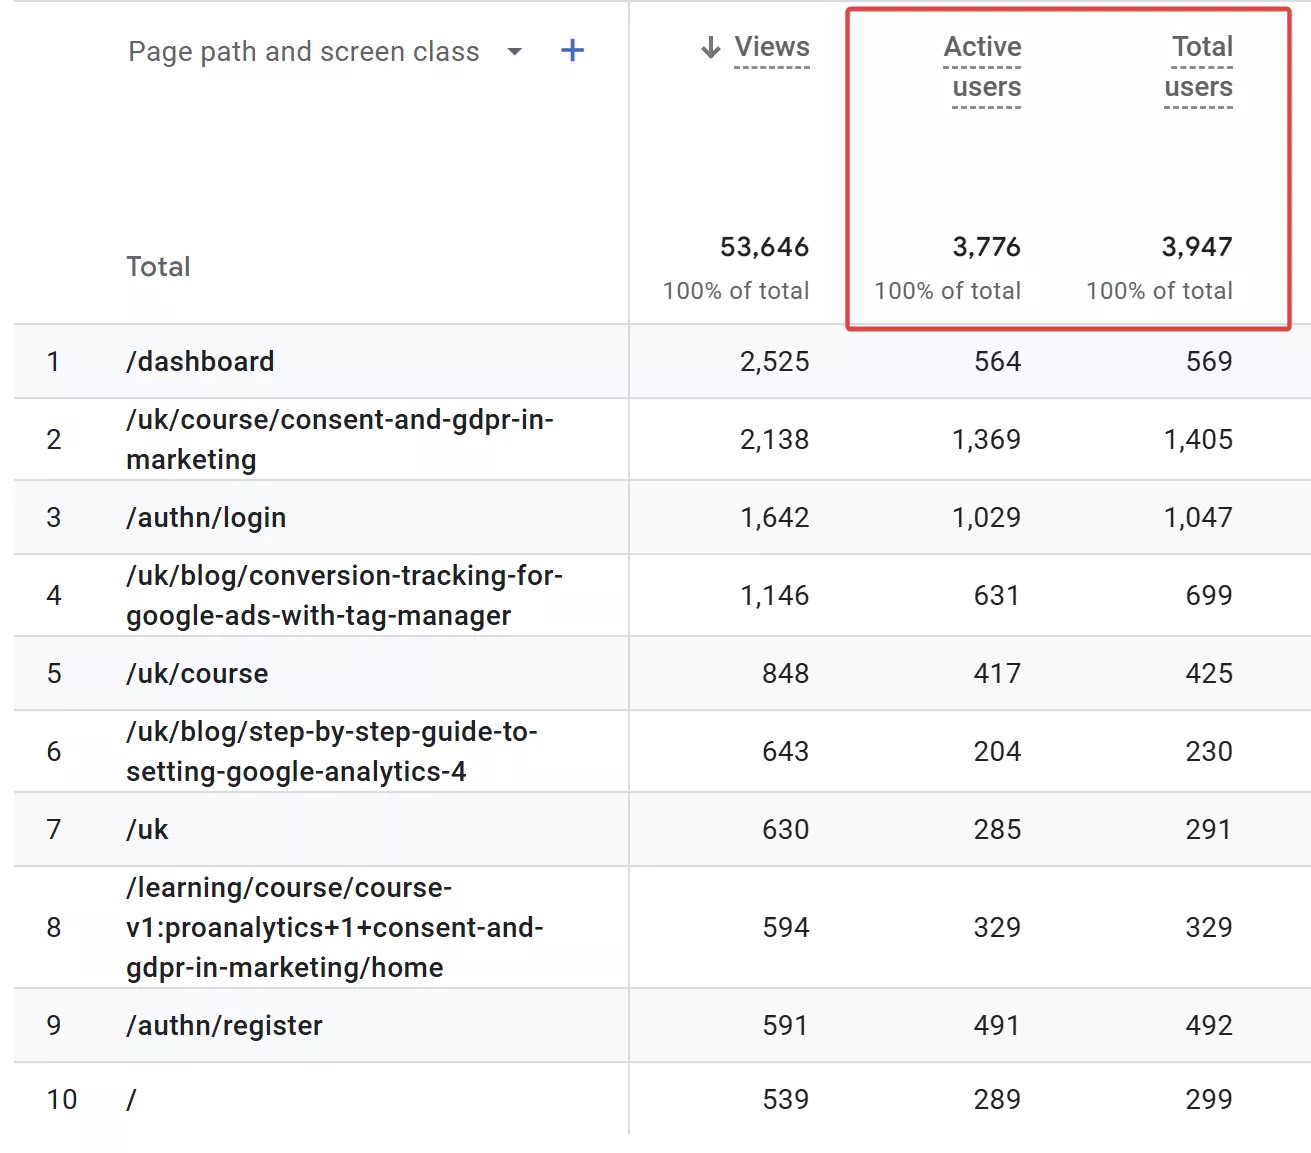
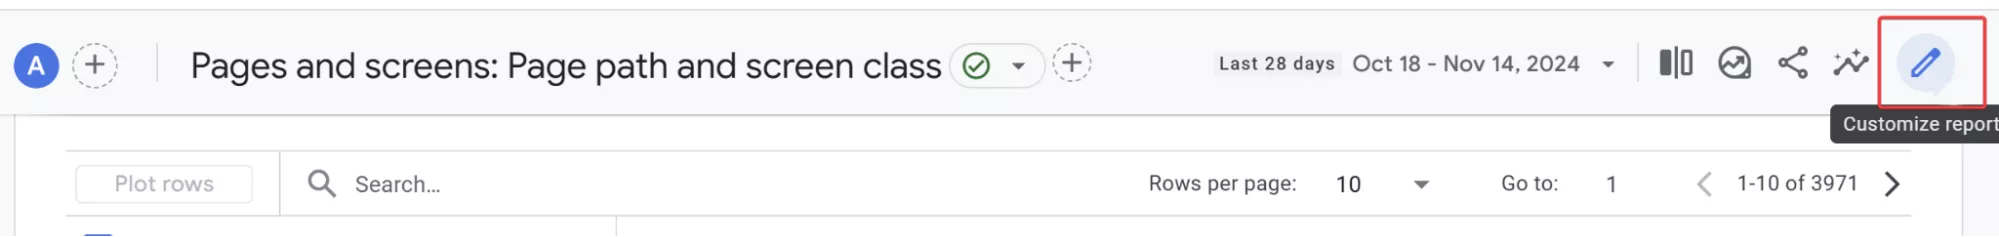
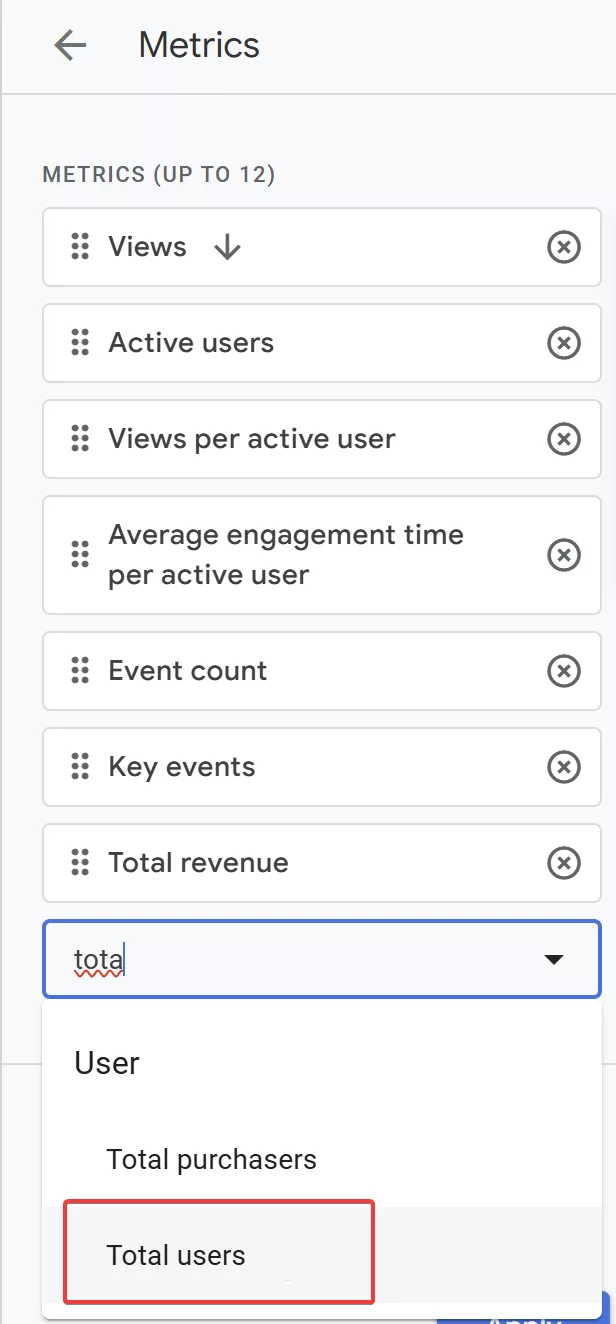
However, if you need a more specific report, you can view the Total users column by following these steps:
- Click Customize report.
- On the screen that opens, select Metrics in the upper right corner.
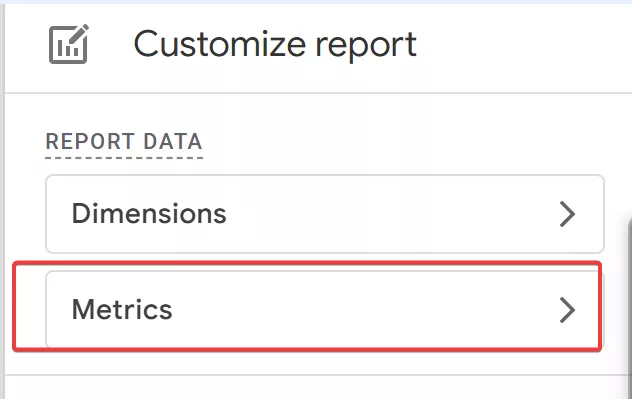
- Add a new Total users metric and save your changes.
Content views are important, of course, but to build loyalty, you need to assess how interesting your content is to your audience. How do you do that? One of the easiest and most effective ways is to analyze the time spent on the page and the percentage of scrolling in pairs.
Time alone is not always meaningful. Imagine if a person opens a page and goes to make tea while the page is still open. The page is open for 10-15 minutes, but there is no real interaction. Scrolling alone does not give a complete picture either: the user can scroll down the page quickly without really reading anything.
Of course, using time and scrolling together also has its drawbacks. But considering the logic of “resources used - results obtained”, it is still one of the most efficient ways.
There are two ways to measure scrolling and time on page relative to each other:
- Transfer data about time on page and scrolling at the moment the user leaves the page. In other words, evaluate the maximum interaction from the beginning to the end of the session. You can even identify separate groups of readers based on these indicators. The result in GA4 will look like this.
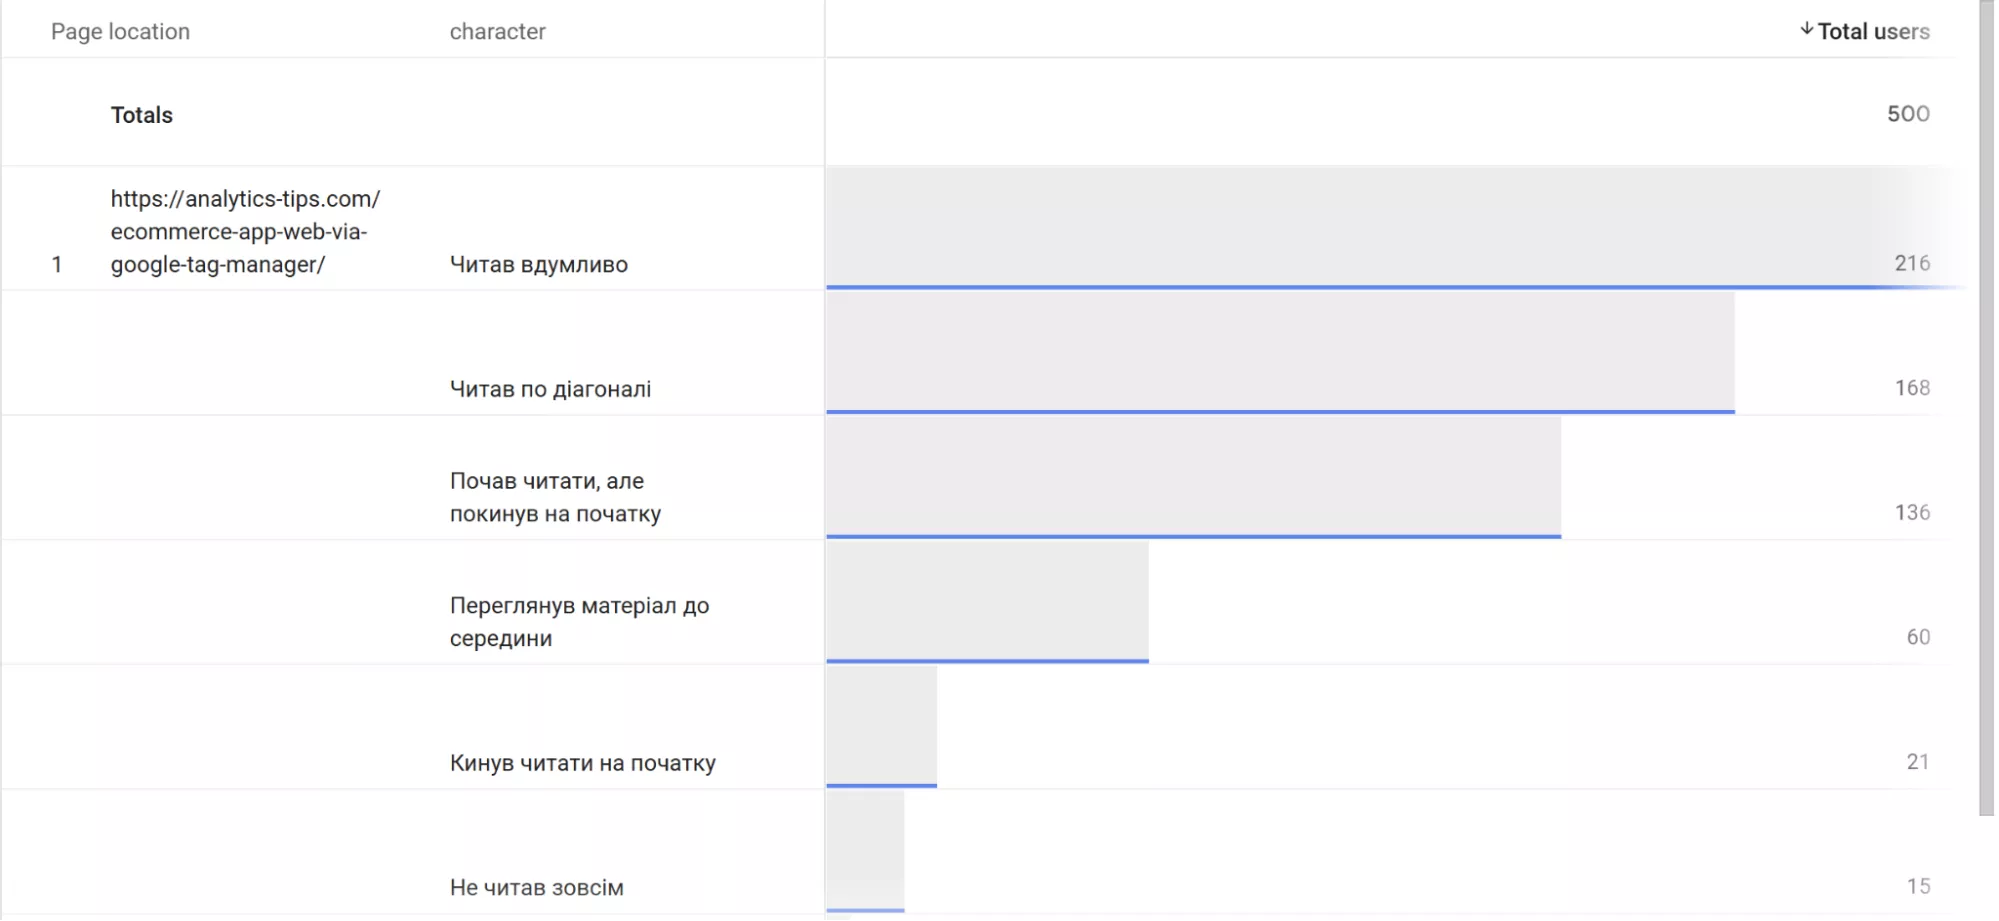
Read more about this method in my article “Tracking Scrolling Depth and Time on the Active Tab with GTM”.
- Set interaction thresholds. For example, you can consider a user engaged if they spent more than 40 seconds on the page and scrolled at least 50% of the page. This is the option I now use to analyze my materials, and its settings are described in the article “Measuring Bounce Rate Correctly”.
In each of these methods, to calculate the engagement rate, you need to calculate the percentage of people who actively engaged with the content out of the total number of visitors. This will be the main metric, and the higher it is, the better.
For example, if you use the second approach, the engagement rate will show how many users stayed on the page for more than 40 seconds and scrolled at least 50% of it.
Please note that the term “engagement rate” used in this article is unrelated to the engagement rate metric in Google Analytics 4, which calculates the percentage of engaged sessions. In GA4, sessions that count as engaged sessions are evaluated based on three different conditions:
- The user completed a key event.
- The user viewed two or more pages.
- The session lasted at least 10 seconds.
These may not be relevant enough. It is better to customize the session duration for your project.
Website metrics
Now, let’s talk about the second group of metrics crucial for information websites — website metrics. It is important to know not only how many people read individual articles but also how visitors interact with the site as a whole. You can write a dozen great articles, and everyone will read and share them, but if the rest of the articles on the site are not interesting, people will not return to the site.
Similar indicators can be used to evaluate engagement with a site; the only difference is the extent of the analysis: not a page, but the entire site.
The analysis requires three indicators:
- The average number of pages viewed by a user (per session and over time). The more pages a user views in a single session, the more interested they are in the content on your site. This is an indicator of the overall interest in your site.
In GA4, this data is available in the Pages and screens report. Views per active user are available there by default, and views per session can be added by customizing the report, as discussed above using the Total users example.
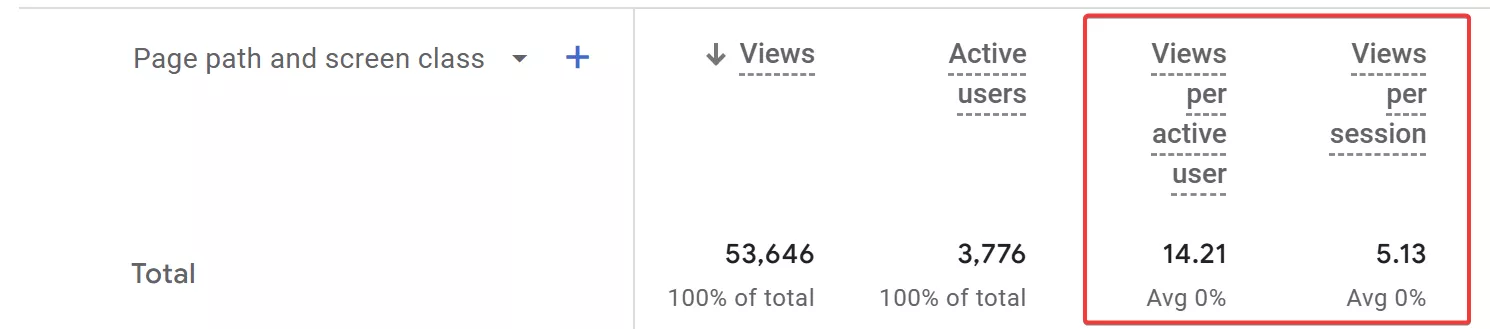
- Average time on site (per session and user). In addition to the number of pages, evaluating the amount of time a user spends on the site is essential. It allows you to understand if they really like the content or are just scrolling through headlines and leaving the site without finding anything useful.
You may have already guessed where to look for these indicators: the same Pages and screens report. Again, the average time spent per session has to be added manually.
- Engagement rate. Not all visitors will be equally interested in all sections, topics, or materials. This is normal. But we need to understand whether our visitors are at least interested in something, so the question is what percentage of users interact with at least one piece of content on the site? The solution described above to set interaction thresholds still applies, but you need to count at a higher level (per session and user).
Audience engagement and retention metrics
Engagement and retention metrics are crucial for informational resources. Unlike landing pages, where a user either takes action or doesn’t and then “drops off,” informational platforms must keep the audience engaged over time.
There are two main metrics for this:
- Number of new users. The New users metric shows the number of new visitors to the site. It is automatically collected in GA4, and the easiest way to view it is in the User acquisition report.
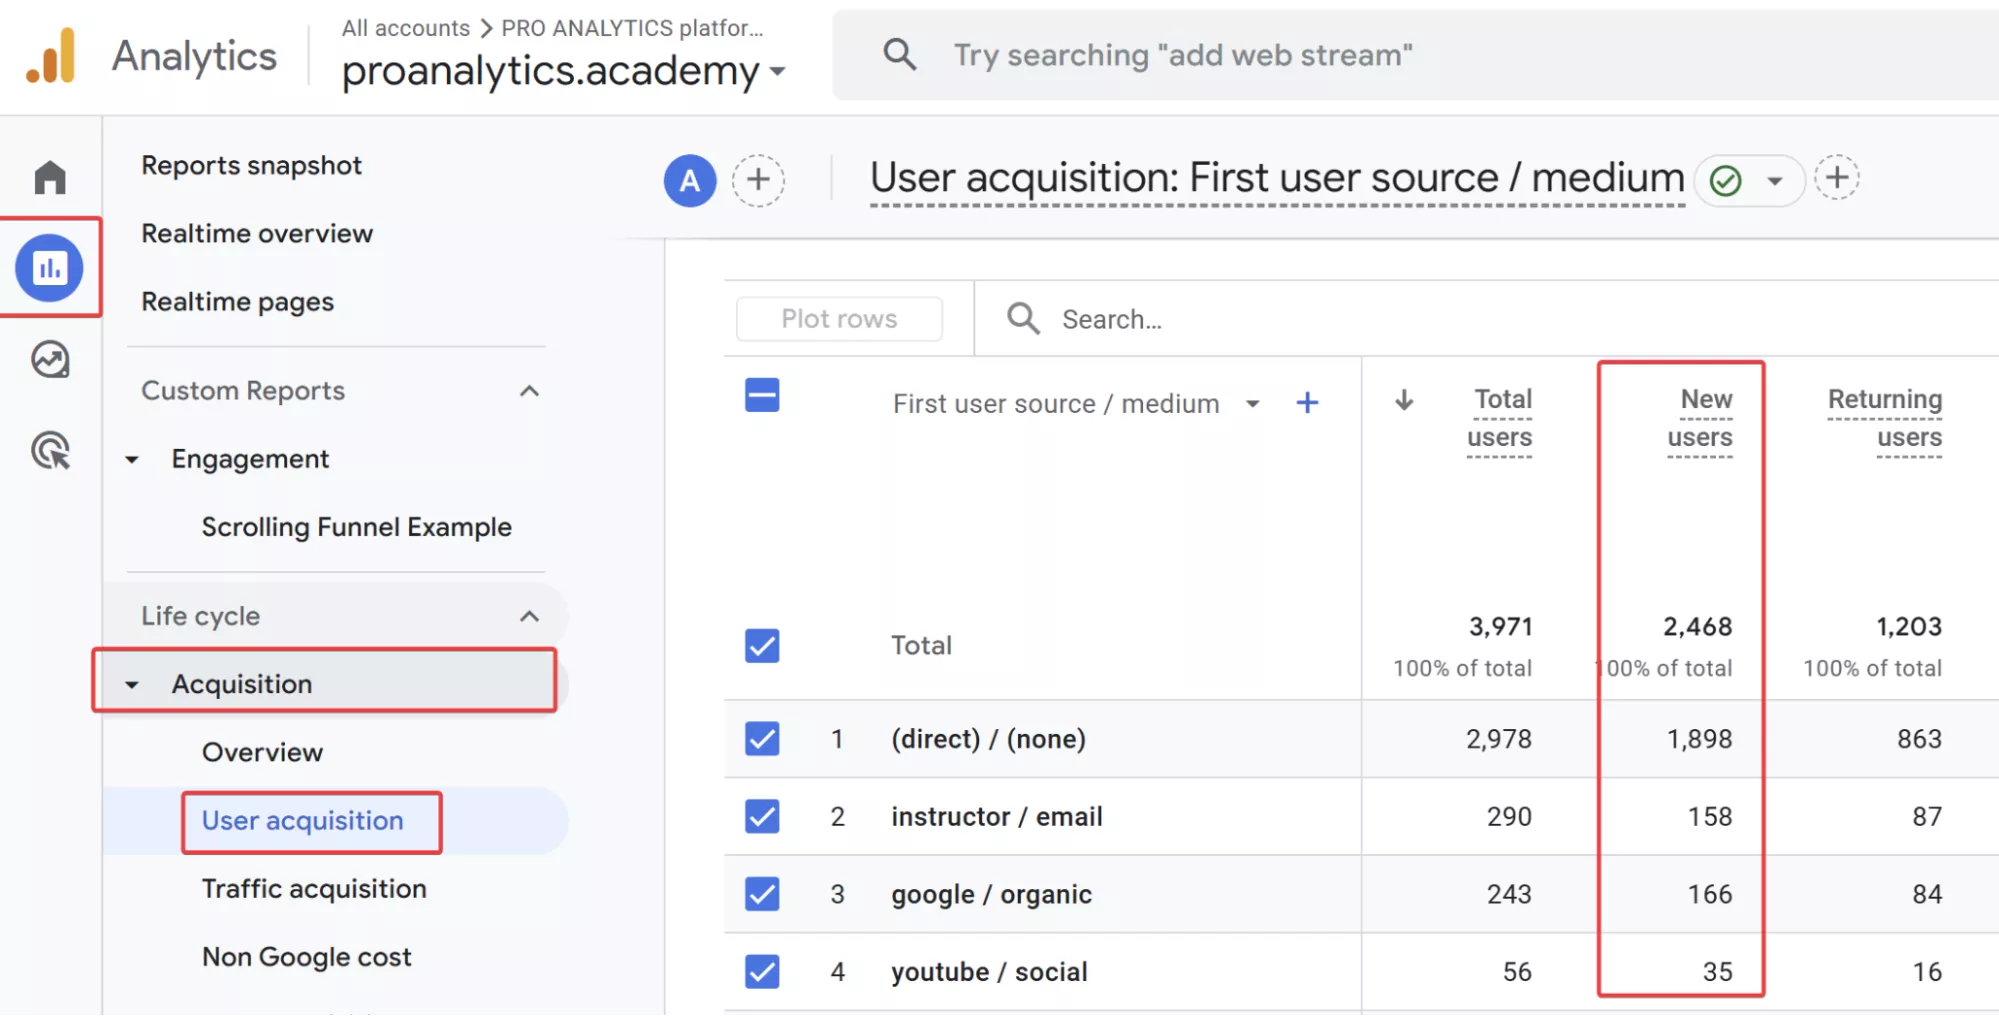
- The audience retention rate shows how many people return to the site. You can partially get a sense of this metric in the same User acquisition report by looking at the Returning users indicator.
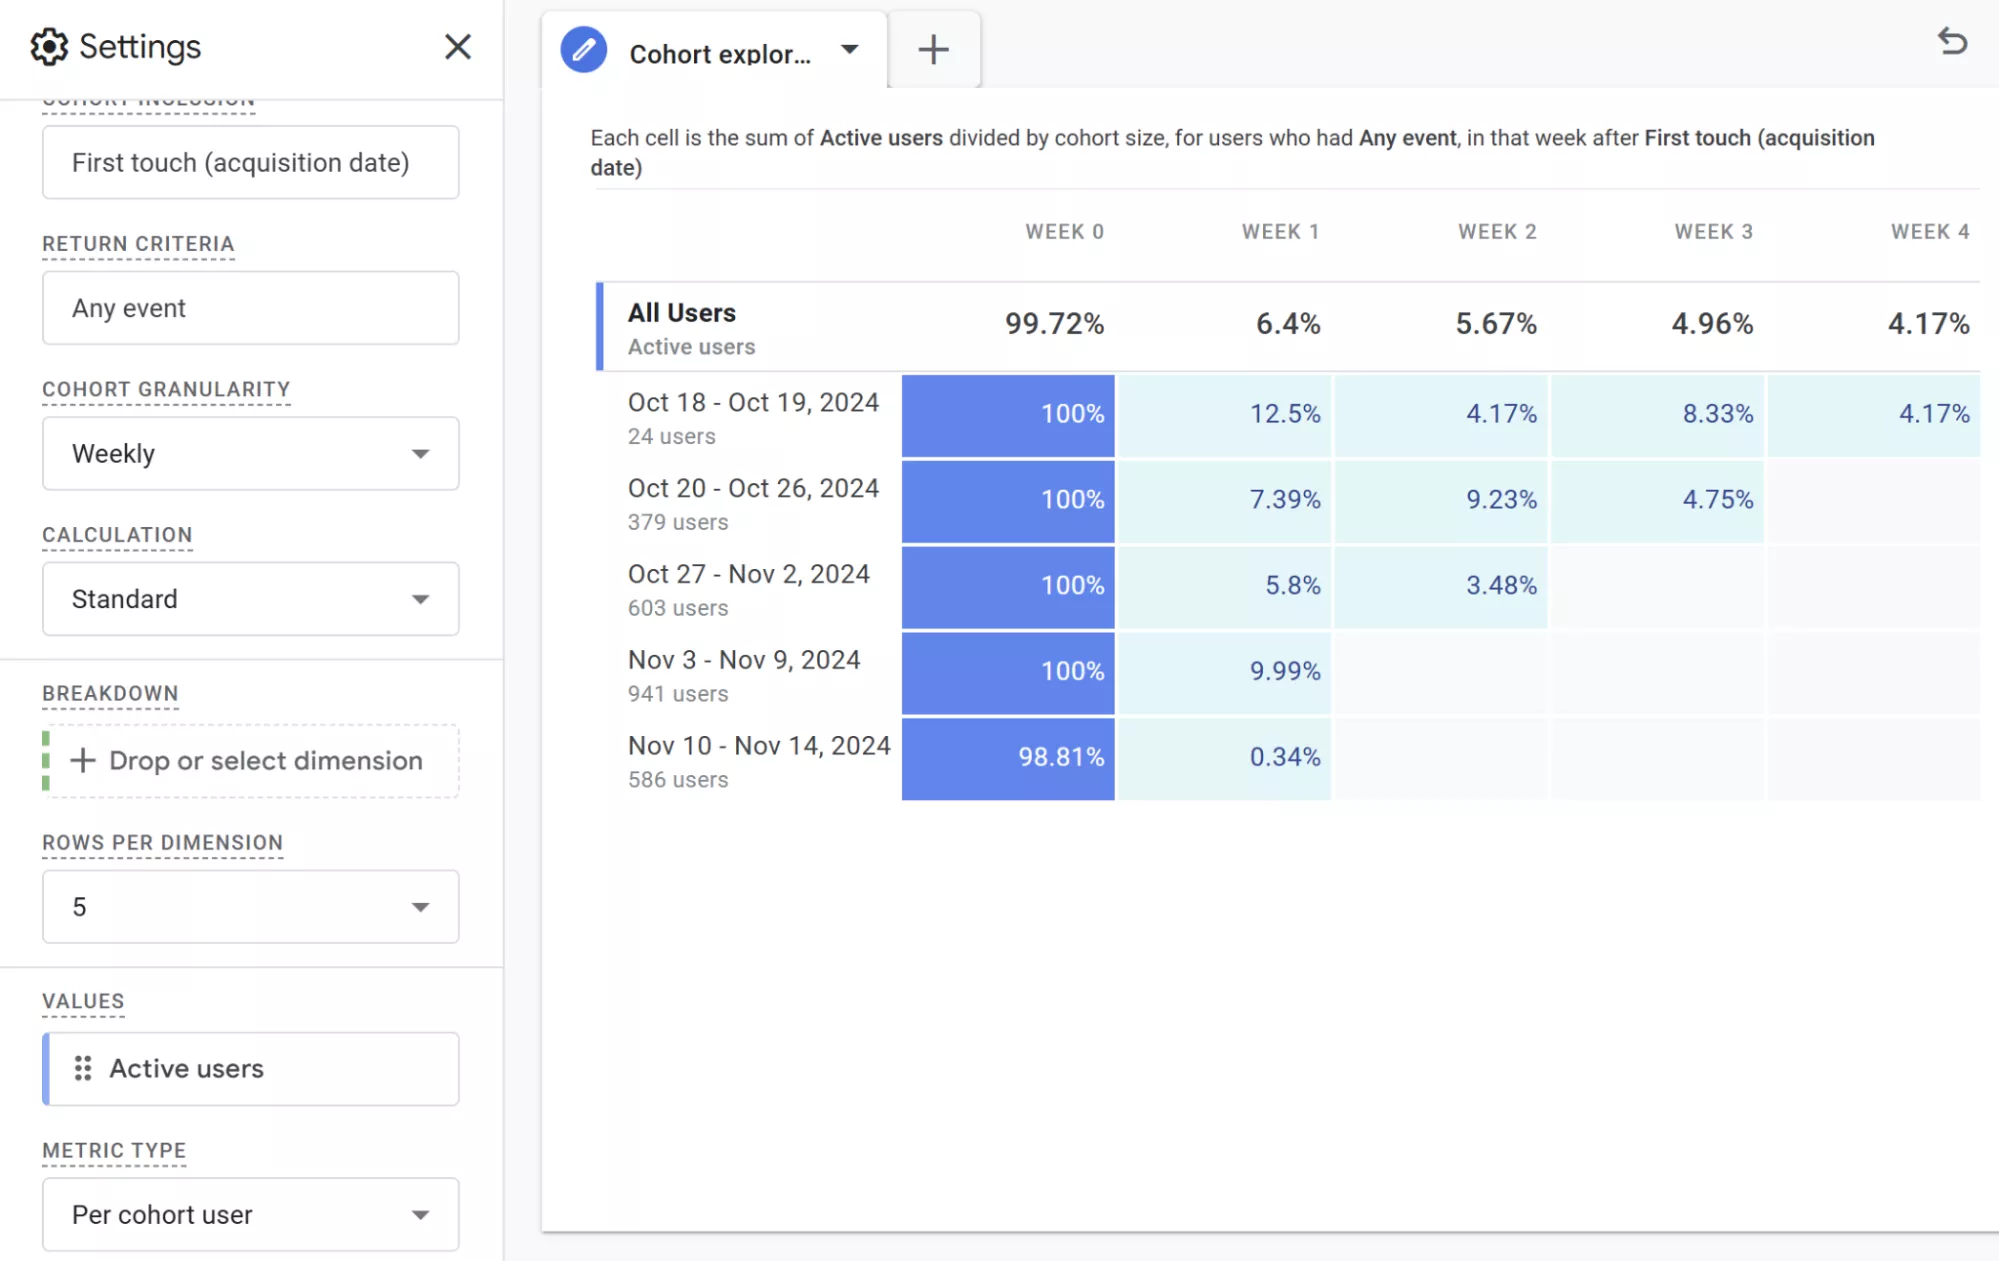
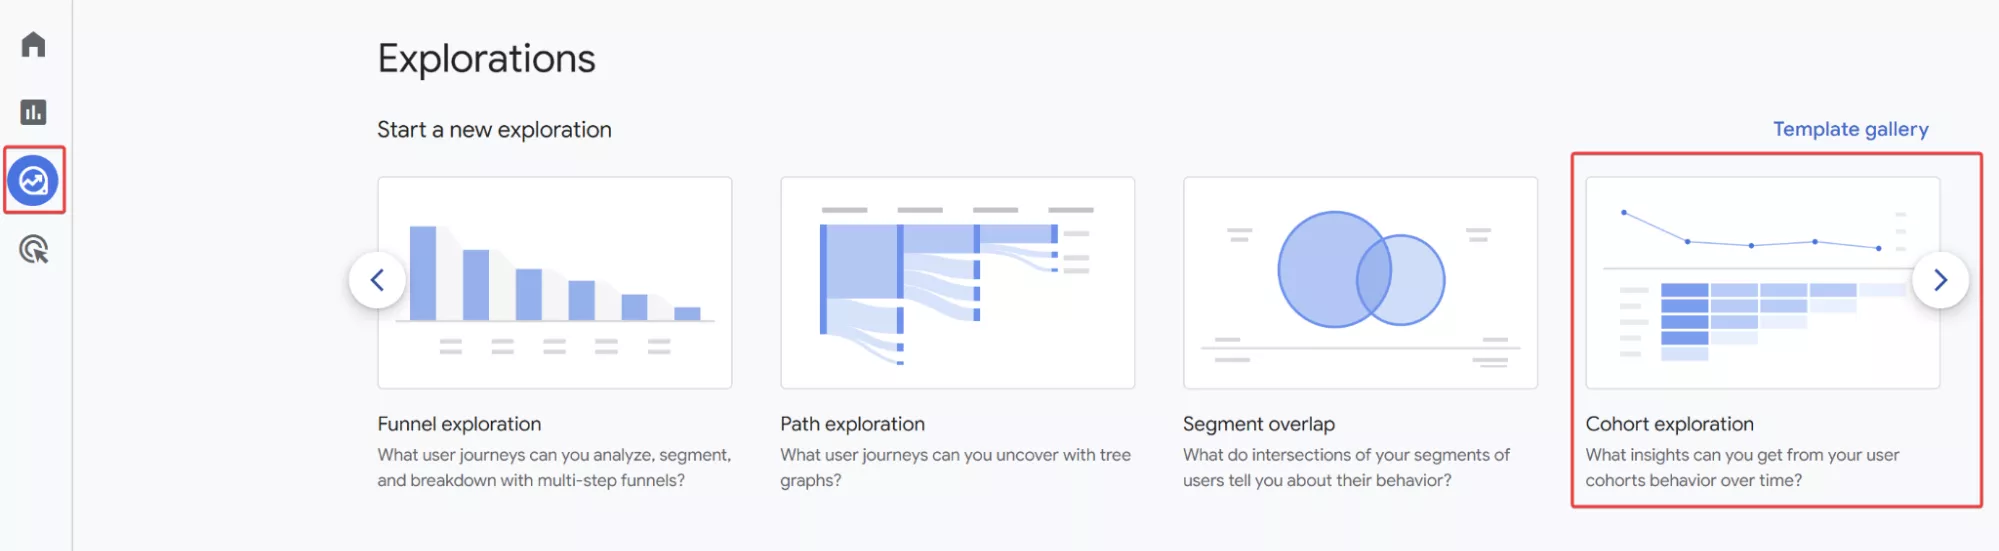
However, this indicator is best evaluated using the Cohort exploration section from the Explore block. This tool clearly shows the percentage of visitors who return over time.
Read more about the report in the article “Cohort Exploration in Google Analytics 4”.
In general, maintaining a loyal audience is especially important for information sites, as it is very expensive to attract new users on a regular basis. In addition, if you create quality content, users will keep coming back and help attract other visitors through referrals or sharing on social media.
Analytics for information resources is more complicated than for landing pages because a long-term approach is important, which means there are more factors to consider. The key is understanding how people consume content and whether they are returning to the site. This helps to not only retain the audience but also make the resource attractive to advertisers, who will ultimately bring money into the business.
Advertisers bring in revenue, but to do so, they need a way to contact you. Usually, this happens through a special landing page. The principles I discussed in landing page analytics would also apply to its analysis. This is a good example of how everything is connected.
Google Analytics 4 and online store analytics
Online stores have a key characteristic: the entire site is a sales funnel whose job is to sell.
While a landing page allows the user to do everything on one page at once, navigating an online store is more complicated. It is usually impossible to complete a purchase on one page, and the user has to go through several stages:
- Product selection
- Adding to cart
- Placing an order
- The actual purchase
And while some stores have One-Click Checkout, it typically accounts for a small percentage of orders. In addition, it is not uncommon for a visitor to view not one, but several dozen product cards before making a purchase, making it even more difficult to analyze their path.
Therefore, a funnel that shows the user’s path between these stages is an essential tool. Of course, e-commerce analytics is not limited to funnel analysis, but it is one of the key things you should definitely pay attention to. Let’s take a closer look at it.
Path to purchase and Path to checkout
The good news is that GA4 provides us with two helpful reports that show the user’s path to purchase:
- Reports – Monetization – Purchase journey
This report shows the main funnel:
- The total number of all visitors to the site (Session start)
- The percentage of visitors who viewed the product card (View product)
- The percentage of visitors who added the product to the cart (Add to cart)
- The percentage of users who went to the checkout page (Begin checkout)
- Users who finally placed an order (Purchase)
In addition, the percentage of visitors who did not proceed to the next step is shown under the column for each step.
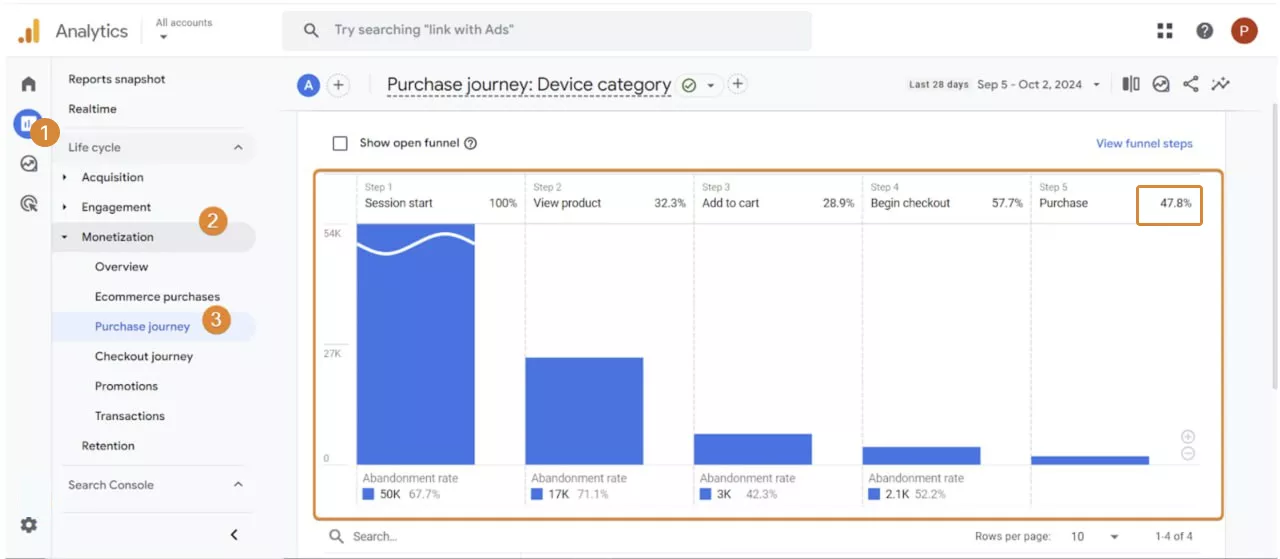
For some online stores, even this one report is enough to identify certain problem areas. For example, in the screenshot above, you can see that only 47.8% of those who go to the checkout page end up placing a successful order.
Think about it: these visitors found the product they wanted, added it to their cart, and went to the checkout page. They spent a lot of time on the site, but in the end, more than half of those visitors never made a purchase. Isn’t that a lot of missed sales opportunities?
This conversion rate is usually above 50% unless it’s a complex technical product or the site has usability issues on the checkout page. It’s quite common for users to drop off because of problems on the checkout page. In fact, it’s so common that the GA4 interface has another funnel that allows you to take a closer look at the checkout page.
- Reports – Monetization – Checkout journey
As you can see in the screenshot below, two new steps have been added between the “Begin checkout” and “Purchase” steps: “Add shipping” and “Add payment”.
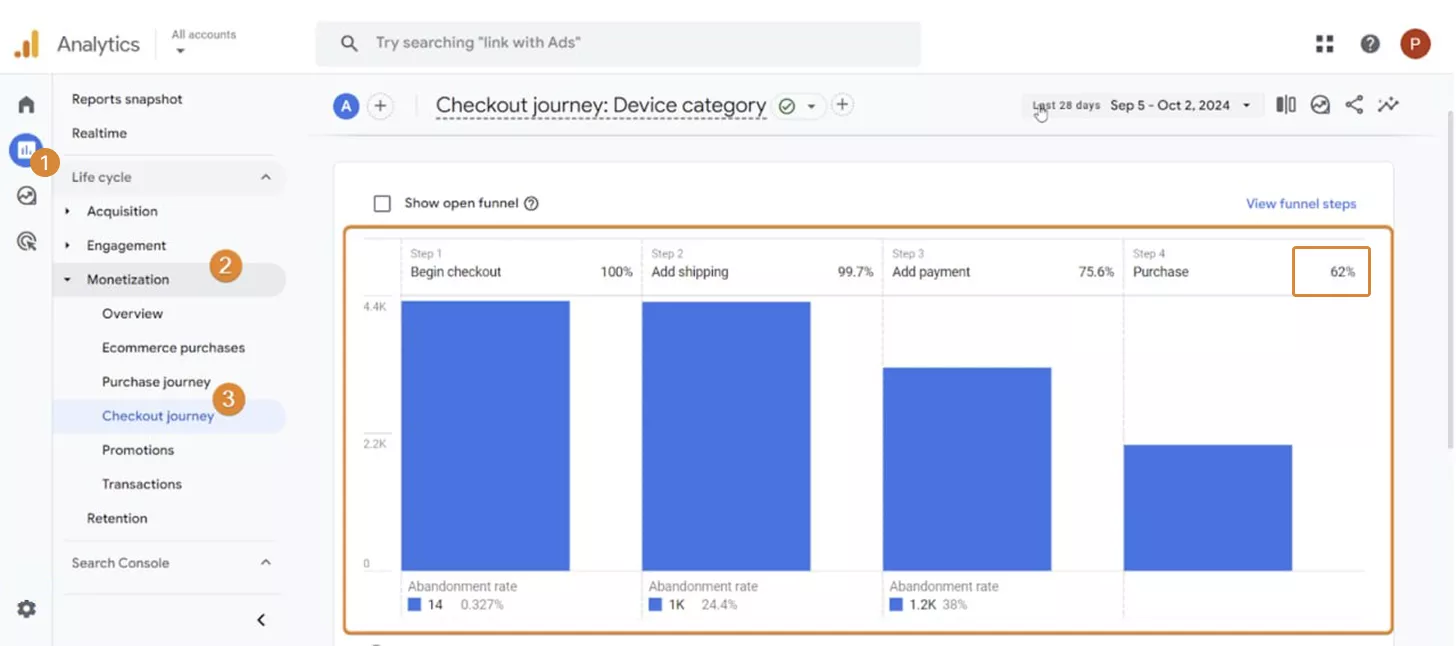
If you look at them more closely, you can see that almost everyone who went to the checkout page chose a shipping method, but only 75% chose a payment method. But that is not the main problem. Take a closer look at the last step: only 62% of those who selected a shipping and payment method placed the final order.
Simply put, two out of five users who have already gone from searching for a product to selecting a shipping and payment method have not taken the final action. It’s unlikely that they didn’t like the price of the product or that the shipping costs were too high: if these were not appealing, the user would have given up much earlier.
Of course, a funnel won’t tell you the exact cause of your problem, but it can help you locate it easily, as in this case.
GA4 doesn’t limit the use of funnels to these reports; there is also an Explore block where you can build other funnels you need. The Funnel exploration technique can help you with this.
Now that you’ve seen how much value is hidden in these two reports, it’s time for the bad news. Although the reports we’ve discussed today are standard, it’s not enough to simply install the GA4 code on your website to start viewing data in them. You need to set up e-commerce to populate them with data.
The Netpeak team has covered in detail how to set up e-commerce event tracking on their blog. I explore this topic even further in a dedicated two-hour lecture as part of the PRO ANALYTICS web analytics course.
The use of funnels is not limited to online stores. For example, you can also create them for landing pages, as I wrote about in the first part of this article. However, funnels are particularly essential for online stores because of the complex structure of the user journey.
End-to-end analytics
Funnels can help you identify many problems on your website, but they usually don’t show the most important outcome, which is real sales and revenue. It’s no secret that not every order placed is a real purchase. For instance, a person can change an order after a conversation with a manager, or not pick it up at the post office, or the package may not arrive.
All these situations demonstrate the general rule: order placed ≠ purchase.
Although GA4 has a Measurement Protocol that allows you to transfer real sales data from your CRM/ERP system to GA4, in practice, this method is not suitable for everyone due to its limitations.
In addition, companies usually want to focus on return on investment (ROI and ROMI) rather than revenue when making decisions. To evaluate this, you need to transfer not only revenue data from CRM/ERP but also expense data from advertising accounts to GA4.
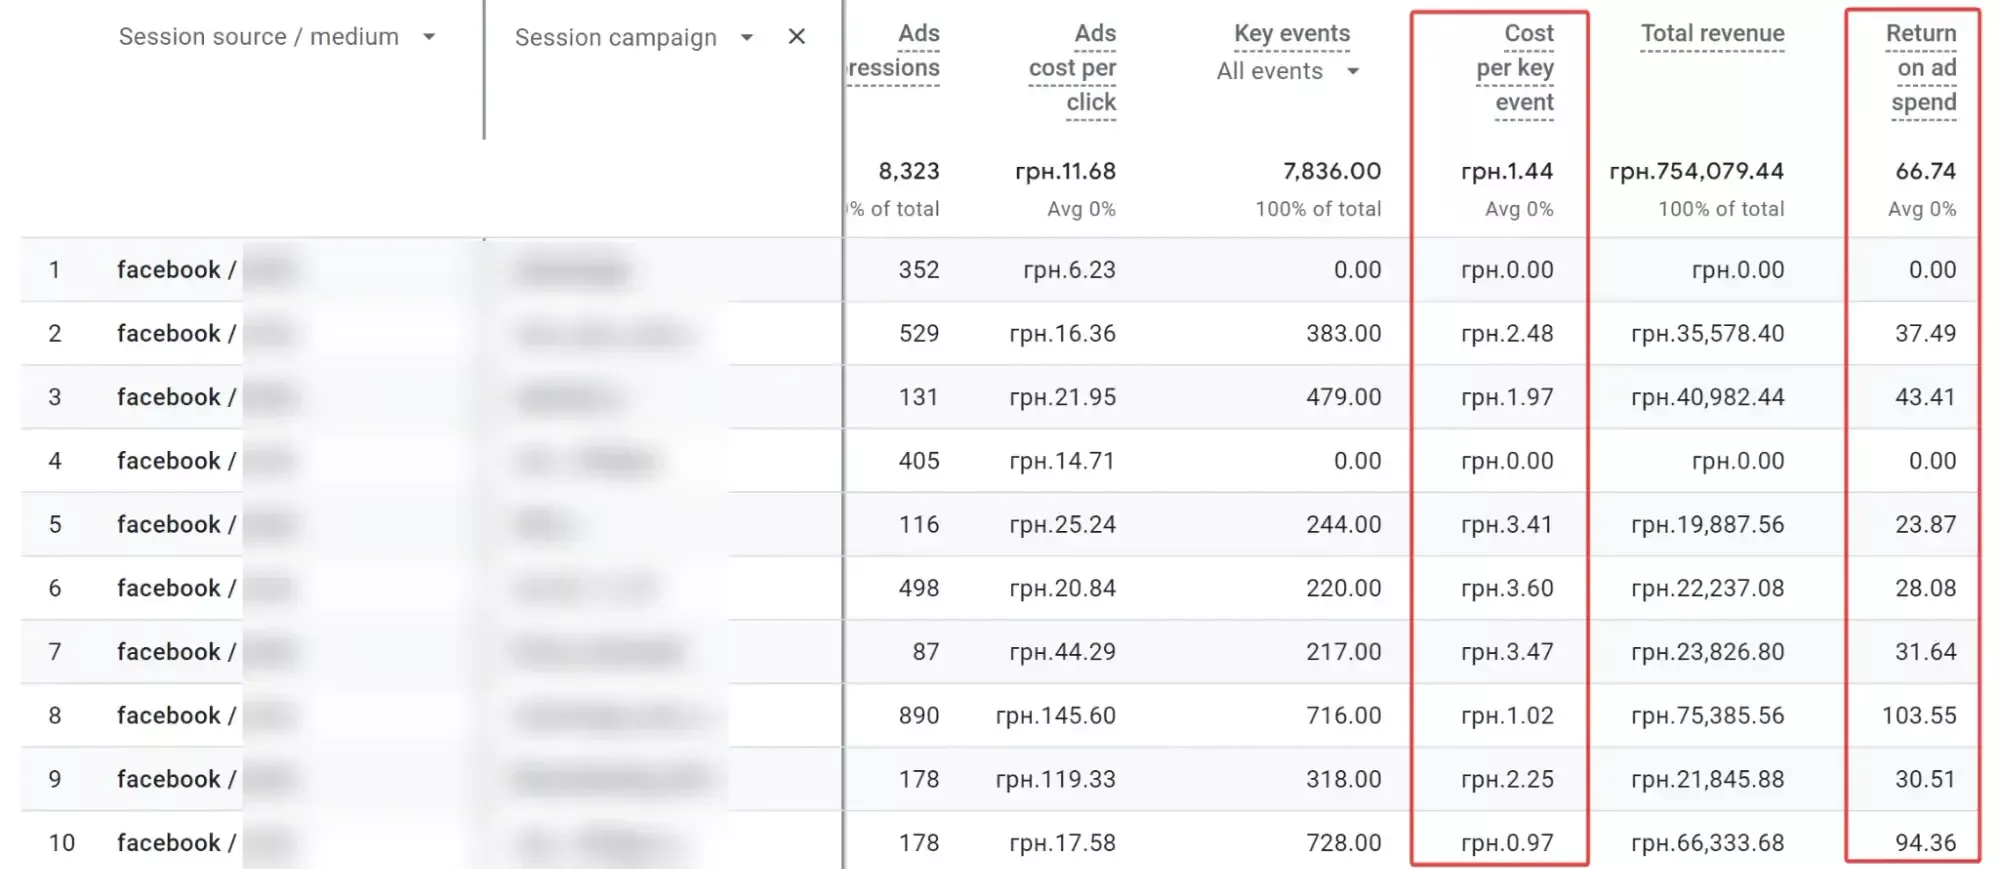
Although GA4 has a data import functionality that allows you to import costs from systems such as Facebook, Bing, etc., the reporting functionality in GA4 is quite limited. Today, a bundle is most often used to build end-to-end analytics: GA4 (raw data) + ad account data + CRM/ERP data > BigQuery > Power BI / Tableau / Looker.
For example, here’s what a report compiled in Google Analytics 4 looks like.
In comparison, here is an example of a Power BI report.
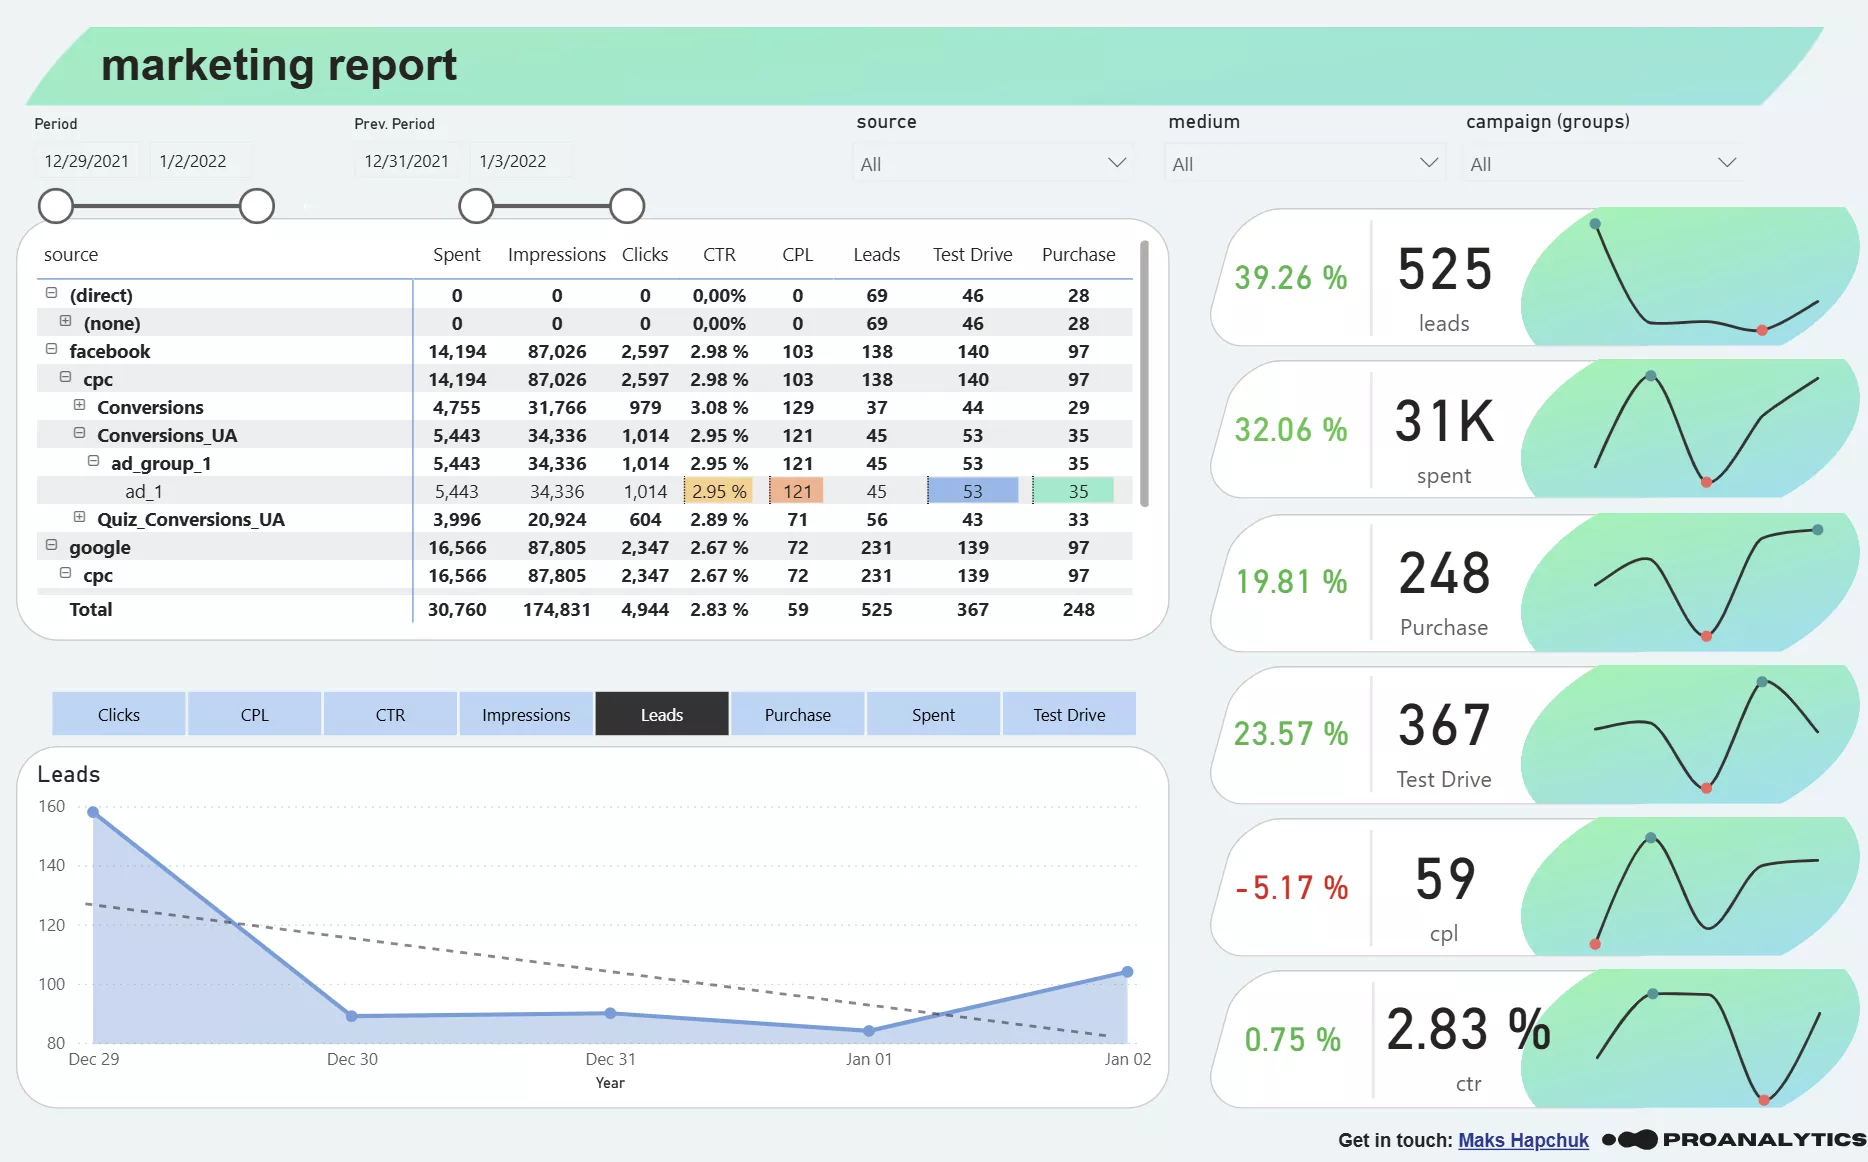
An important clarification: The display option in GA4 is only available this way because we are limited by the interface. In Power BI, however, full customization is possible. The screenshot above is just one example of the many reports my customers use. Other reports look completely different because they are created for specific business needs and tasks.
Funnel analysis and end-to-end analytics aren’t the only approaches to online store analytics, but if you do these two things, you’re halfway there.
Google Analytics 4 and SaaS analytics
Software as a Service (SaaS) is a format in which software is delivered as a service. YouTube, Netflix, Spotify, call tracking systems, online chat systems on websites, and many others you use daily are prime examples of SaaS. While the functionality of these services can vary, they all work according to a very simple principle:
You pay for access to the software, which then allows you to perform certain actions.
For example, you can track call efficiency, provide chat capabilities, or watch videos to relax after a hard day at work.
Since SaaS companies operate on similar principles, SaaS analytics has certain characteristics in common. I’ll break them down into two categories: data analysis and data collection.
Data analysis
In SaaS, it is crucial to attract new users and retain the existing base. There are many other important indicators, but more on that later.
Going back to other types of sites, this does not mean that ensuring repeat sales is less important for online stores, for example. It’s still important, but for SaaS, it’s critical.
In theory, everything is simple: the Acquisition report collection is suitable for analyzing traffic acquisition, and the Engagement overview report or the Cohort exploration section from the Research block is suitable for analyzing retention. But let’s take a closer look.
New user acquisition
Information about new users, as well as the traffic sources they come from, can be obtained from the User acquisition and Traffic acquisition reports. The first one can be found in Reports - Acquisition - User acquisition. It shows you from which traffic source users visit your site for the first time.
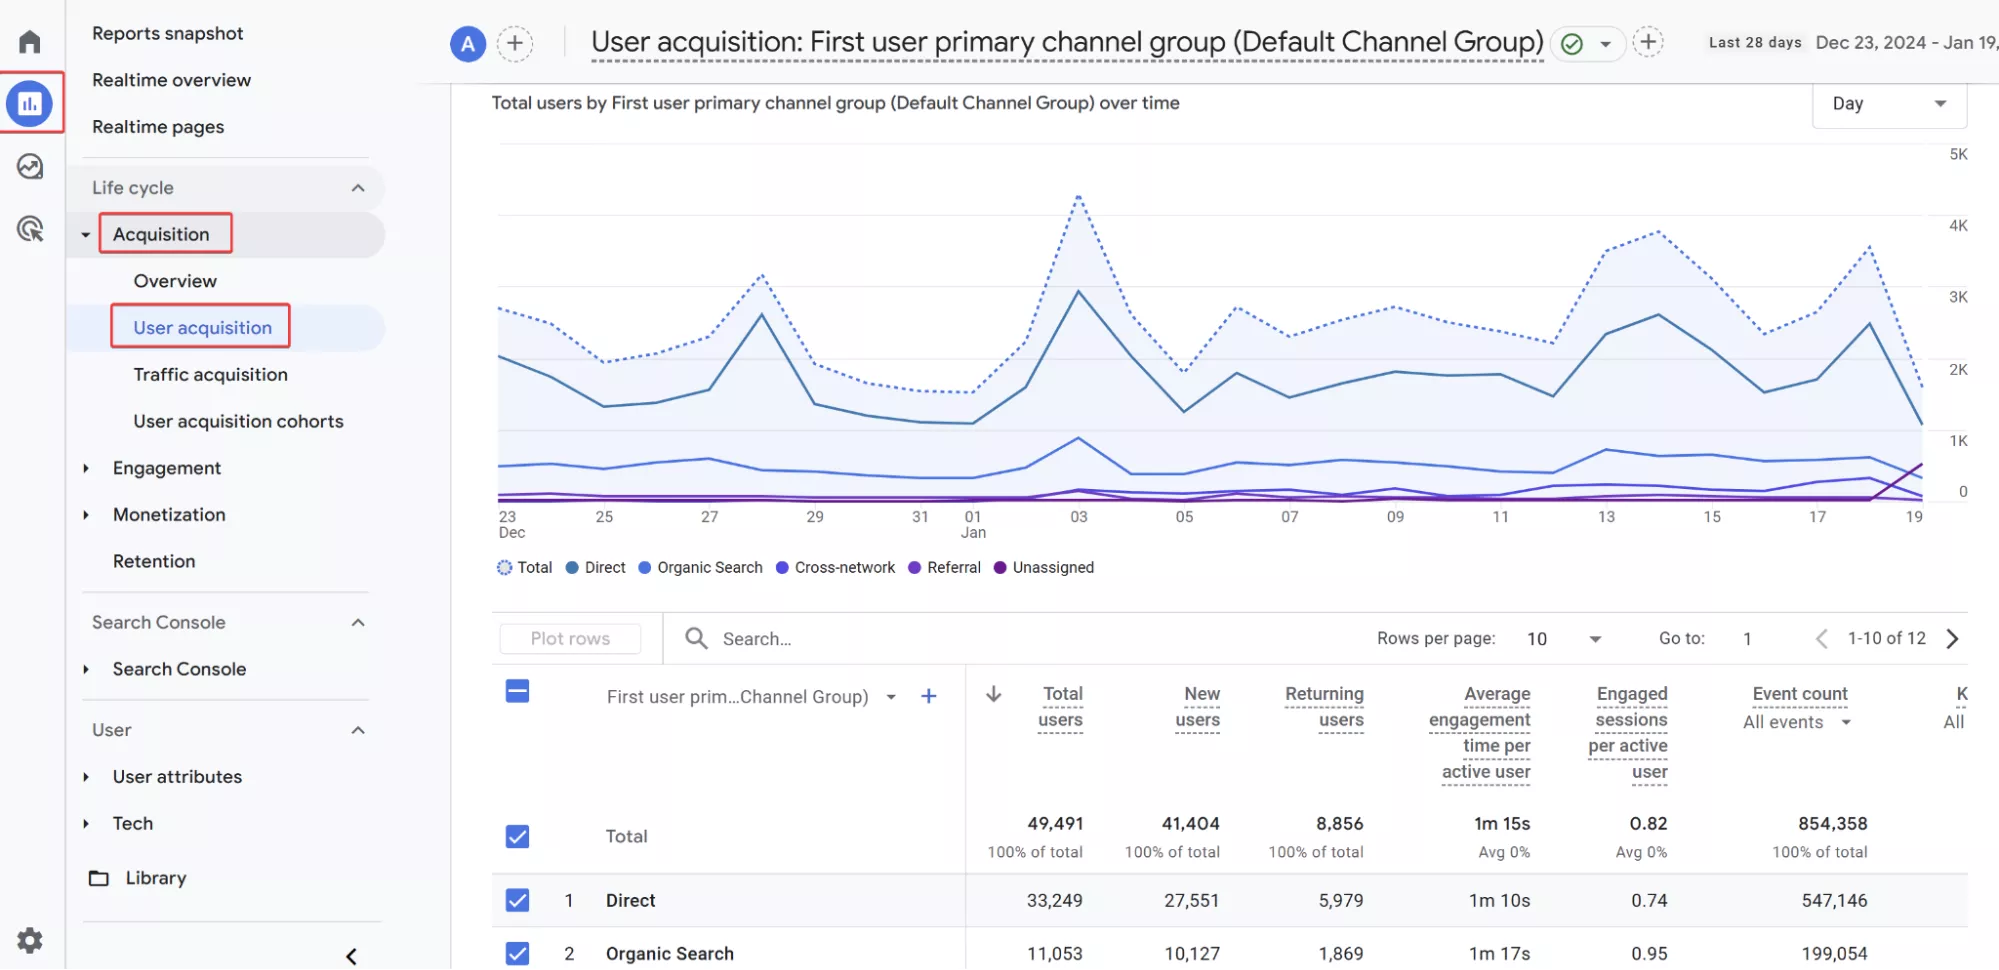
The second one is in Reports – Acquisition – Traffic acquisition. This report can help you determine what traffic sources your product registrations come from. It works by attributing the last indirect click.
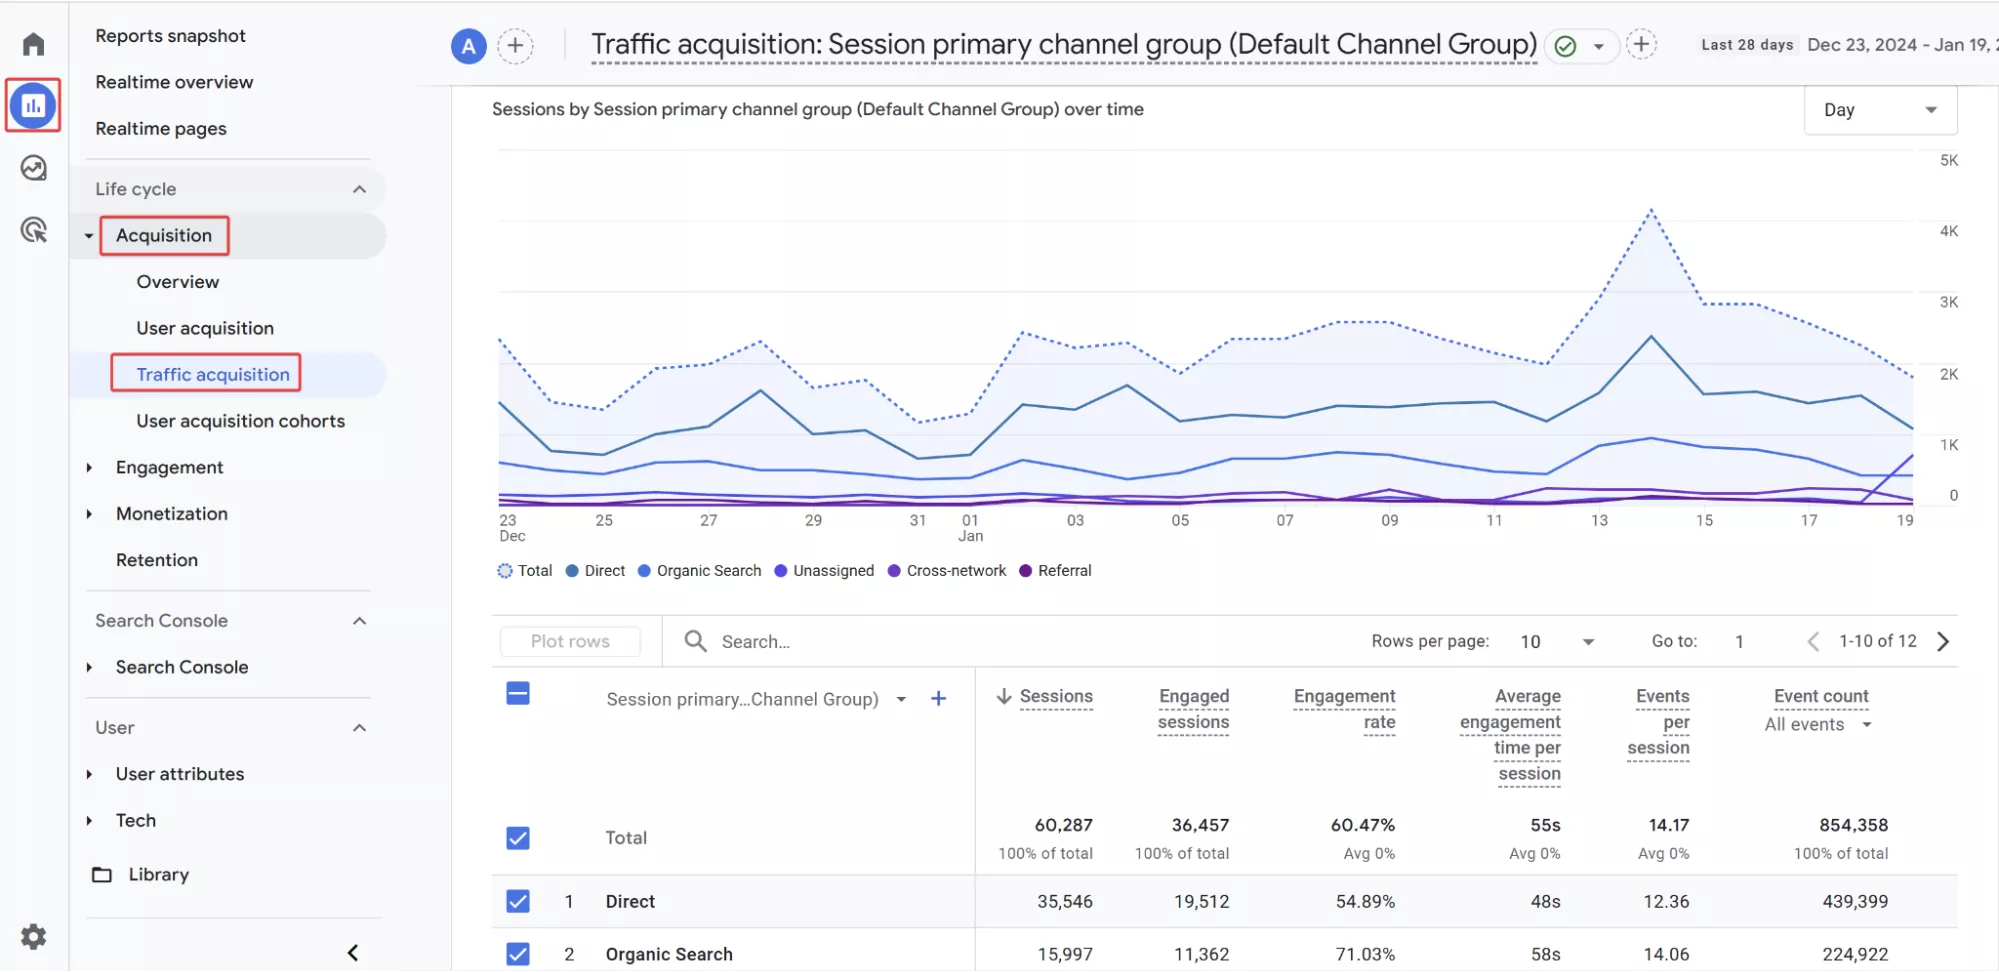
While these reports are good at showing you where new users are coming from, they still probably won’t cover all your needs.
For SaaS businesses, the cost of acquiring a new user is often higher than the cost of their first subscription, sometimes even several times higher.
Let’s take YouTube as an example. Initially, you watch free content, and Google makes money from you through advertising. When you decide to upgrade to Premium, Google offers you a free month, which results in a loss of ad revenue because ads will no longer be shown to you. During that free month, Google spends resources to support you as a user but does not receive revenue.
The same situation can be observed in other SaaS: most of them offer a free trial period, after which the user can stop using the service. Or even a freemium model, where you can use the service for free and for an unlimited time period with certain restrictions. And, as you can imagine, no one compensates for the cost of conditional “servers”.
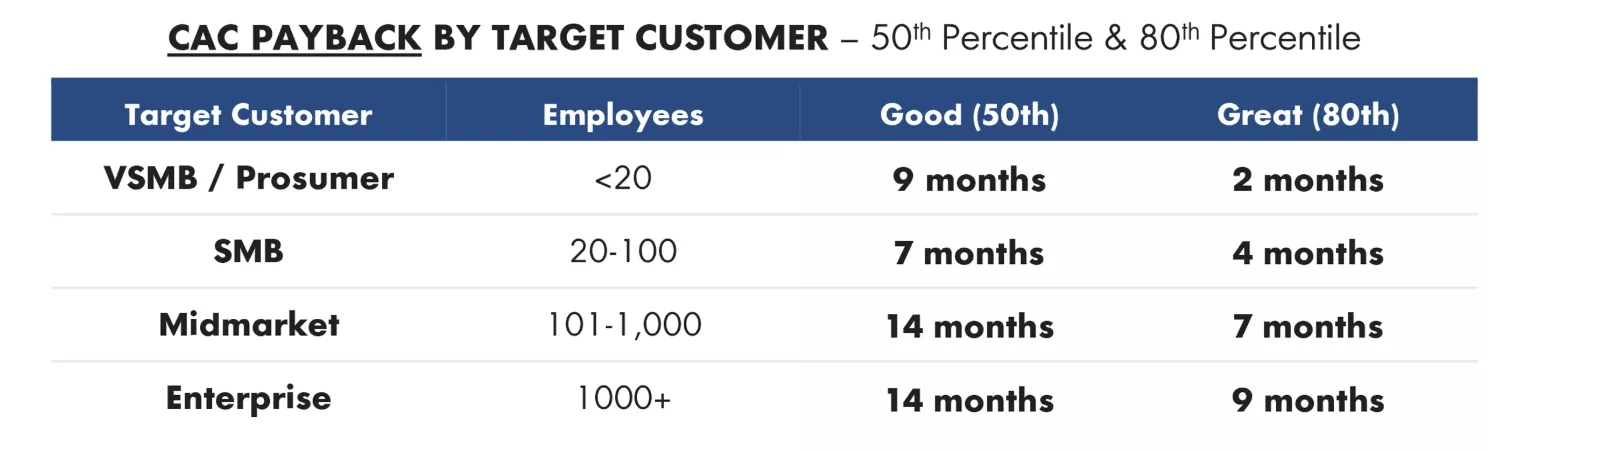
In fact, the cost of architecture in SaaS projects is usually much lower than the cost of acquiring new users. And those marketing costs are much higher than the cost of a monthly subscription. According to OpenView’s 2022 forecast, payback in SaaS takes a few months, and the number of months depends on the size of the company.
Therefore, in SaaS, it is important not only to acquire new users but also to understand and use concepts such as lifetime value (LTV), which is the total value brought by a user, and customer acquisition cost (CAC), which is the cost of acquiring a user. If LTV exceeds CAC, the business is profitable. Otherwise, the business will not last long.
Retaining the existing customer base
Every business can benefit from learning how to work with and retain an existing customer base. But for a SaaS business, it’s not an optional extra — it’s a must. So, let me return to the issue of user retention.
There are two main questions to ask when it comes to user retention:
- How do users interact with the product at present, and how are we retaining them now?
- What can we do to keep them longer?
When it comes to retaining users, I’ve prepared a few questions to help you find solutions:
- What new features can we add?
- How can we improve current functionality?
- What influences our users’ decisions?
- How can we make the plans better value for money for our users?
While there are reports in GA4 that will give you some insight into user retention, it’s usually not enough. That said, cohort analysis and the use of indicators will help you find the answer to the first question:
- Daily Active Users (DAU) is the number of active users per day.
- Weekly Active Users (WAU) is the number of active users per week.
- Monthly Active Users (MAU) is the number of active users per month.
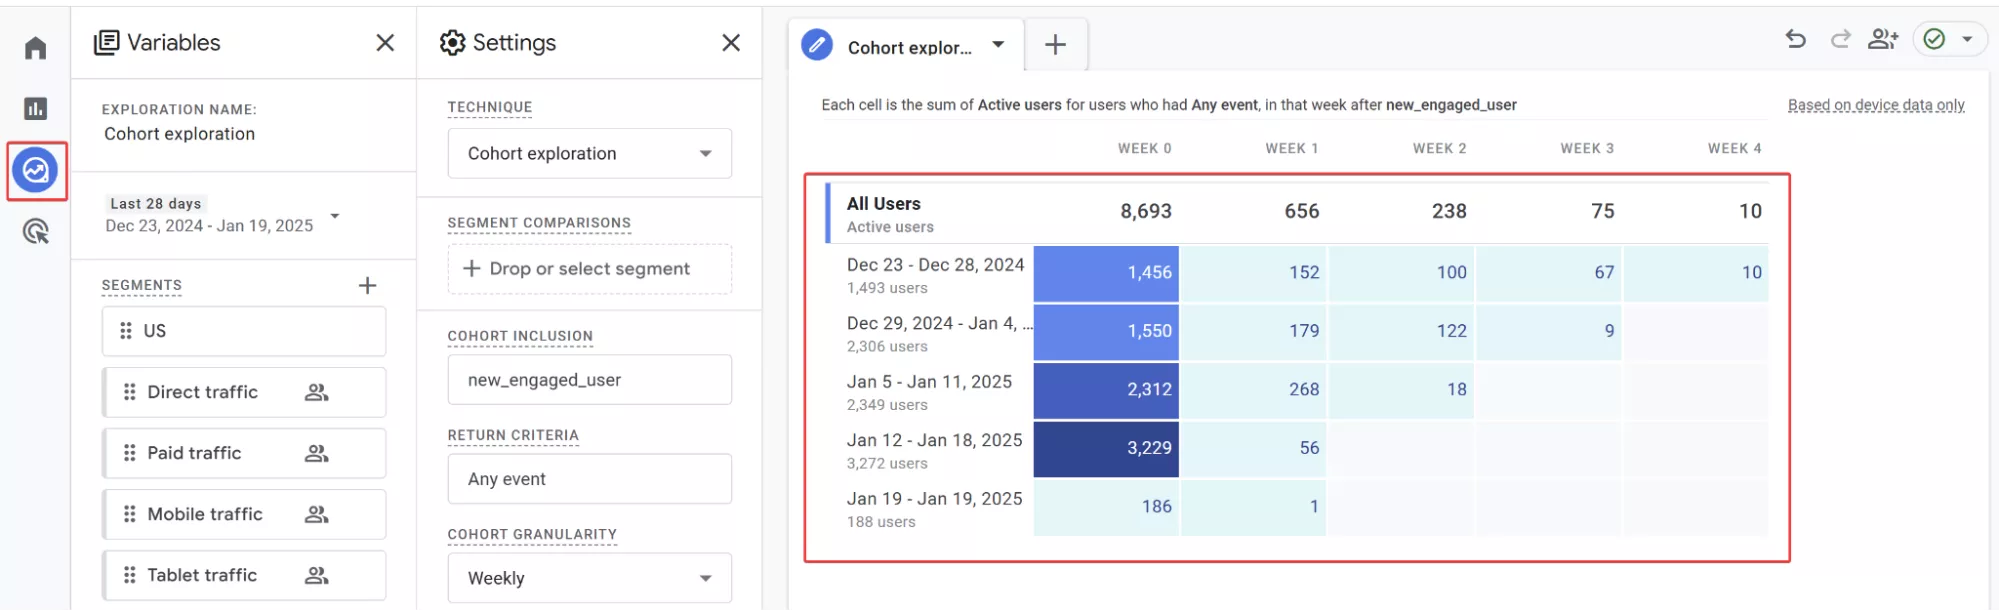
Go to Explore – Cohort exploration to find the cohort analysis section. It shows how different cohorts of your users stay in the product over time.
This is what the report looks like.
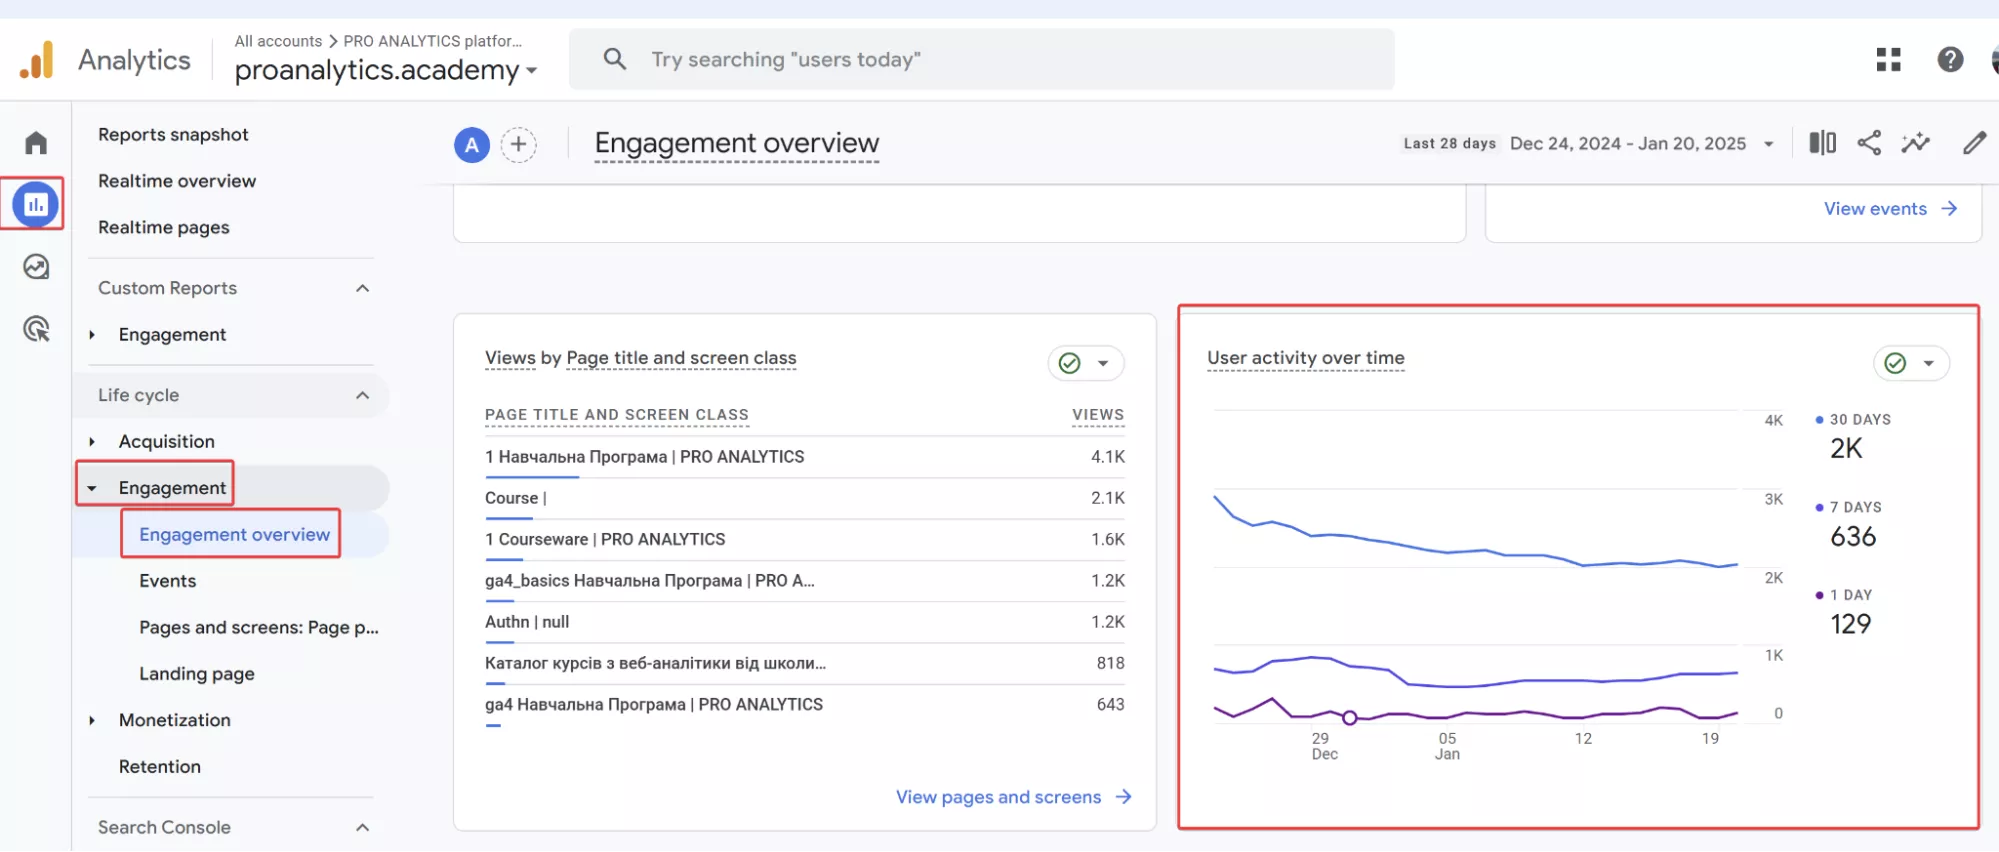
DAU, WAU, and MAU can be found in Engagement – Engagement overview. This report has many visualizations. You need the one in the screenshot.
However, as Boromir said in The Lord of the Rings, “One does not simply walk into Mordor,” or to put it another way, “One doesn’t simply use GA4’s SaaS reports.”
You may have noticed that I’ve covered the metrics for SaaS analysis rather superficially and discussed even less about how to work with them. There are several reasons for this:
- The topic of analytics for SaaS is enormous, and covering it as part of a single article is almost impossible. Recently, a blog post appeared on PROANALYTICS.TEAM, which discusses only the main metrics that SaaS companies should focus on, and that article alone already exceeds 5,000 words.
- For other types of websites, it is somehow possible to manage within the GA4 interface, with some limitations here and there, or even fully solve all tasks in some cases. But unfortunately for SaaS, this is almost impossible.
And no, I’m not trying to say, “If you have a SaaS business, GA4 is not for you”. What I’m trying to say is
If you have a SaaS business, the best solution is to use the combined raw data from GA4 and your internal database.
But as you may remember, this article is about events and reports in GA4 for different types of sites. Therefore, instead of explaining the indicators and examples of their analysis, I will focus on the nuances of data collection in SaaS that make it impossible to cover all your analytical needs with the GA4 interface.
Data collection
There are two main issues here:
- Capturing users from different devices
- Tracking monthly payments
Capturing users from different devices
By default, GA4 identifies users based on cookie information. However, we all know that, firstly, the user can delete cookies, and secondly, cookies can be deleted by browsers such as Safari.
For SaaS, it is extremely important to keep track of the user, at least during the payback period. Since it can take a year or more to reach payback, such an unreliable method of identification is definitely not suitable. GA4 seems to offer a solution: set up user ID transmission.
Indeed, this will help us to better identify the user using the internal user ID that we set. But there is a caveat — some of the data analysis techniques in GA4 cannot work with user ID data. For example, the cohort analysis that SaaS needs so much always shows data based on cookies.
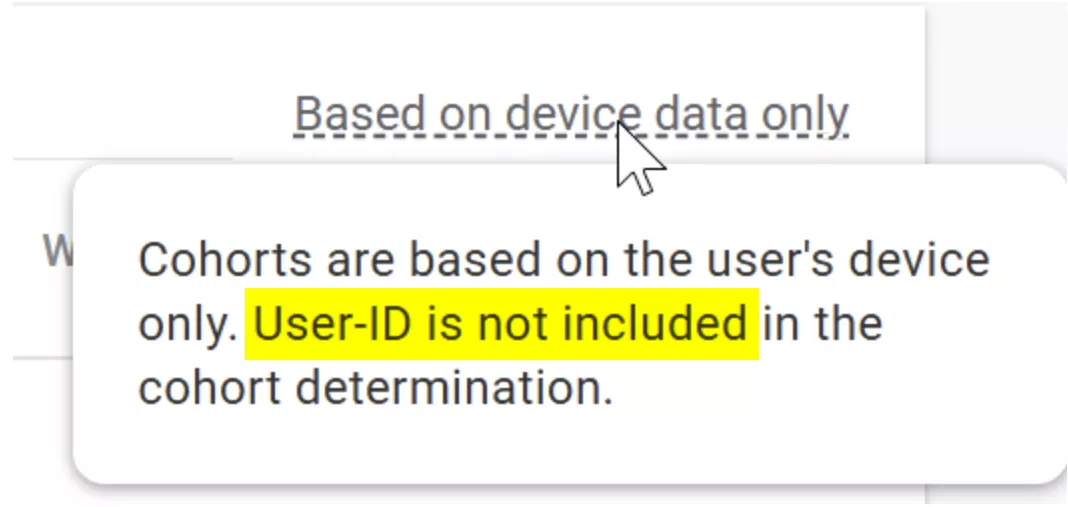
The only thing left to do is to upload the raw GA4 data to BigQuery and build your own cohorts with blackjack and... whatever else you need.
Tracking monthly payments
Since the return on customer acquisition period for SaaS can last several months, you need to collect information about payments over a long-term period. I’ve already explained how to combine user data to easily compile all payments, even if cookies are cleared or the user accesses the site from different browsers.
However, very often, the user may not be on the website or in the app at the time of the monthly payment. They may even be asleep at the time. This means that it will not be possible to transfer payment information directly from the website or app.
In the previous section, I wrote that GA4 can transfer payment data from other systems, such as CRM or acquiring systems, thanks to the Measurement Protocol, but there is a limit of 72 hours. That’s how long you have to add payment information to existing sessions. Now, imagine a simple case using Netflix as an example:
- A user visits the site through a Facebook ad and signs up for a trial. They use the service for an hour, watch an episode of a TV show, and leave the site by closing the tab.
- The next day, they search for Netflix on Google. They go there and continue watching the show. Realizing that they will now visit Netflix every day, the user adds the site to their browser bookmarks.
- Over the next five days, they visit the site from the bookmark.
- On the eighth day, the trial period ends, and they make their first payment.
Remember the 72-hour limit for the Measurement Protocol? Because of this limit, you will not be able to link the payment to the Facebook traffic that first led to the registration and later to the first payment. The fact that the user then came from an organic Google search did not influence their decision to use the service. The user was simply looking for a way to return to the site.
Essentially, the Measurement Protocol is not sufficient for completing SaaS tasks. So again, the solution is to export raw GA4 data to BigQuery to create reports based on it.
Conclusions
- Data analysis for websites should be done based on business goals, not generic templates. Therefore, the choice of events, KPIs, and reports in GA4 should be based on the type of website and its goals.
- The most important landing page indicators are:
- Scrolling depth
- Interaction with page elements
- Percentage of transitions to the target action
In GA4, you can customize the analysis of this data through funnels in the Explore block and through custom events.
- Key indicators for information websites:
- Engagement with content (scrolling + time)
- Number of pages per session
- Interaction rate
- Percentage of repeat visits
All of these indicators are available in GA4, some of them through custom events and cohort exploration.
- Metrics for online stores focus on the stages of the purchase funnel (product viewing, adding to cart, and payment).
These require an e-commerce setup, after which GA4 allows you to create standard Purchase journey and Checkout journey reports. However, for deeper analysis, you will need end-to-end analytics. - Metrics for SaaS products:
- DAU/WAU/MAU
- Cohort analysis
- LTV to CAC ratio
- Link the traffic source to monetization
Some indicators can be obtained in GA4, but a full analysis requires exporting data to BigQuery and using additional BI tools.
- The suggested analytical approaches are not strictly tied to the type of site — SaaS sites can have landing pages, online stores can publish articles, and content projects can have pages with commercial impact. The recommendation is simple: tailor analytics to your business goals, not just the type of site.
- Don’t forget to ask yourself an important question from time to time, not just in your analytics work: Why are we doing this, and what do we want to get out of it? Believe me, answering this question will help you move in the right direction.
The opinion of the author of the guest post may not reflect the position of the editorial board and specialists of Netpeak Agencies Group.

 2
2
 2
2
 0
0
Recommended theme posts
Related Articles
How to Set Up Consent Mode in GA4 on Your Website with Google Tag Manager
Let's explore how to properly integrate consent mode in GA4, configure it for effective data collection, and at the same time comply with GDPR and other legal regulations
Display Advertising Effectiveness Analysis: A Comprehensive Approach to Measuring Its Impact
In this article, I will explain why you shouldn’t underestimate display advertising and how to analyze its impact using Google Analytics 4
Generative Engine Optimization: What Businesses Get From Ranking in SearchGPT
Companies that master SearchGPT SEO and generative engine optimization will capture high-intent traffic from users seeking direct, authoritative answers