What Are Custom Dimensions in GA4, and How Do They Help with Analytics?
Google Analytics 4 not only collects data for marketers and analysts but also structures it for analysis. However, there may be times when standard GA4 metrics about users, products, or services are not sufficient. In such cases, custom reports come to the rescue.
These reports provide data visualizations to help you make informed decisions. They are based on custom dimensions that complement standard information and provide deep insight into audience behavior.
In this article, I'll explain why you should use custom dimensions and provide practical tips for using them to improve your analysis.
Types of dimensions in GA4
Events are the core of Google Analytics 4. Events help you track user actions on your site or app, such as button clicks, page views, form fills, and video views.
If you want to analyze user interaction with a website or application in more detail, you have to set up parameters such as additional event attributes.
GA4 has two types of dimensions: standard and custom.

Standard dimensions
Google Analytics 4 collects and delivers standard dimensions by default, with no additional customization required.
These include the following basic data:
- User IDs
- Information about the device the user is using
- Information about the site content being viewed or used by the visitor
- Behavioral data about the website or mobile application
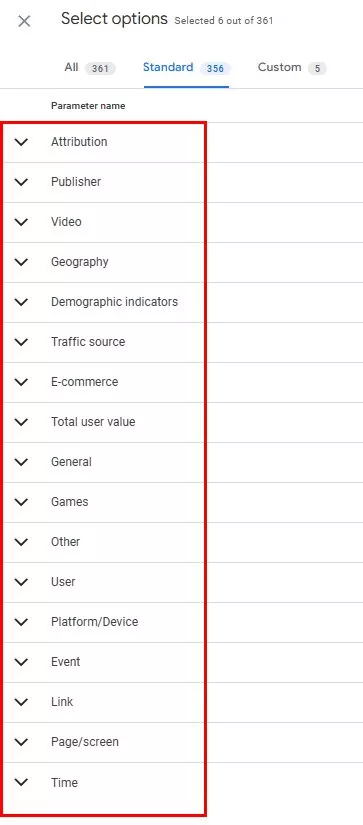
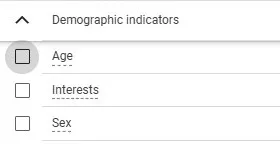
Each category of standard indicators contains several subcategories.
Custom dimensions
Custom dimensions work to supplement automatically collected standard dimensions with detailed information about events. They are manually created and customized to track the data you need.
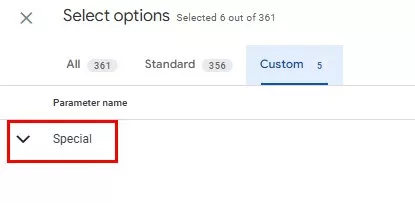
These dimensions have only one category — custom, with subcategories:
Our experts have created a step-by-step guide to setting up custom metrics in GA4 that explains how to collect additional metrics about your website visitors.
What are custom reports?
Custom (detailed) reports in GA4 are manually created reports that help you visualize and analyze important business metrics.
Key features of custom reports:
- Customization. Choose which data to analyze (e.g., page views, traffic sources).
- Filtering and grouping. Set filters to analyze by specific criteria.
- Visualizations. Create graphs, charts, or tables for easy visualization.
- Saving and exporting. Export the created analyses for further use.
To create a report with custom metrics
You can use a blank template, but I recommend choosing the free-form type. It is versatile, easy to put together, and contains almost all the metrics you need.
To get started:
- On the Research tab, select the free form type.
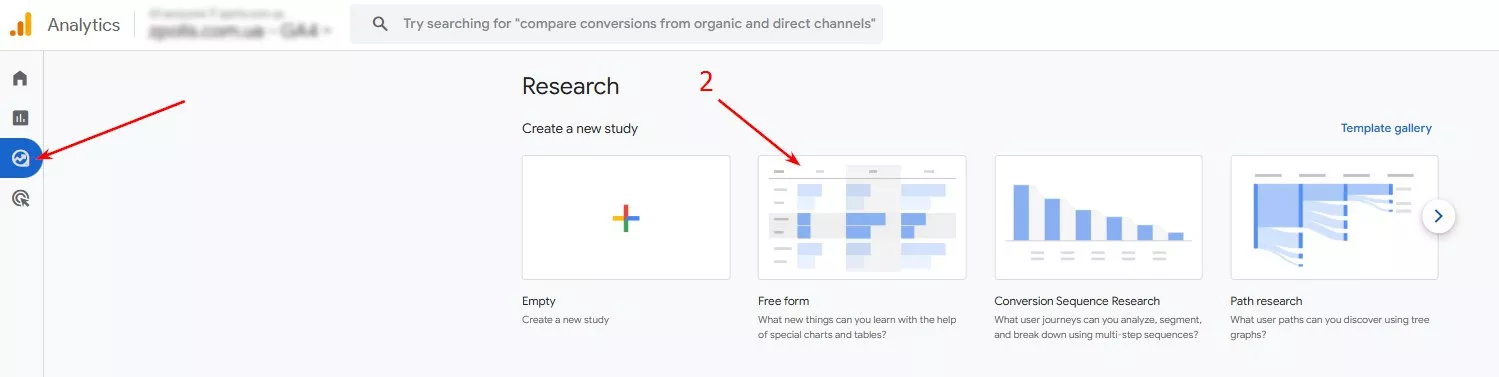
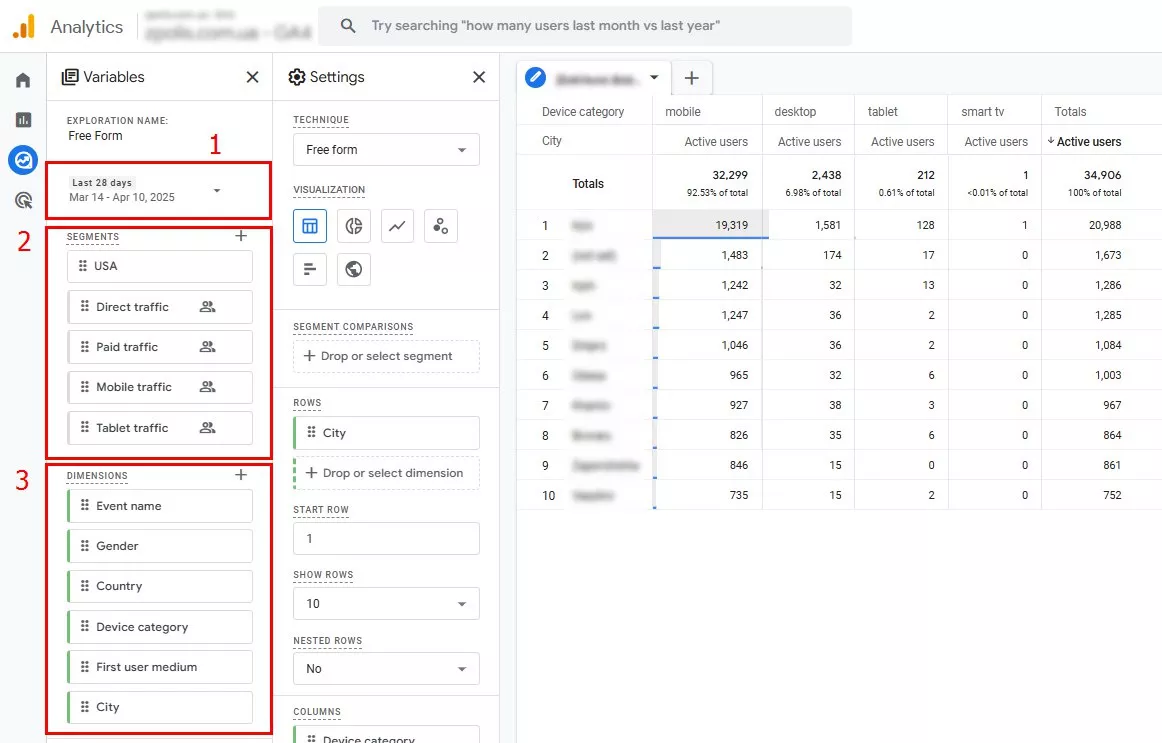
- Set the date range, dimensions, and segments you want.
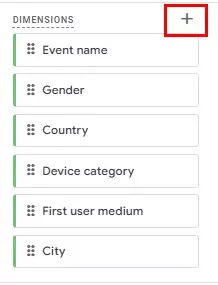
- Click "+" to see the displayed attributes.
Read our guide on how to create a custom free-form report in GA4.
Drag and drop values
Drag and drop indicators into columns or rows to organize and visualize them.
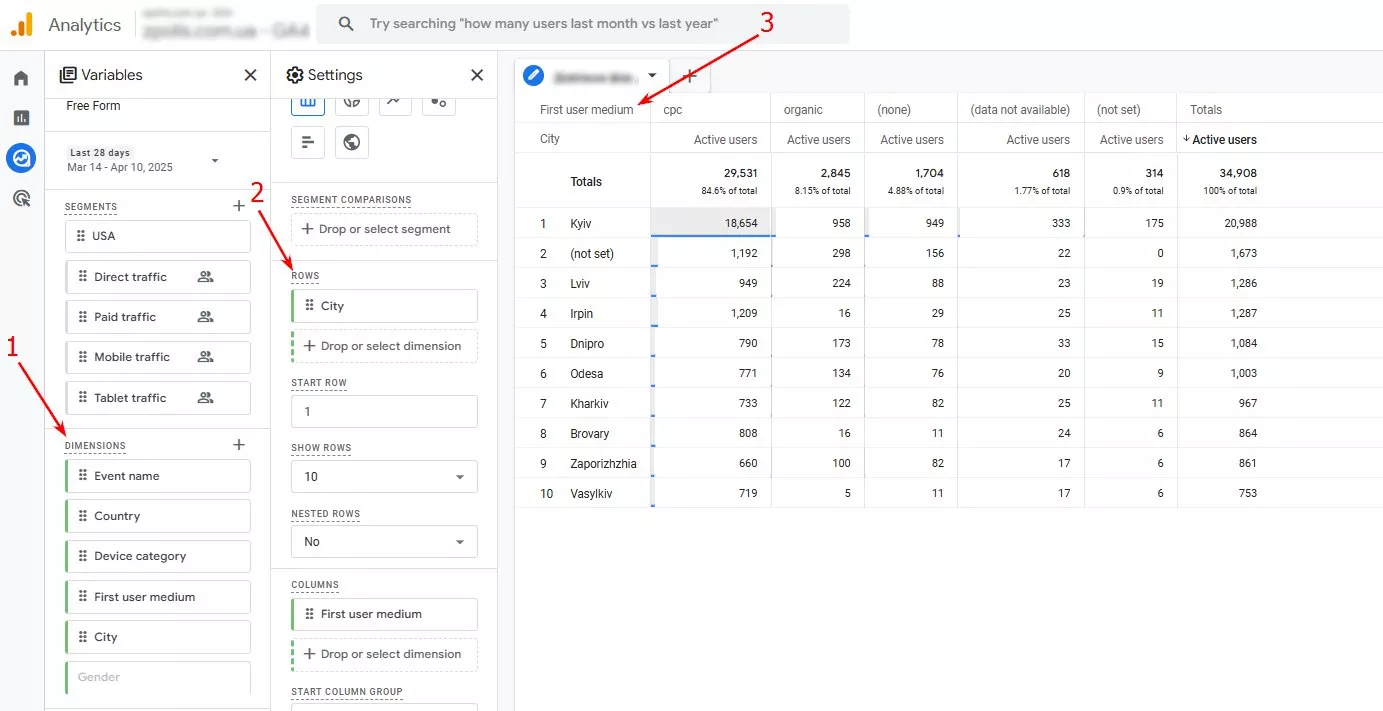
- Select the dimensions you want to use.
- Drag the selected values into the Rows field. A string is generated with information for each element.
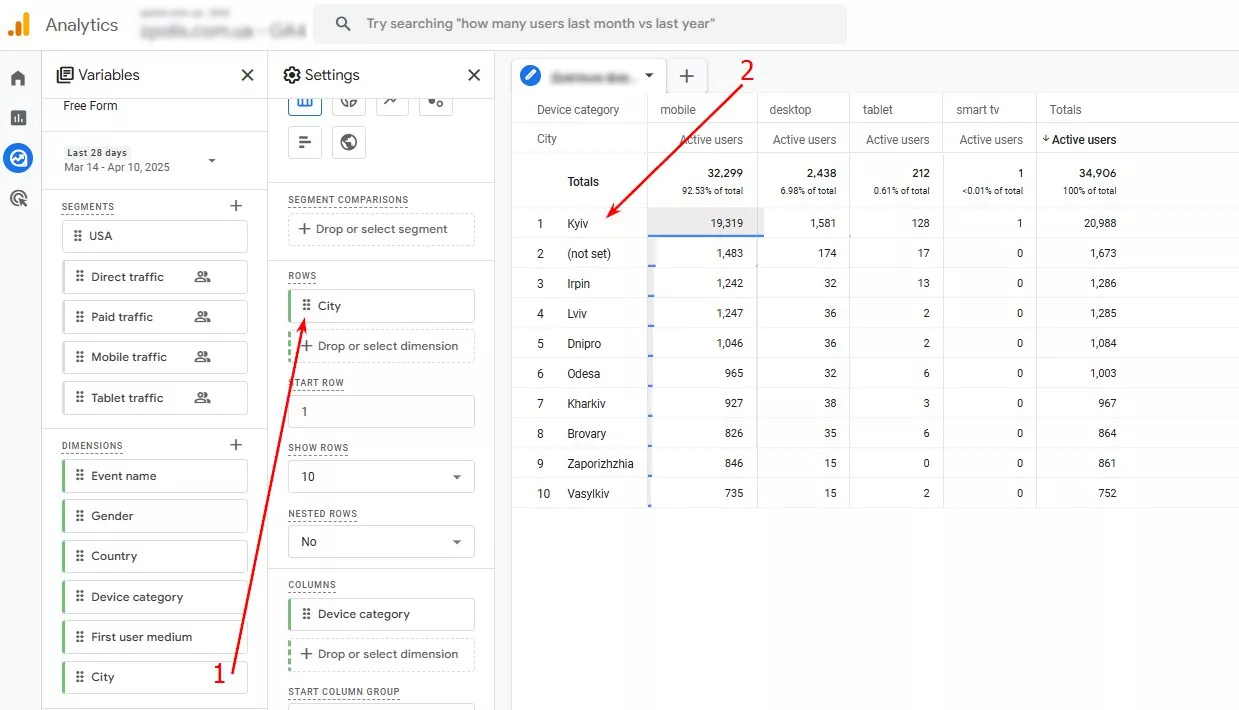
Drag the attributes in the columns to display indicators for each analyzed element (in this case, the city).
- Select the dimensions you want to use.
- Drag the selected dimensions into the Rows field.
- Drag the metric First user source dimension/medium to the columns. You will see the number of active users from each traffic channel for a given city.
Customize the report
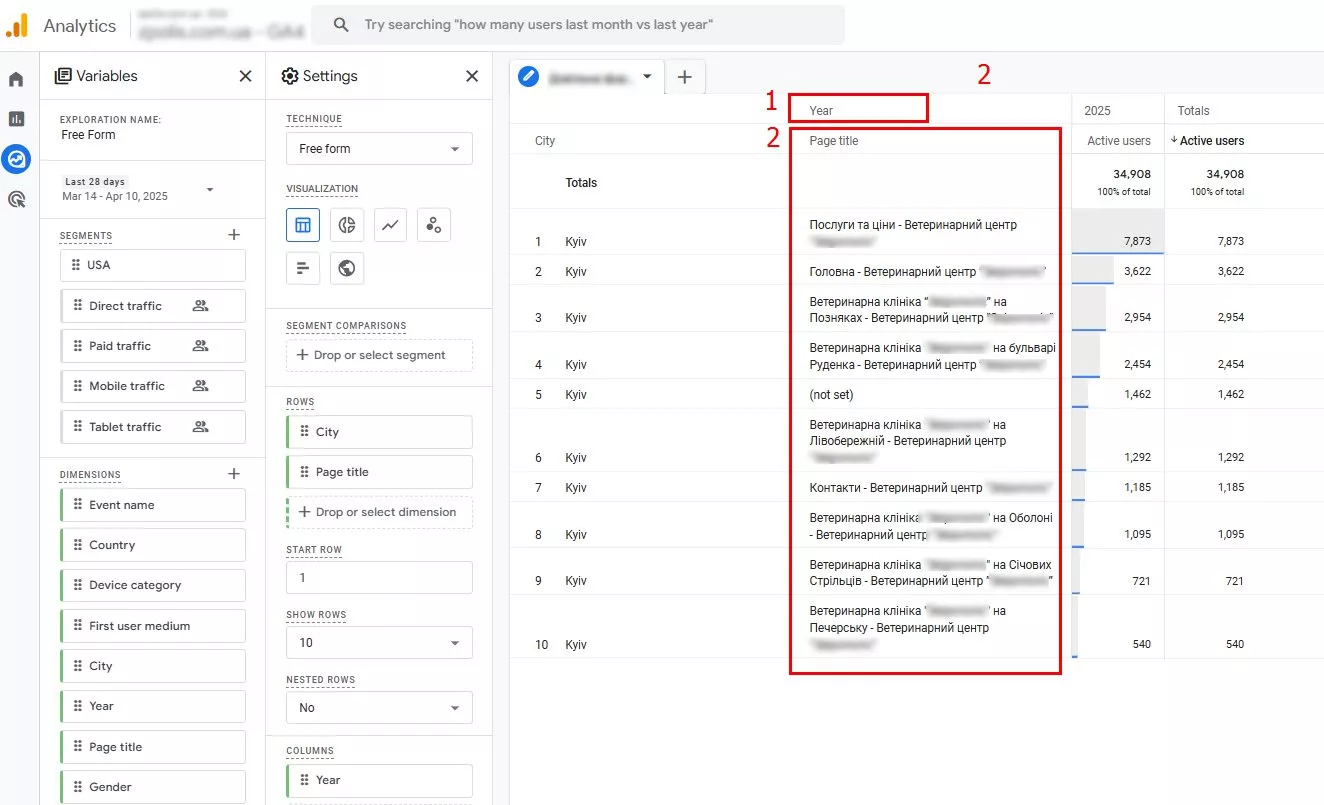
For a more detailed report, add multiple metrics to rows and columns. For example, add metrics to track data by year and page of a site.
- Add a custom dimension called Page Name to the rows.
- Add Year to the columns.
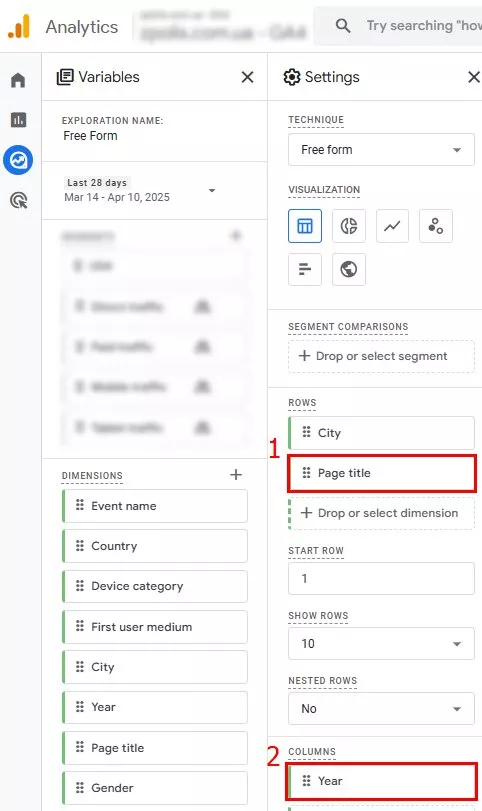
- Apply the settings to create a detailed report.
An example of creating a special report
Before going to a veterinary clinic, pet owners want to get a consultation. The key indicators to track here are:
- Calls. Visiting a page with contact information or making a call is one of the signs of customer interest.
- Form submissions on the website, which allows you to start a dialogue with a potential customer.
To track the number of conversions received over a period of time, you should create a detailed report.
The process is as follows:
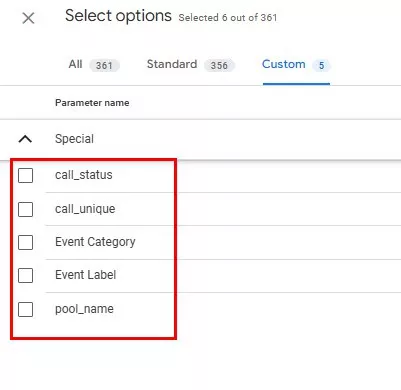
First, preconfigure the custom dimensions you need for your report.
In Google Analytics 4, custom dimensions are additional data that are associated with a user and can be sent with events. They allow you to dive deeper into user behavior, traffic sources, and site interactions.
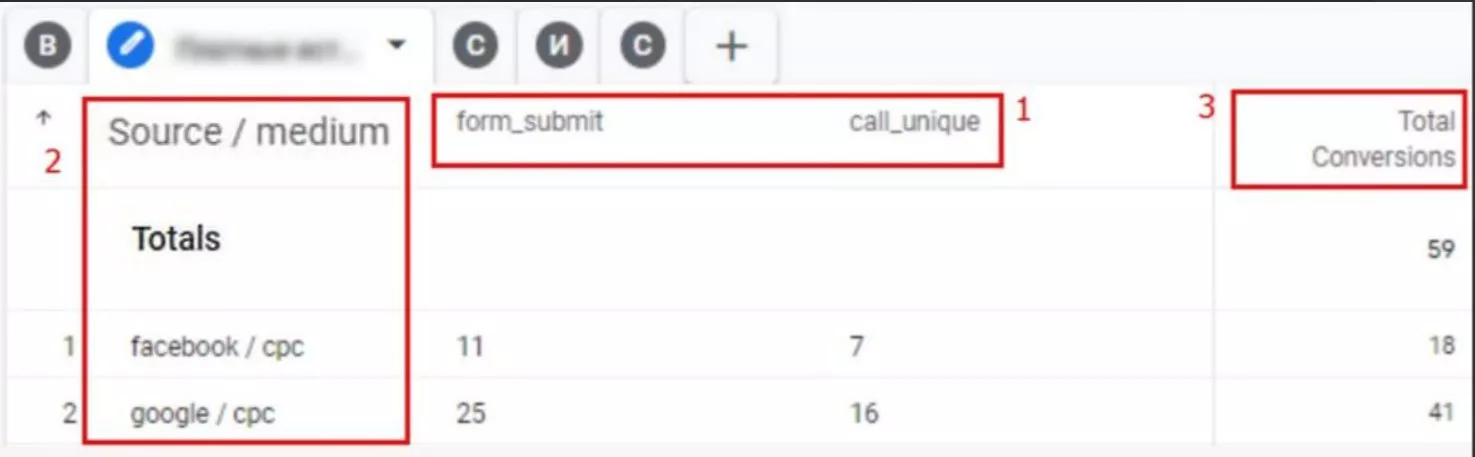
- Add the indicators you want to track to the report.
- Add session source or medium to understand how many conversions each of them brought.
- For clarity, add the calculated indicators as the total sum of all conversions (in this example, call requests and form submissions).
To learn how to create and add calculated metrics to detailed reports, see Google Help.
Conclusions
- Custom reports in Google Analytics 4 are custom tools that allow you to collect and analyze important business data.
- The key features of custom reports include selecting dimensions, filtering results, and visualizing data.
- In GA4, dimensions are additional attributes of events that allow you to dive deeper into user interaction with a website or application.
- There are two types of dimensions: standard and custom.
- By default, GA4 collects and provides standard dimensions without any additional customization.
- Custom dimensions have to be created manually. They complement the automatically collected standard dimensions and provide detailed information about the events you need.

 2
2
 0
0
 2
2
Related Articles
Display Advertising Effectiveness Analysis: A Comprehensive Approach to Measuring Its Impact
In this article, I will explain why you shouldn’t underestimate display advertising and how to analyze its impact using Google Analytics 4
Generative Engine Optimization: What Businesses Get From Ranking in SearchGPT
Companies that master SearchGPT SEO and generative engine optimization will capture high-intent traffic from users seeking direct, authoritative answers
From Generic to Iconic: 100 Statistics on Amazon Marketing for Fashion Brands
While traditional fashion retailers were still figuring out e-commerce, one company quietly revolutionized how U.S. consumers shop for everything from workout gear to wedding dresses