Mobile App Analytics Tool Comparison: Choosing the Best for Your Goals and Objectives
The ability to analyze data about a mobile application is critical to its success. As a result, analytics are becoming an increasingly important element of mobile app marketing strategies.
In this article, I will review five popular mobile analytics services, Firebase, AppsFlyer, Adjust, Amplitude, and Mixpanel, and identify their key features and applications.
Types of mobile analytics
Mobile data analytics apps fall into two types: product and marketing.
Marketing analytics tools focus on traffic source attribution and analysis. They help determine how the app is attracting new users and which advertising channels are most effective. These tools shed light on important metrics, such as conversions and the ROI of advertising campaigns.
Attribution is the process used by marketing analytics tools. It involves determining and assigning a value to specific actions or results from various marketing channels. Attribution helps marketers determine which channels or customer touchpoints contribute to a goal, and they can then evaluate the effectiveness of marketing efforts.
Product analytics tools focus on user engagement and retention. They provide information about user interaction with the app and its popular features, helping you find problems and improve the app.
Using both types of tools provides deeper analysis and, hence, more valuable results.
Discover how Google App Campaign Management Services can help your mobile app reach high-intent audiences across Google's ecosystem.
Marketing analytics
Marketing analytics tools are also known as mobile measurement partners.
A mobile measurement partner (MMP) is a service that collects, organizes, and attributes app data and reports on the effectiveness of a marketing campaign.
The most popular MMPs are AppsFlyer and Adjust, but there are several others, such as Kochava, Branch Metrics, etc. In this article, I will focus on the most common and widely used MMPs.
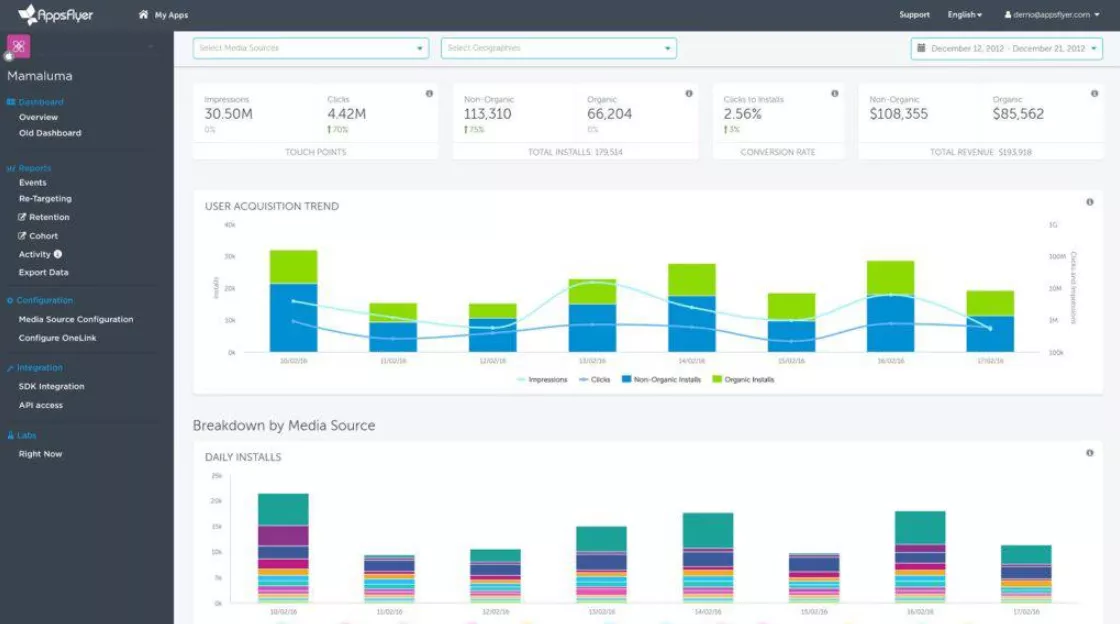
AppsFlyer
This is a data analytics platform with in-depth conversion rate analysis, and cost and ROI reporting. It is suitable for medium and large enterprises, but less suitable for start-ups.
Key features and benefits:
- Integration with multiple advertising partners, especially Google Ads, Meta Ads, and Apple Search Ads.
- Raw data export with API.
- Compatibility with Android and iOS platforms.
- Web2APP — a solution that allows you to redirect users from web pages directly into the app.
- Creation and tracking of deep links that direct users to the optimal section of the app depending on the device and channel.
- Active protection against fraud, including intercepting installs, click spam, and device farms (bots).
- Track installs that result from running TV ads.
- 24/7 email support in Russian, English, and other languages.
- Constant updates and support.
Drawbacks:
- It can be costly.
- It is impossible to create reports based on custom parameters in the interface. To get detailed analytics, it is necessary to use raw data export.
- The free plan does not offer the raw data export module.
- Data describing specific events such as installs, purchases, and website visits are stored for up to 90 days. This limitation does not apply to aggregated data, including aggregated information or summarized statistical results.
- Data availability depends on your account plan.
AppsFlyer has three pricing plans:
The Zero plan is free. During the first 30 days of use, you will have access to premium add-on tools, such as basic LTV (customer value) analysis, ad spend reports, etc.
Limitations: You can analyze no more than 12,000 conversions, and the free version is available for only one year.
The Growth plan is $0.07 per conversion. The plan includes everything in the Zero plan plus mobile attribution, customizable dashboards, cohort reporting, and basic fraud protection.
Cohort reports are a data analysis tool that groups users or customers by a specific criterion and tracks their behavior or metrics over time. For example, cohort reports show how the engagement levels of new users change by month after their first site visit.
AppsFlyer also offers an Enterprise plan, where conversion pricing is calculated on an individual basis. It's a full-service plan with a full range of tools, including cross-platform attribution, A/B testing, enterprise-level fraud protection, and a dedicated account manager.
For more information on pricing, please visit the official AppsFlyer website.
Adjust
Adjust allows you to segment customers, perform A/B testing, and integrate data with BI platforms via API. It is suitable for large projects as well as for agencies where easy integration with partners is needed.
Key features and benefits:
- Access over 1500 advertising partners through its partner marketplace, including Facebook and Twitter.
- Integration with Google Ads, Meta Ads, and Apple Search Ads.
- Raw data export via API.
- Display of key performance indicators.
- Quick audience creation.
- Cohort analysis.
- Active fraud protection.
- Deep link creation and tracking.
- Campaign performance tracking in basic reports.
- Minimalistic interface design.
Drawbacks:
- For low-traffic applications, Adjust may cost more than its competitors.
- For small projects with low subscription costs, only email support works without a dedicated manager.
The subscription cost is calculated individually for each project. There is a free demo version to get you started.
Product analytics
If you want to gain a deep understanding of how users interact with your application, Amplitude and Mixpanel are great choices for product analytics. Both services specialize in in-depth analysis of user behavior and provide tools for creating complex interaction scenarios.
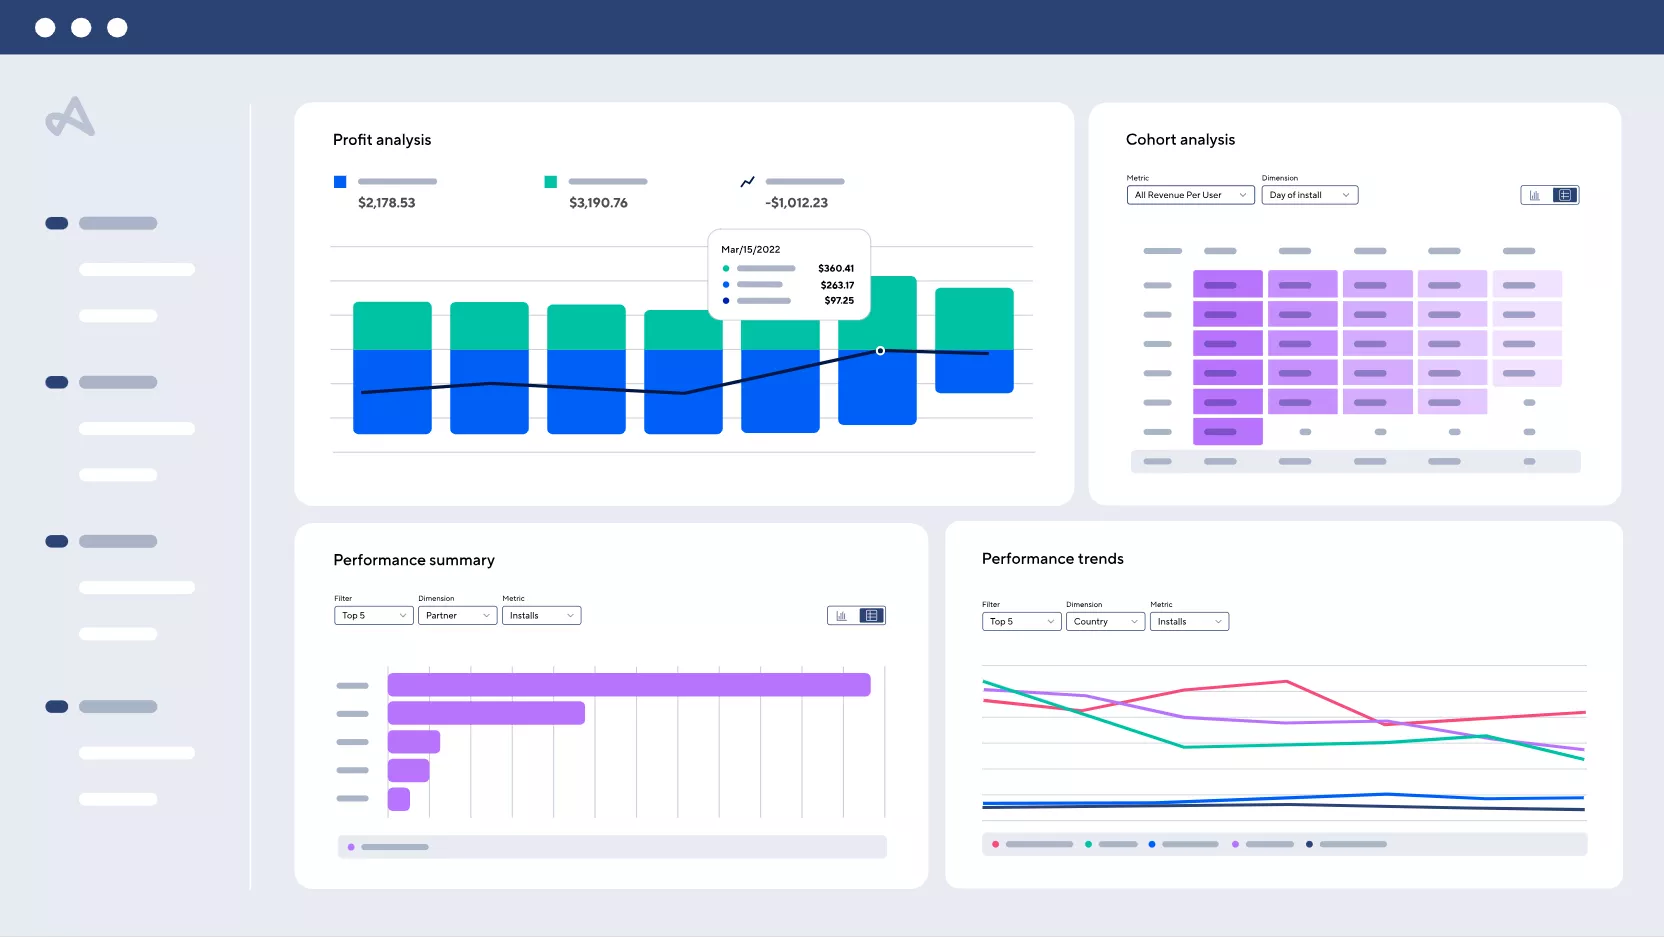
Amplitude
Amplitude enables app developers to forecast retention, visualize interactions, group users by actions, and more. Its product features include real-time analytics, sales funnels, retention tools, detailed user segmentation, and more.
Key features and benefits:
- Easy-to-use interface.
- Customizable monitoring panels and custom dashboards.
- Integration with third-party tools such as Google Ads, Facebook Ads, and AppsFlyer.
- Free raw data export via API.
- Demo access with a test project without connecting your website or app.
- Live chat with a manager in English for premium plan users (Growth and Enterprise) from 4:00 AM to 5:00 PM Pacific Time.
Drawbacks:
- High cost.
- Email support on the Starter and Free plans is only available for critical errors or administrative tasks.
Amplitude has four pricing plans.
Starter. This free plan with no time limit lets you track up to 50 thousand users per month and process up to 10 million events (downloads, link clicks, form submissions, etc.).
It also offers basic analytics charts, teamwork, data scheduling tools, unlimited data sources, unlimited users, and integrations.
Plus. Starting at $49/month, the price depends on MTU, which is the number of unique users who initiate one or more events in the project during a calendar month. You can track up to 300,000 users per month.
The tariff includes everything from the Starter plan, behavioral cohorts, advanced feature management, custom audiences, and synchronization.
Behavioral cohorts are groups of users created based on specific behaviors or interactions with a product or service.
Growth. Priced on a per-user basis, this plan allows you to track an unlimited number of users per month.
It includes all Plus options and provides access to additional Engagement and LTV Revenue reports, as well as analysis of why users exit the funnel. It also gives you access to targeted metrics on events, real-time analytics, and a report to identify specific behaviors desired to achieve the goal.
Startups with less than $5 million in total funding and fewer than 20 employees receive one free year of the Growth Plan. The limit is 200,000 tracked users per month. Visit the official website for details.
Enterprise. This plan is for large companies with complex needs and management tools, and its price is calculated individually. It differs from Growth in that it allows for more precise settings of access rights for user groups and offers support from a dedicated manager.
Detailed information on pricing can be found on the official Amplitude website.
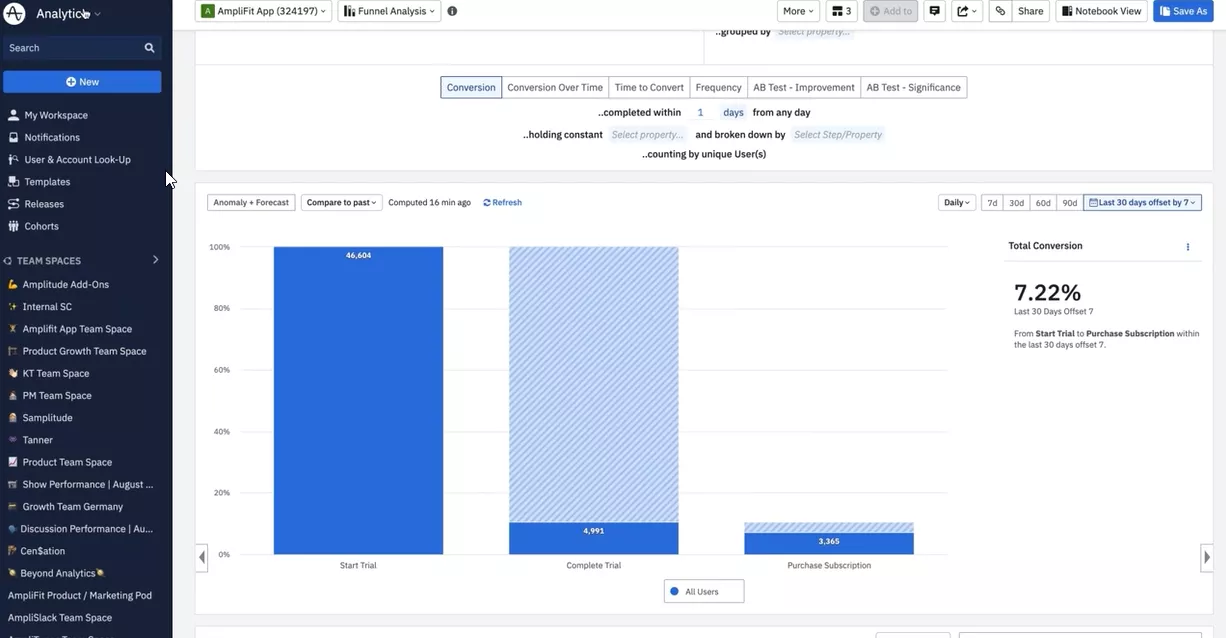
Mixpanel
This service analyzes user paths, behaviors, and monetization. The tool allows you to identify application problems, and prevent user churn, determine the best content, and increase engagement.
After analyzing the sequence of user actions, Mixpanel provides clear reports in the form of graphs and charts.
Mixpanel is suitable for medium- and large-sized companies that are actively using web analytics, and building and tracking sales funnels.
Key features and benefits:
- Custom dashboards.
- Cohort analysis.
- Real-time event tracking.
- Export raw data via API.
- A/B testing and results analysis.
- Integration with Google Ads, Facebook Ads, AppsFlyer, and Adjust.
- Notification feature when a certain metric is reached.
- Tracking a single event or a series of events (funnel).
- Live chat and a dedicated manager with the Enterprise plan.
Drawbacks:
- Costly.
- Basic email support is in English.
- The server side uses a database different from traditional relational databases (NoSQL), which can cause difficulties when processing large fragments of structured data.
Mixpanel offers three tariff plans:
Starter. A free plan that processes up to 20 million events per month. Available features include all basic user journey analysis report types, templates, and unlimited integrations.
Growth. Starting at $20/month, this plan includes all Starter options in addition to unlimited saved reports and cohorts, advanced team access controls, and the ability to convert data without code and save converted formulas.
Enterprise. Starting at $833/month, the Enterprise plan gives you all Growth plan features, plus advanced data management tools, quick login settings for new users on the team, live chat support, and a dedicated manager.
Startups younger than five years with up to $8 million in total funding can get the first year free with Mixpanel Growth or Enterprise plans.
For more information on pricing, please visit the official Mixpanel website.
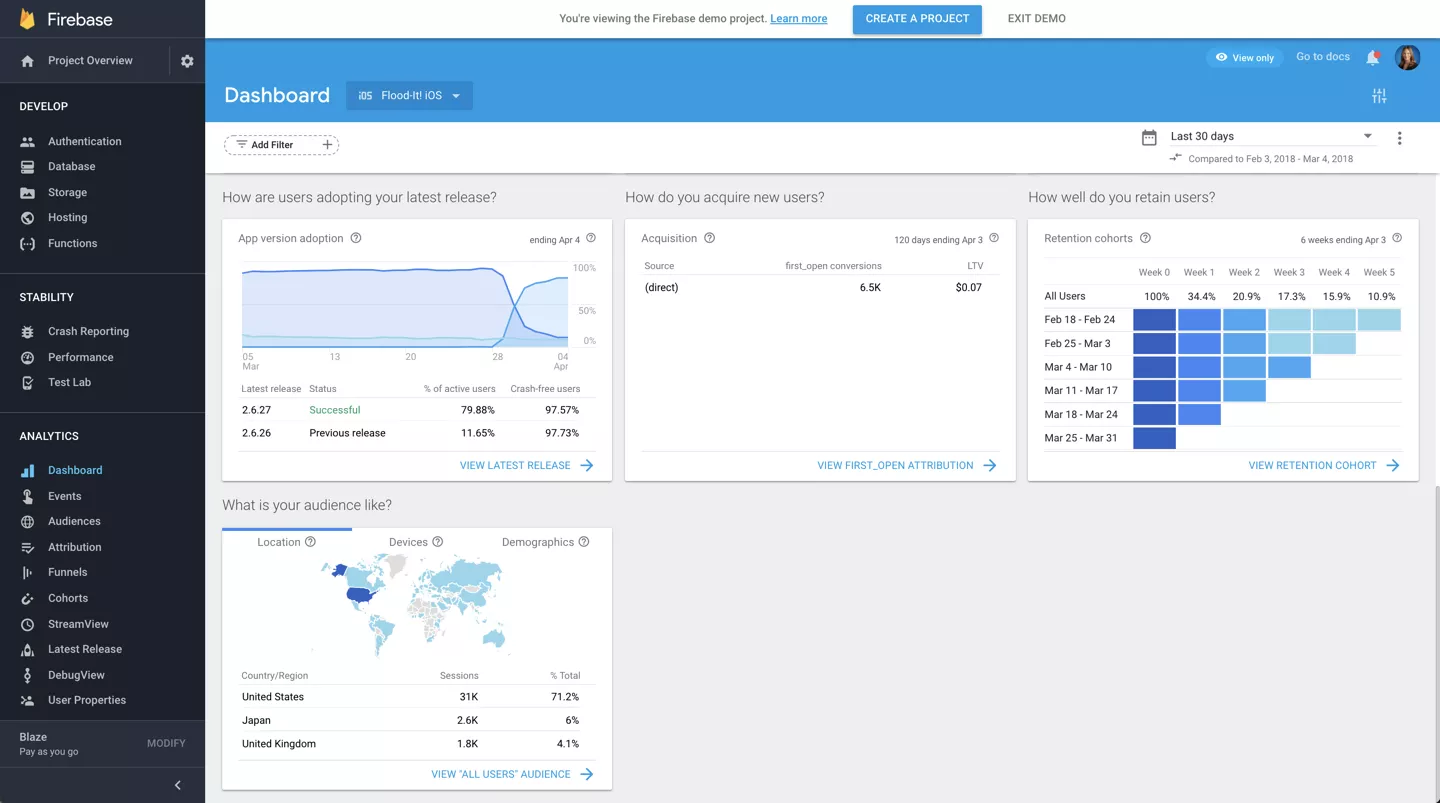
Firebase
Firebase is a tool for both developers and marketers. It allows for deep tracking of events, conversions, and user interactions, and covers both product and marketing analytics.
Thanks to the extensive functionality of the free version, Firebase is suitable for startups as well as companies that only run Google ads.
The free version includes key features such as event analysis, notifications, A/B testing, and more.
Key features and benefits:
- Deep integration with Google products, including Google Analytics 4, which gives you access to a custom reporting tool.
- Free raw data export to Google BigQuery, a cloud store that lets you quickly process queries on large data sets.
- Reports on potential application testing failures in Firebase Test Lab, which includes videos for specific test cases.
Firebase Test Lab is a cloud-based infrastructure that allows you to test your application on a variety of devices and configurations to better understand how it will perform in the hands of real users..
- Application performance monitoring provides insight into the performance characteristics of Apple, Android, and web applications.
- Debug Mode. DebugView in Firebase allows you to view the raw event data of your application. This is useful for identifying bugs, monitoring the accuracy of event logging, and monitoring user characteristics.
- Fast technical integration with the application, making it convenient for GA4 users.
- Support through the Google Cloud console with target response times of 15 minutes or more. More details are on the Google Cloud page and in the Firebase guide.
- There are Firebase communities on Stack Overflow, Slack, and Google Groups.
Drawbacks:
- Limited set of basic reports and no detailed reports on user sessions in the application.
- Integrates with only one advertising partner: Google Ads. Data from Meta, for example, is included in reports, but it is severely underreported and most are marked as direct from source.
- No assigned project manager. Email support is only available in English during US Pacific business hours.
- The Firebase dynamic link service will be discontinued in 2025.
Unlike AppsFlyer and Adjust, Firebase tracks more conversion events than them. However, Amplitude and Mixpanel provide ready-made modules for calculating product metrics; Firebase requires you to develop and design reports yourself.
Firebase also has a paid version. It is suitable for production applications that require more resources, such as databases, hosting, notifications, and other features.
The analytics module is free, but there is a limit of 500 different events per day for each mobile application user. The free functionality is usually more than enough for analytics purposes.
For more details on pricing, please visit the official Firebase website.
Analyzing the right metrics is critical to success. With professional Marketing Analytics Services, you can uncover insights that drive better decisions and stronger ROI.
So how do you choose the right service?
-
Define your goals. If your goal is to improve the application itself, its usability, and user retention, you need product analytics tools. But if your goal is to analyze the results of an advertising campaign and increase the efficiency of the promotion, you need marketing analytics.
- Determine your budget. Firebase is an attractive choice for startups and small businesses because of its free basic plan. Other services don't offer the same functionality at entry-level plans but exceed Firebase's functionality at higher plans.
- Analyze the integrations. Will the chosen service be compatible with the tools you already use? If so, it will allow you to create an end-to-end analytics basis.
With Firebase, Amplitude, and Mixpanel, you can easily export data using the built-in functionality. The API integration is free in Adjust but a paid module in Appsflyer. Keep this in mind when making your decision.
Choosing the right mobile analytics service depends on your specific needs and business strategy. Here are a few examples.
- Your project is an e-commerce application. You need marketing metrics to evaluate the effectiveness of advertising campaigns and conversions, as well as product analytics to optimize the user experience and increase revenue.
If it is within budget, a combination of Adjust or AppsFlyer and Amplitude is the best way to accomplish these tasks. - Your project is a social photo-sharing platform. You need data on the advertising effectiveness to attract new users and understand their interaction with the application. You also need both marketing and product analytics, and UI functionality is not a top priority.
If the project has a moderate budget, I recommend a combination of Adjust or AppsFlyer combined with Firebase. - Your project is a task management and scheduling application. Basic analytics are needed to evaluate its usage.
Since the project has a limited budget and basic needs, a free Firebase plan is a good option.
To help turn those analytics insights into strategic growth, consider our Mobile App Marketing Services. We focus on campaign alignment, creative optimization, and performance tuning—all based on your app’s data and objectives.
Conclusions
- Your choice of mobile analytics service depends on your individual app goals and overall marketing strategy.
- If your primary goal is marketing analytics, consider AppsFlyer or Adjust. For product analytics, consider Amplitude and Mixpanel.
- Firebase is great for startups and small businesses because of its free basic plan.
- Firebase, Amplitude, and Mixpanel have a simple data export option. API integration is free in Adjust, while AppsFlyer has a paid module.
- If the budget is sufficient, it is better to combine paid plans from different products and marketing analytics services. If your budget is limited and you need only basic analytics, Firebase is an excellent choice.
If you’re looking to improve your app’s performance and maximize conversions on mobile devices, consider working with a specialized Mobile Conversion Rate Optimization Agency that can help you turn visitors into loyal customers.

 5
5
 0
0
 0
0
Recommended theme posts
Related Articles
How to Set Up Consent Mode in GA4 on Your Website with Google Tag Manager
Let's explore how to properly integrate consent mode in GA4, configure it for effective data collection, and at the same time comply with GDPR and other legal regulations
Display Advertising Effectiveness Analysis: A Comprehensive Approach to Measuring Its Impact
In this article, I will explain why you shouldn’t underestimate display advertising and how to analyze its impact using Google Analytics 4
Generative Engine Optimization: What Businesses Get From Ranking in SearchGPT
Companies that master SearchGPT SEO and generative engine optimization will capture high-intent traffic from users seeking direct, authoritative answers