The Beginner's Guide to SEO Analytics
SEO analytics is an integral part of any website optimization strategy. It involves collecting, analyzing, and using data to improve the visibility of a resource in Google, Bing, or other search engines.
This article contains a detailed guide to SEO analytics for beginners. In it, I will discuss which metrics are important to track, how they work, and how they are useful.
The main goal of SEO analytics is to understand how users find and interact with a website. Google Analytics (GA4) and Google Search Console (GSC) are the two main tools typically used to perform SEO analysis.
Google Analytics (GA4) is a free service that allows you to analyze user behavior on a website, collect traffic and conversion data, and track user interaction with a website or application.
Google Search Console (GSC) is a tool that helps webmasters control how their websites appear in search results. It provides information about page indexing, search query performance, and other aspects that affect search engine optimization.
How does analytics improve SEO?
- Make objective decisions. By tracking key metrics, you will get accurate data on the effectiveness of your SEO strategy. This allows for objective and informed decision-making.
- Understand your audience. Analytics can help you optimize site content and structure to attract targeted traffic and improve the user experience.
- Identify trends and changes. You can track changes in user behavior and search algorithms, respond quickly, and adapt your SEO strategy to stay competitive.
- Impact on conversions and revenue. Conversion reports show how SEO affects sales and other conversion goals. They can help you assess the true contribution of SEO to your business and confirm its effects on your marketing efforts.
- Perform technical optimization. SEO analytics can help you identify and fix technical issues, such as slow-loading pages or indexing errors.
To build a truly effective SEO strategy based on data and technical resilience, we recommend using our SEO Strategy Services. This will help you create a comprehensive plan aligned with your business goals and competitive landscape.
Let's take a closer look at the specific metrics and how to interpret them.
Users and New Users
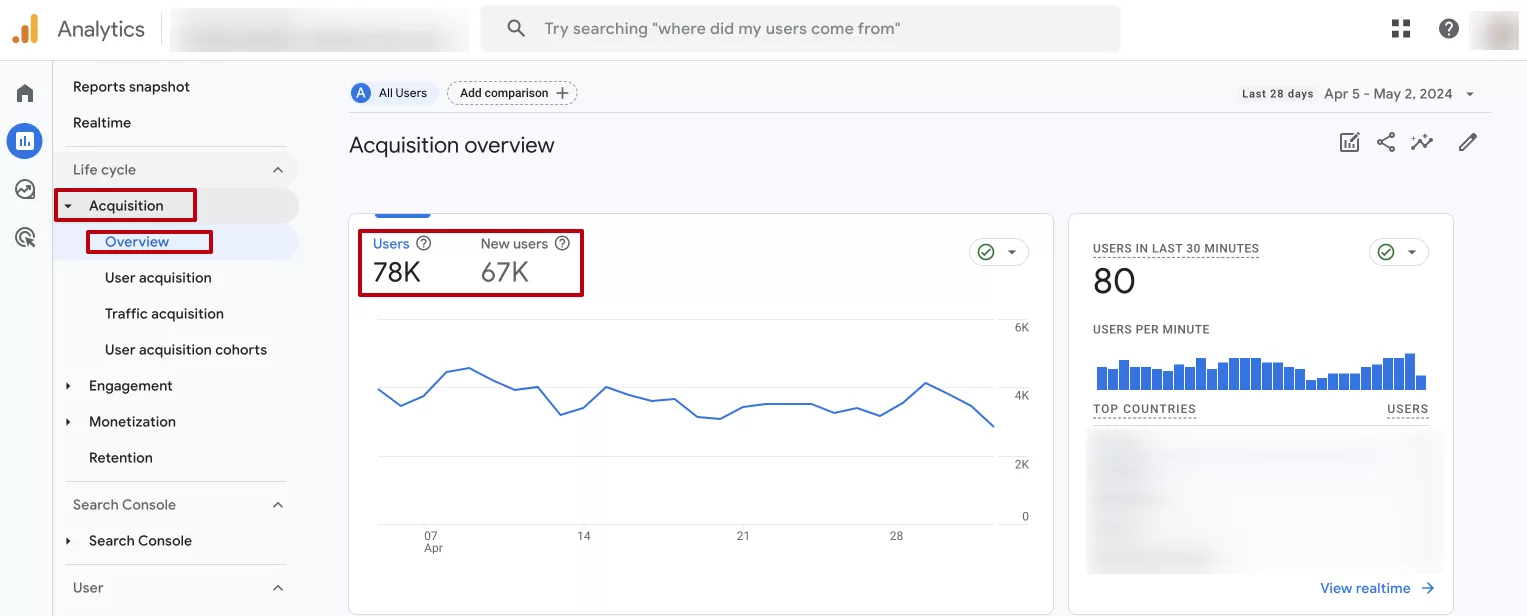
The users and new users metrics provide a clear picture of the effectiveness of the strategy:
- Evaluate content engagement. The number of new users reflects how effectively content is attracting the attention of new visitors. This will help you measure the success of SEO in attracting the target audience from organic search.
- Determine the stability of audience retention. The users metric shows the total number of unique visitors. It allows you to understand how effectively content updates and improved navigation help keep visitors on the site.
- Monitor changes in traffic. The growth in the number of new users indicates the success of the SEO strategy: an expanded and clear site structure, high-quality commercial and informational content, an intuitive interface, adaptability to mobile devices, etc.
Explore our glossary for essential web analytics definitions to sharpen your data insights!
Organic search traffic
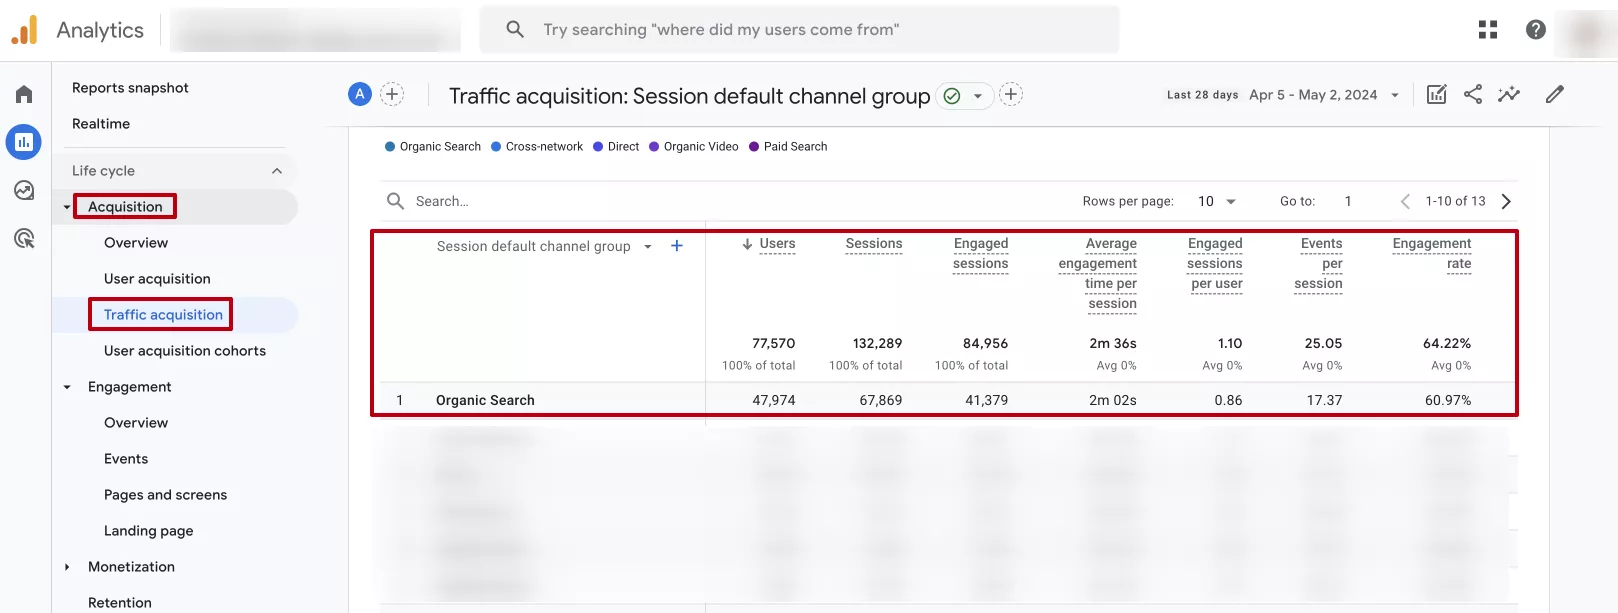
Organic search traffic is one of the most important SEO metrics. This is the traffic that originates from unpaid search results in any search engine. An SEO strategy is aimed at increasing it.
Reasons to track this metric:
- Evaluate SEO strategy effectiveness. An increase in organic traffic indicates the success of the strategy, while a decrease indicates the need for adjustments.
- Identify changes in search engine algorithms that directly affect organic traffic. For example, a search engine update may cause a large drop in search traffic.
- Determine content effectiveness. It shows you which content is most effective at bringing in traffic. Then, work to optimize and further expand this content with more relevant keywords.
Average engagement time
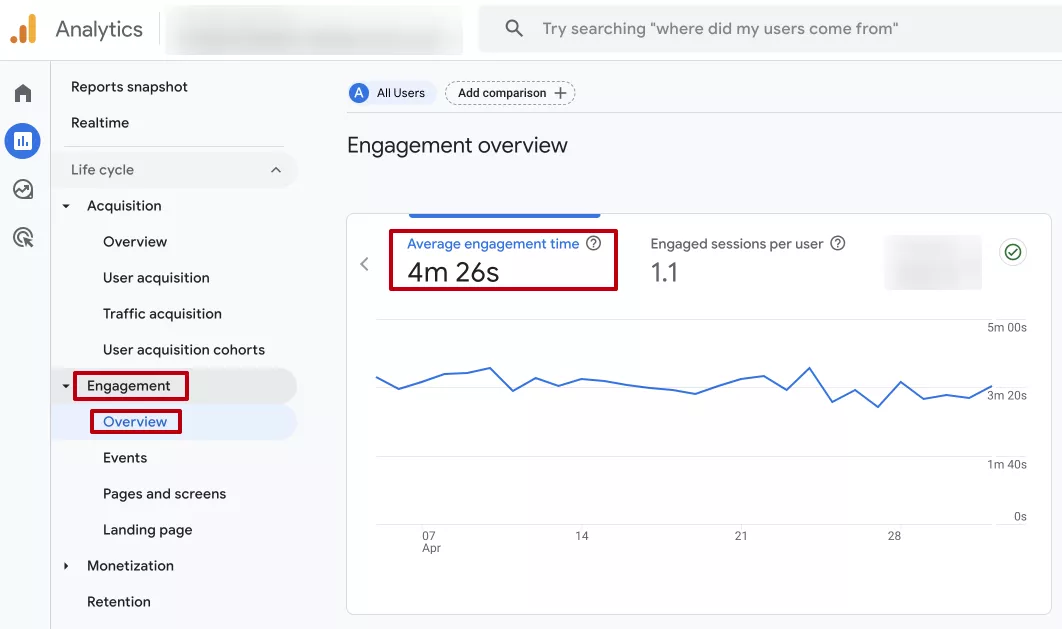
According to Google Help, average engagement time is the average amount of time an application or website was active on users' devices. To calculate this metric, Google Analytics uses the following formula:
Average engagement time = (total time spent) / (total number of users on your site)
A high average engagement time usually means that visitors find the content interesting and spend more time on the website. A low value indicates questionable content quality, a complicated interface, or slow loading.
Increasing this metric can directly increase the number of conversions.
The more time a user spends on a website, the more opportunities they have to learn about products or services, review them, and take actions such as filling out a form or making a purchase.
Bounce rate
In Google Analytics 4, the bounce rate is the percentage of sessions that do not have an interaction. It is the inverse of the interaction rate.
A session with an interaction is one that lasts at least 10 seconds or includes at least one conversion event or two page/screen views. If a user session does not meet these criteria, Google Analytics counts it as a bounce.
The bounce rate is calculated using the following formula:
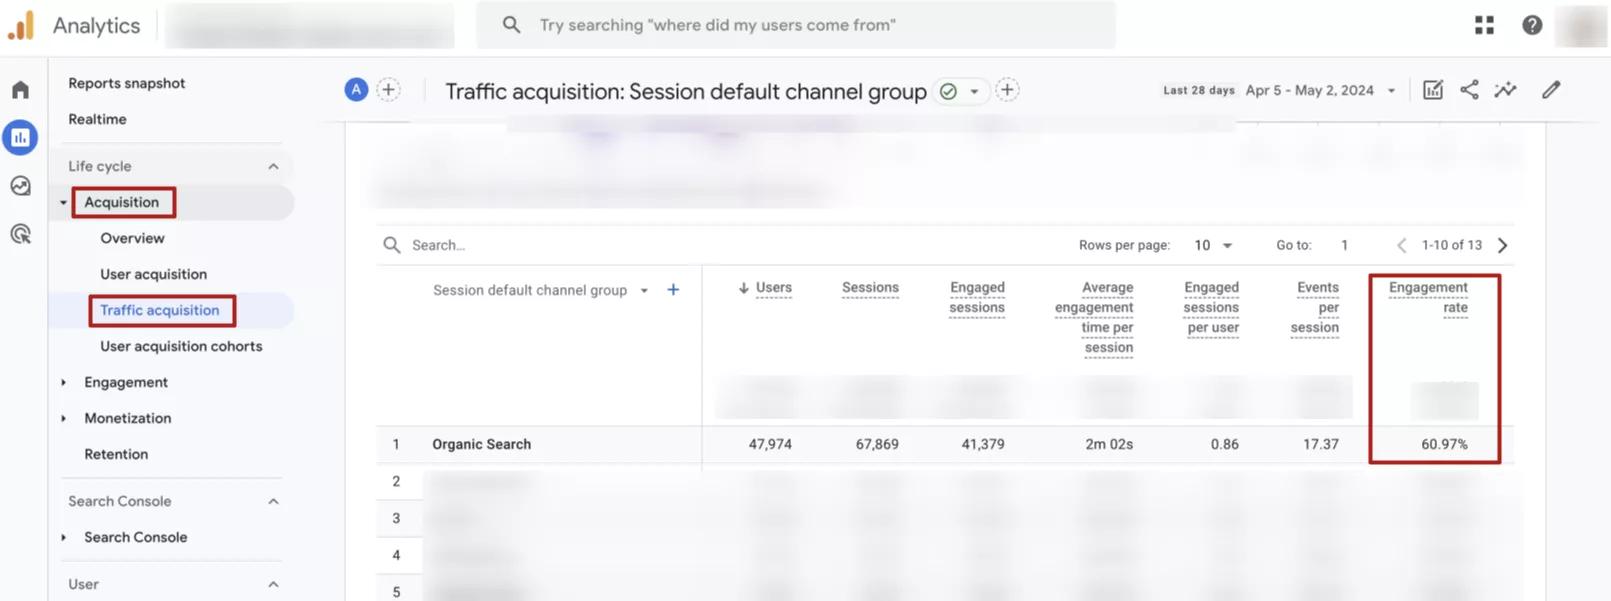
100% - engagement rate = bounce rate
In the screenshot above, the standard GA4 reports do not include the actual bounce rate, but it is easy to calculate:
100% - 60.97% (engagement rate) = 39.03% (bounce rate)
Read more about bounce rate and its alternatives in GA4, especially how to add the metric to a standard report.
Tracking bounce rate is important for SEO. Here’s why:
- Traffic quality. A high bounce rate can indicate low traffic quality. For example, if many users leave the site immediately after entering it, it means they did not find what they were looking for.
- Impact on SEO. Bounce rates can affect a website's ranking in search engines. High bounce rates can be caused by poor-quality content or a poor user experience, which can lower a site's performance in search results.
- On-page optimization. This metric will show you pages or areas of the site that need optimization. Why are users leaving pages without further interaction? Perhaps there are issues regarding navigation or page loading speed.
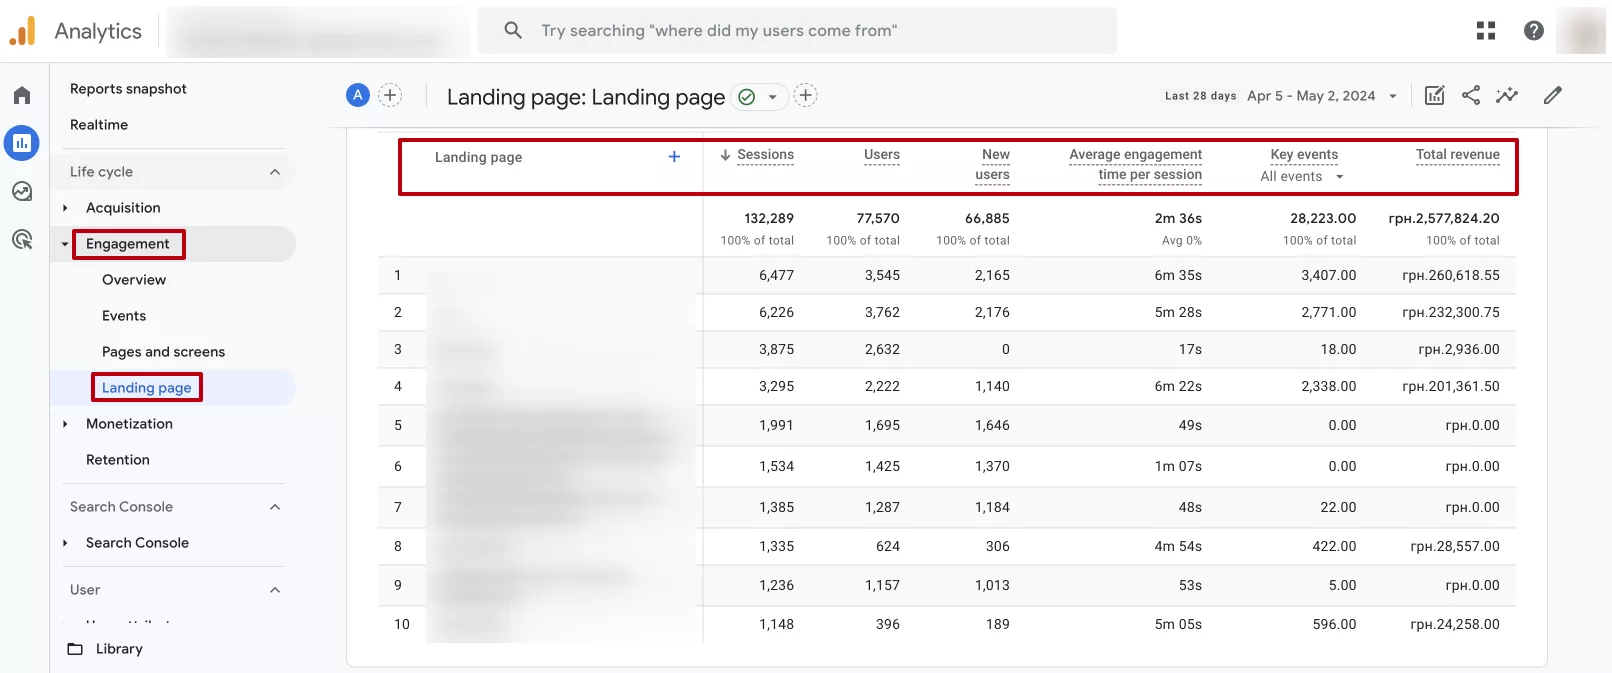
Landing Page
These are the pages that frequently appear in search results. Through monitoring, specialists identify the most successful pages of a website and optimize them to increase search engine visibility.
Purchase journey
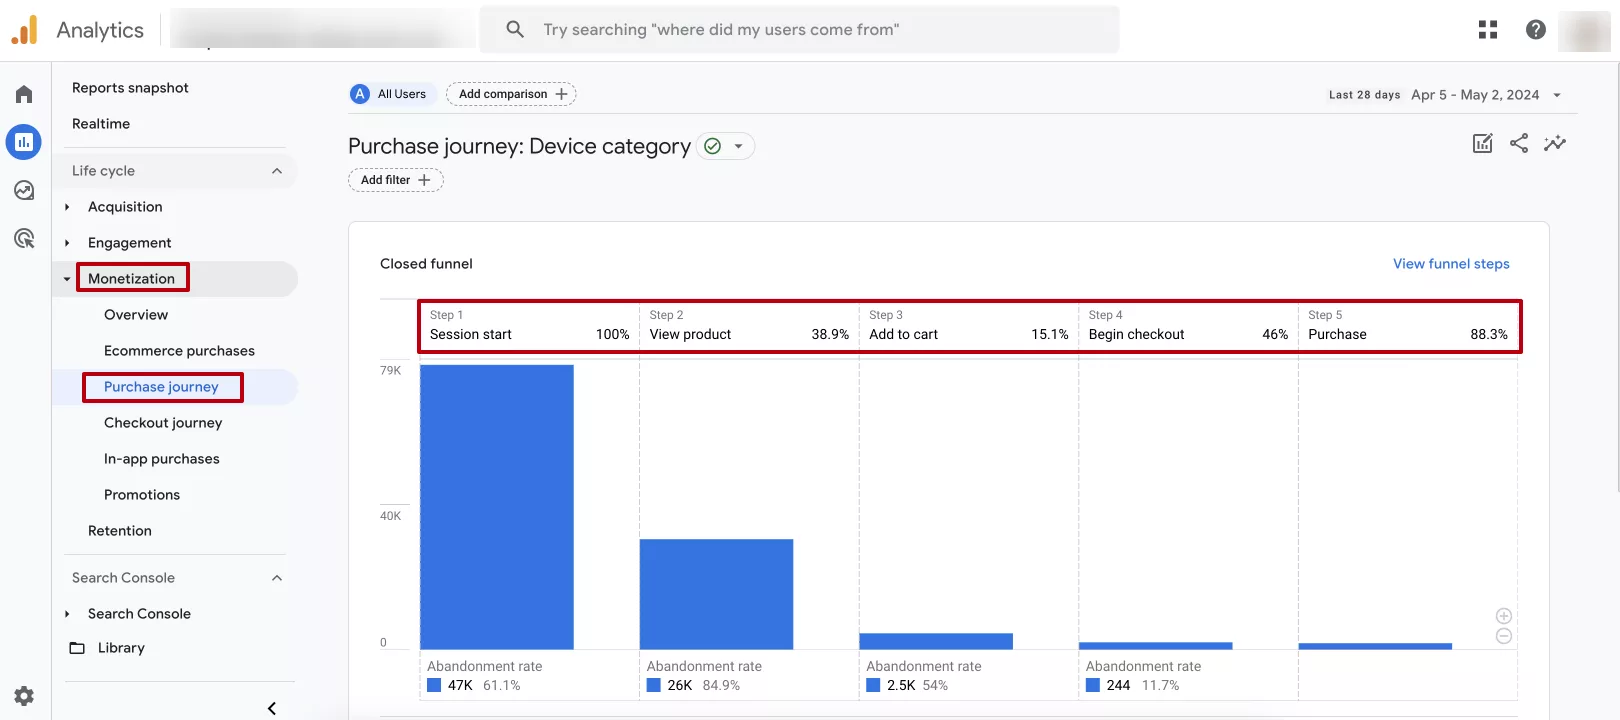
To analyze user behavior on the site, you should set up a purchase journey (the path to any important action on the site or application).
Let me show you an example from e-commerce.
Tracking the purchase journey, from start to finish, is essential for effective e-commerce management and increasing conversions.
So why is it important to track each of these stages?
- Understand behavioral factors. Analyzing traffic sources helps determine the channels that bring users to the site and provides context to their time there. Similarly, tracking product browsing and cart abandonment provides insight into customer interests and intent.
- Identify problematic issues. Tracking each stage will draw attention to possible issues that users may encounter during the purchase process. For example, if many users are abandoning their shopping carts, it may indicate a problem with the checkout process. If the site doesn’t have an “add to favorites” option, users are unable to mark products as favorites and decide later whether to make a purchase.
- Improve search engine rankings. Improving behavioral factors and increasing conversions usually have a positive impact on a website's search engine rankings. Google and other popular search engines take the user experience into account when ranking websites in search results.
Average click-through rate and average position
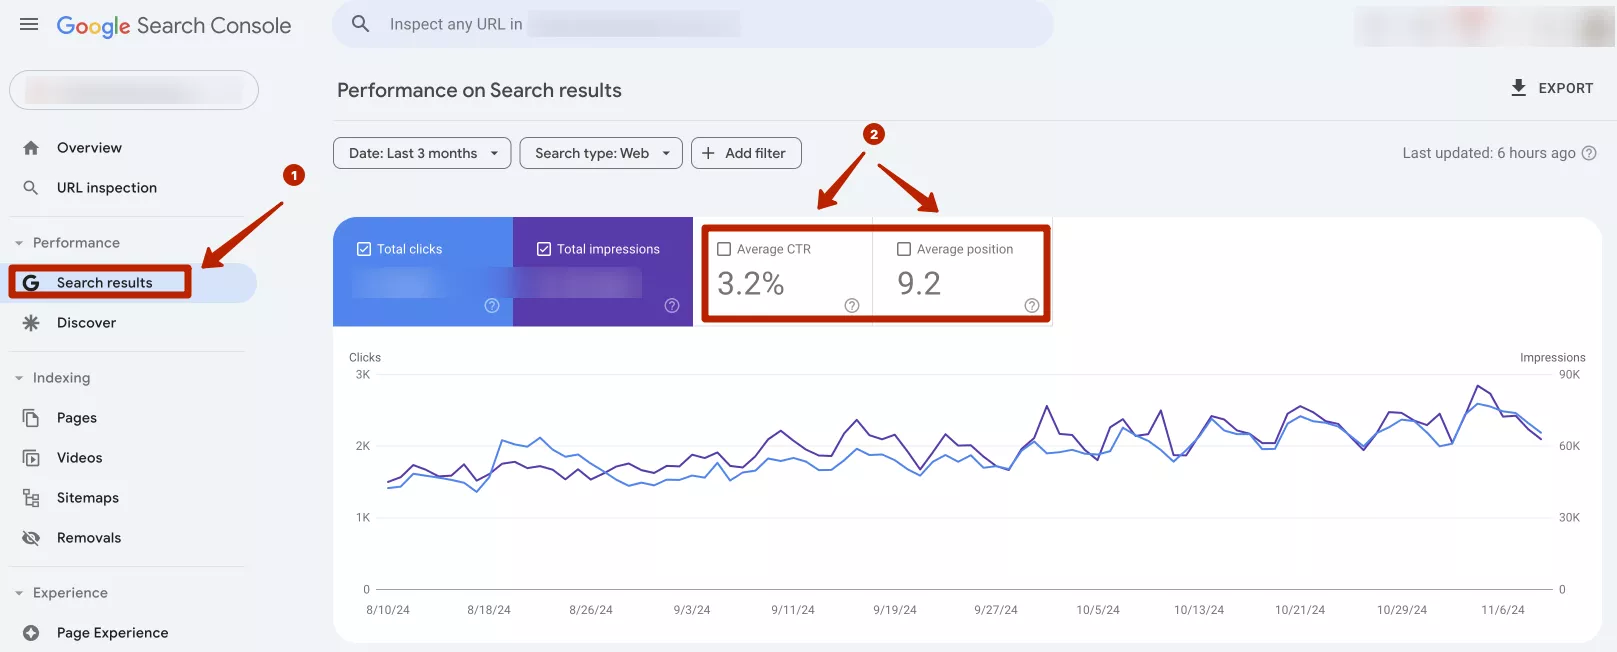
Average CTR is the ratio of the number of clicks on links to a website to the number of times a website is displayed in search results.
Average position is the average position of all website impressions in search results for a given time period.
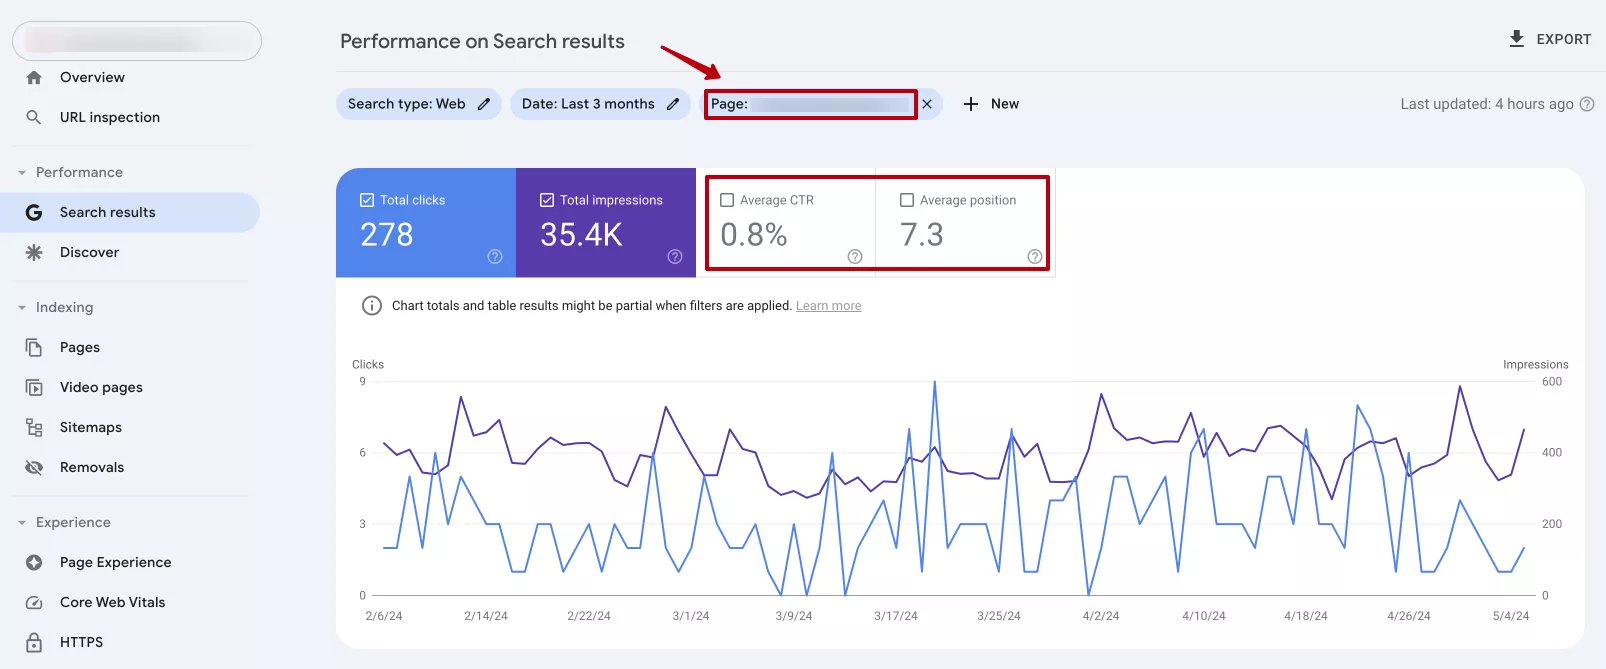
These metrics help you understand the effectiveness of a particular page or keyword, as well as by region or device. Their analysis reveals keywords for which the site has a low CTR but a high position, and vice versa. This will show you opportunities to optimize content and improve its effectiveness.
For example, let's take a site that specializes in selling fabric for clothing. For the keyword "buy fabric", it has an average position in search results of 6.8 and an average CTR of 3.3%. Notice that the performance for the priority keyword is high.
However, if the results are unsatisfactory, a thorough analysis is required. Usually, a low position leads to a low CTR because users are more likely to click on results that are higher up. In this case, you need to determine the priority keywords for specific pages and optimize the tags (h1, title) and meta tags (description) for these keywords.
*H1 is the main heading that is displayed on the page and defines its main topic or content.
*Title is a tag that is displayed as the page title in the browser tab and in the Search Engine Results Page (SERP). It is very important for SEO and is one of the main factors in determining a page's relevance to search engines.
*Description is a meta description of the page, and it can be used to generate a snippet (short information displayed below the title in search results).
To improve your search engine rankings, you should also optimize your content for relevant keywords. Developing unique, interesting, and informative content that meets users' needs will increase rankings.
The same goes for each page of your site.
Clicks and Impressions
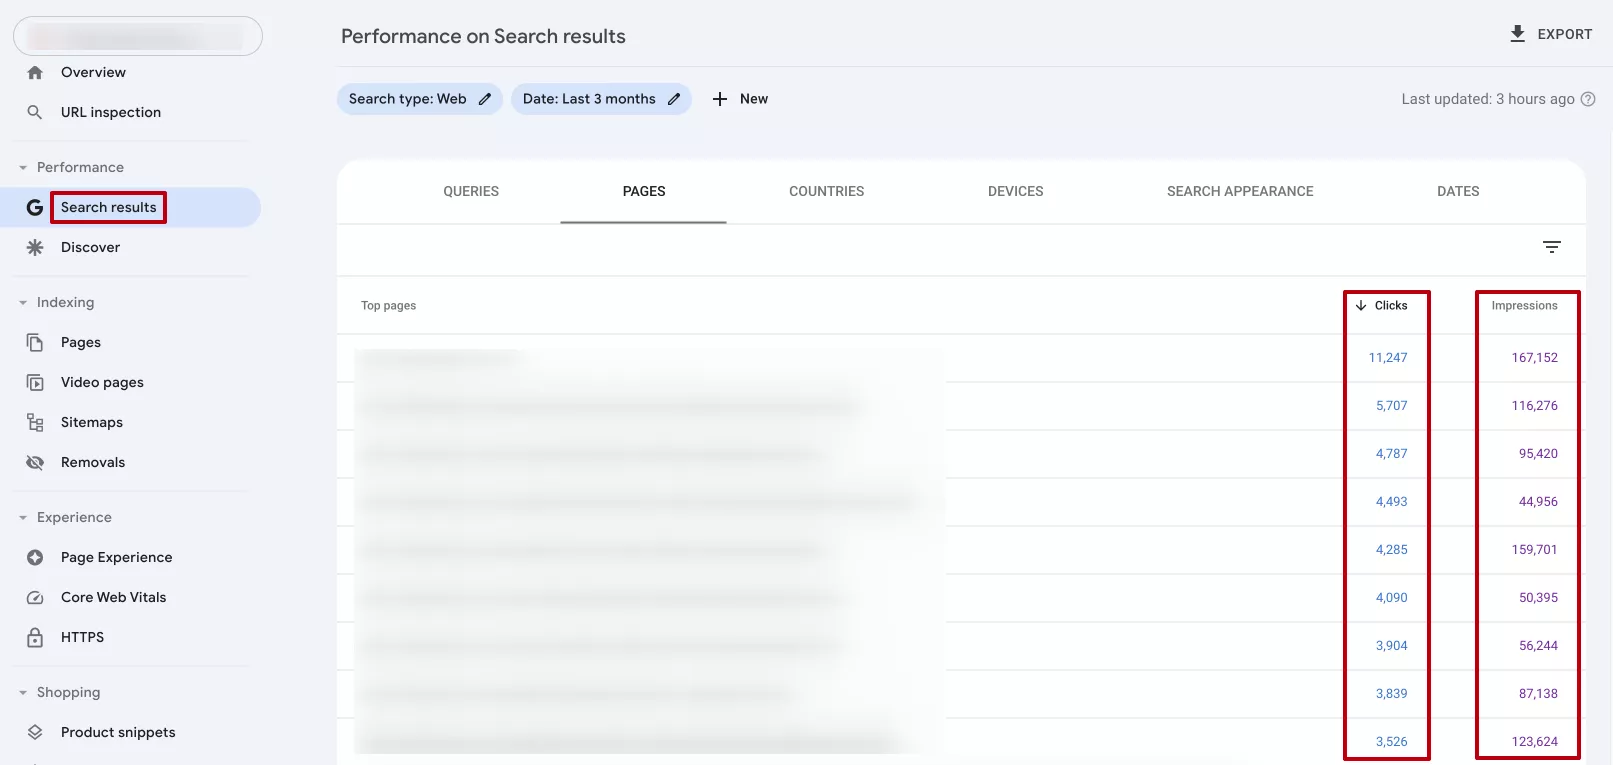
The number of clicks and impressions in Google Search Console can help you understand how effectively a website attracts traffic from search engines. A high click-through rate relative to impressions means that the resource attracts users' attention in search results and encourages them to visit the site. If you have a high number of impressions but a low ranking, pay attention to the click-through rate. Perhaps the titles or meta descriptions of the pages are not attractive or informative enough for users to click on your link.
Analyzing these metrics will help you determine which keywords and pages are attracting attention. This allows you to choose the most effective keywords for your site or individual sections and improve the content, tags, and meta tags to make your site appear more frequently and higher up in search results.
By monitoring clicks and impressions, you can track changes in your site's search rankings.
This allows you to quickly notice a drop in rankings and take prompt action to improve the situation.
Core Web Vitals
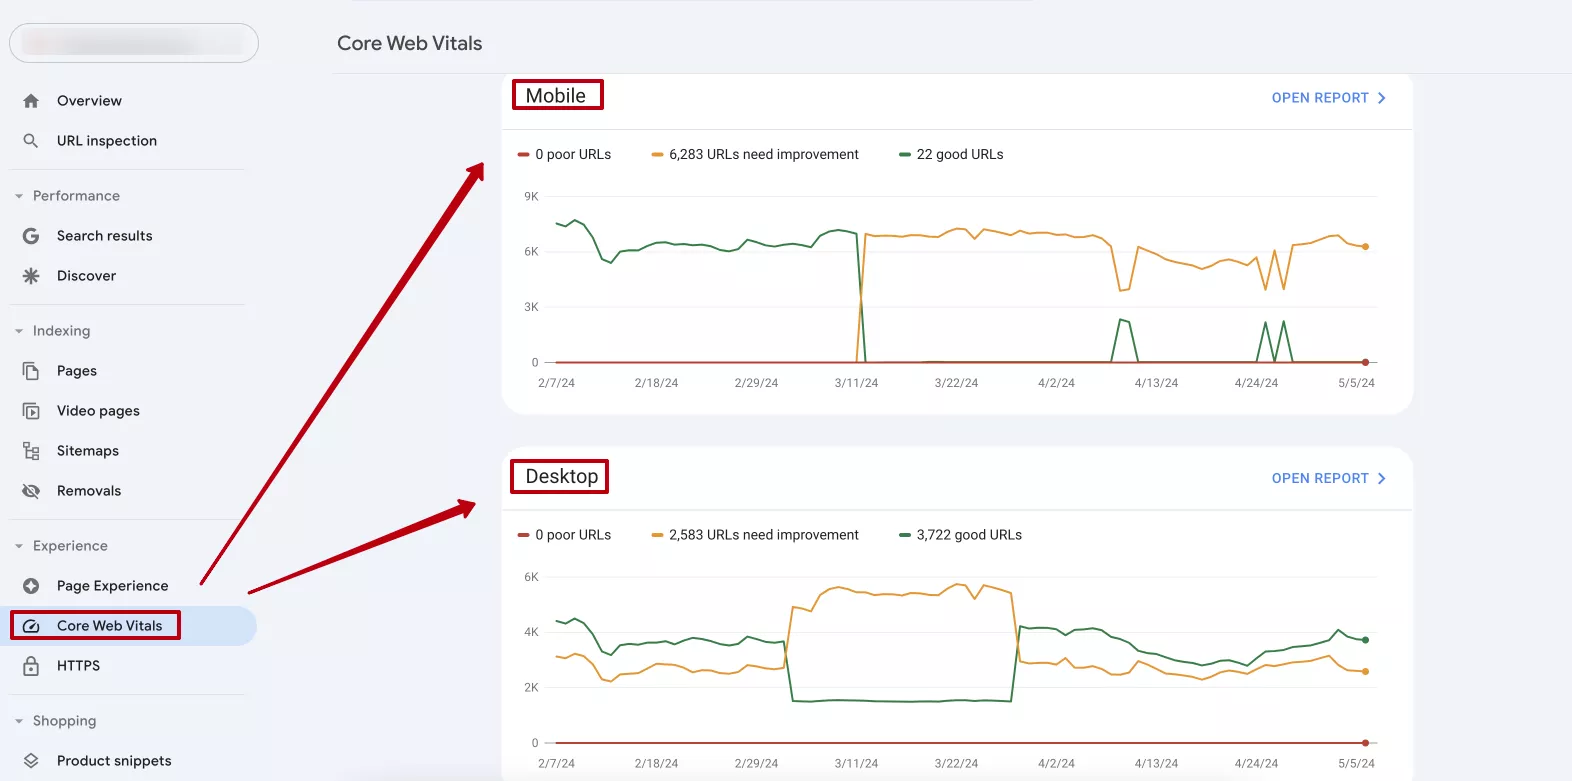
Core Web Vitals are three important website speed metrics that measure the real-world user experience: page load performance, interactivity, and visual stability.
Analyzing Core Web Vitals in Google Search Console (GSC) is important for several reasons:
- Evaluate the user experience. By analyzing these metrics, you can understand how users perceive the site and whether it is convenient for them.
- Improve search engine rankings. Google has officially defined Core Web Vitals as a ranking factor. Therefore, it is important to improve these metrics to ensure that your site ranks higher in search results.
- Improve behavioral factors. For example, Interaction to Next Paint (INP) is a metric that measures the time between a user's interaction with a website and the next screen refresh. Optimizing it significantly improves the user experience. When the INP is less than 200 ms, users receive an immediate response to their actions. A fast and easy-to-use website ensures a high level of interaction and reduces the likelihood of a high bounce rate.
- Track changes and improvements. Largest Contentful Paint (LCP) is a metric that measures the time from the start of page loading to the moment the largest known content element is displayed. An increase in LCP can potentially reduce user engagement. Therefore, detecting the problem early and improving this metric to less than 2.5 seconds will decrease the bounces and increase the time spent on the site.
Analyzing the right metrics is critical to success. With professional Marketing Analytics Services, you can uncover insights that drive better decisions and stronger ROI.
Key takeaways
Analyzing key SEO metrics will give you valuable data about website performance and user behavior. You can then use this data to influence the ranking of your website in search results.
The analysis includes the following metrics:
- Users and new users indicate the popularity of the site, the effectiveness of attracting new audiences, and the retention of existing users.
- Search traffic shows the number of visitors coming from search engines.
- Average interaction time shows the level of interest users have in the content and can serve as an indirect signal of its quality and relevance.
- Bounce rate. A high bounce rate can raise questions about the usefulness or relevance of the content.
- Landing page metrics help you evaluate how effectively a particular page attracts users.
- Tracking the purchase journey allows you to analyze which stages of the purchase process are weak and need to be optimized.
- Average CTR and average position are important to understand how a website appears in search results and how effectively it attracts users.
- The number of clicks and impressions helps measure the popularity of the site in search engines and the effectiveness of its visibility.
- Page load speed affects the user experience and is one of Google's ranking factors.
With regular monitoring and analysis, you'll be aware of changes in search engine rankings or user behavior. This is crucial, as it enables you to respond to various trends in time to ensure the success of your website. To make the most of this data and improve site performance, consider using Technical SEO Services tailored to enhance both metrics and user experience.
Recommended theme posts
Related Articles
Display Advertising Effectiveness Analysis: A Comprehensive Approach to Measuring Its Impact
In this article, I will explain why you shouldn’t underestimate display advertising and how to analyze its impact using Google Analytics 4
Generative Engine Optimization: What Businesses Get From Ranking in SearchGPT
Companies that master SearchGPT SEO and generative engine optimization will capture high-intent traffic from users seeking direct, authoritative answers
From Generic to Iconic: 100 Statistics on Amazon Marketing for Fashion Brands
While traditional fashion retailers were still figuring out e-commerce, one company quietly revolutionized how U.S. consumers shop for everything from workout gear to wedding dresses


