While working on a
This isn’t typical “how-to” – it’s everything you need to turn a simple scan into actionable insights. So buckle up. Here’s my ultimate guide to tracking QR codes with Google Analytics in a way that genuinely helps you understand your audience, improve your online activities, and track your offline campaigns.
Table of contents:
- What is QR Code Tracking with Google Analytics?
- Why Track QR Code with Google Analytics?
- Setting Up Google Analytics QR Code Tracking
- How to Track QR Codes With Google Analytics??
- Best Practices for Tracking QR Codes with Google Analytics
- Advanced Tips to Track QR Code Google Analytics
What is QR Code Tracking with Google Analytics?
QR codes (Quick Response codes) are those square, black-and-white barcodes you see on everything from cereal boxes to billboards. They’re super popular in marketing because they make moving from offline to online easy. Imagine a customer who sees a product in-store, scans a QR code on the packaging, and is instantly taken to a page with reviews, a product video, or a special discount – all from a single scan. That’s powerful stuff.
But here’s where QR codes go beyond convenience and add real value for marketers: with QR code Google Analytics tracking, each scan can become a goldmine of data. With the right setup, each scan isn’t just a statistic – it’s an insight into where the user came from, what they’re interested in, and how engaged they are with the brand.
So, how do you go from a simple scan to a data-rich insight? The secret lies in UTM parameters. Don’t let the name scare you. UTM (Urchin Tracking Module) parameters are little snippets added to URLs that tell Google Analytics all the juicy details. Here’s a breakdown of how each UTM parameter for QR code tracking with Google Analytics adds meaning to a scan:
|
UTM Parameter |
Purpose |
Example |
|
utm_source |
Identifies the source of traffic |
utm_source=qr_code |
|
utm_medium |
Specifies the marketing medium |
utm_medium=poster |
|
utm_campaign |
Names of the specific campaign |
utm_campaign=sale2025 |
|
utm_term |
Tracks paid search keywords (optional) |
utm_term=boots |
|
utm_content |
Differentiates similar content (optional) |
utm_content=top_banner |
So, let’s say you’re promoting a big spring sale with a QR code on posters around town. The UTM-tagged URL might look something like this:
|
https://www.example.com/?utm_source=qr_code&utm_medium=flyer&utm_campaign=spring_promo |
When users scan this QR code, you know they came from a flyer (utm_medium), specifically from your spring promo campaign (utm_campaign). All of this goes directly into Google Analytics, giving you a clear picture of how that campaign is doing. The data is immediate, actionable, and informative.
Why Track QR Code with Google Analytics?
You might wonder, “Do I really need to track QR codes?” The answer is a big yes. Let’s find out why.
Measuring Campaign Effectiveness
One of the biggest perks of Google QR code tracking is that you can finally see how your offline marketing campaigns are doing. QR codes give us hard numbers on how many users are engaging with our flyers, posters, and even direct mail pieces.
Imagine you’re running a campaign with QR codes on both in-store posters and outdoor billboards. With unique UTM parameters on each, you can see exactly which format gets more interaction and adjust your future budget based on real numbers instead of just guessing.
Explore our glossary for essential web analytics definitions to sharpen your data insights!
Understanding User Behavior
It’s not just about how many users scan your QR codes, but what they do afterward. Google Analytics lets you dig deeper into user behavior post-scan. Are they browsing other pages on the site? Are they bouncing immediately? Are they making purchases or signing up?
Tracking QR codes with Google Analytics lets you use these insights to adjust your campaigns. If users spend a good amount of time, it’s a sign you’re doing something right. If they’re leaving the landing page too quickly, maybe it’s time to improve your SEO.
Enhancing ROI
Every campaign is judged on its ROI. When you track QR codes with Google Analytics, you can pinpoint which codes are driving the most valuable interactions, making it easier to focus your budget on the highest-return strategies.
I’ve had cases where QR codes in certain high-traffic areas brought in way more engagement than expected. Knowing this, I shifted resources to expand our efforts in those specific locations, increasing overall campaign performance.
In sum, tracking QR code scans with Google Analytics is not just about counting – it’s about seeing what drives the best returns and doubling down on it.
Setting Up Google Analytics QR Code Tracking
Now, let’s walk through the setup. It’s easy enough if you take it step-by-step, and once it’s set up, you’ll be able to track everything with the kind of precision you expected.
Step One: Set Up a Google Analytics Account
If you don’t already have Google Analytics, let’s get you set up.
- Head over to Google Analytics and hit Start Measuring.
- Log in and set up an account and property for your site.
- Google Analytics will give you a tracking ID, like G-XXXXXX.
- You’ll add this ID to your site, either directly in the site’s header or through Google Tag Manager.
Once this setup is complete, you’re ready to move on to the next step: adding UTM parameters to track the details of each QR code campaign.
Step Two: Define UTM Parameters
Now, let’s get those UTM parameters working. They’re the backbone of QR code tracking Google Analytics, allowing you to keep your data organized and meaningful.
1. Open the Campaign URL Builder.
2. Enter your destination URL (where the QR code should take users).
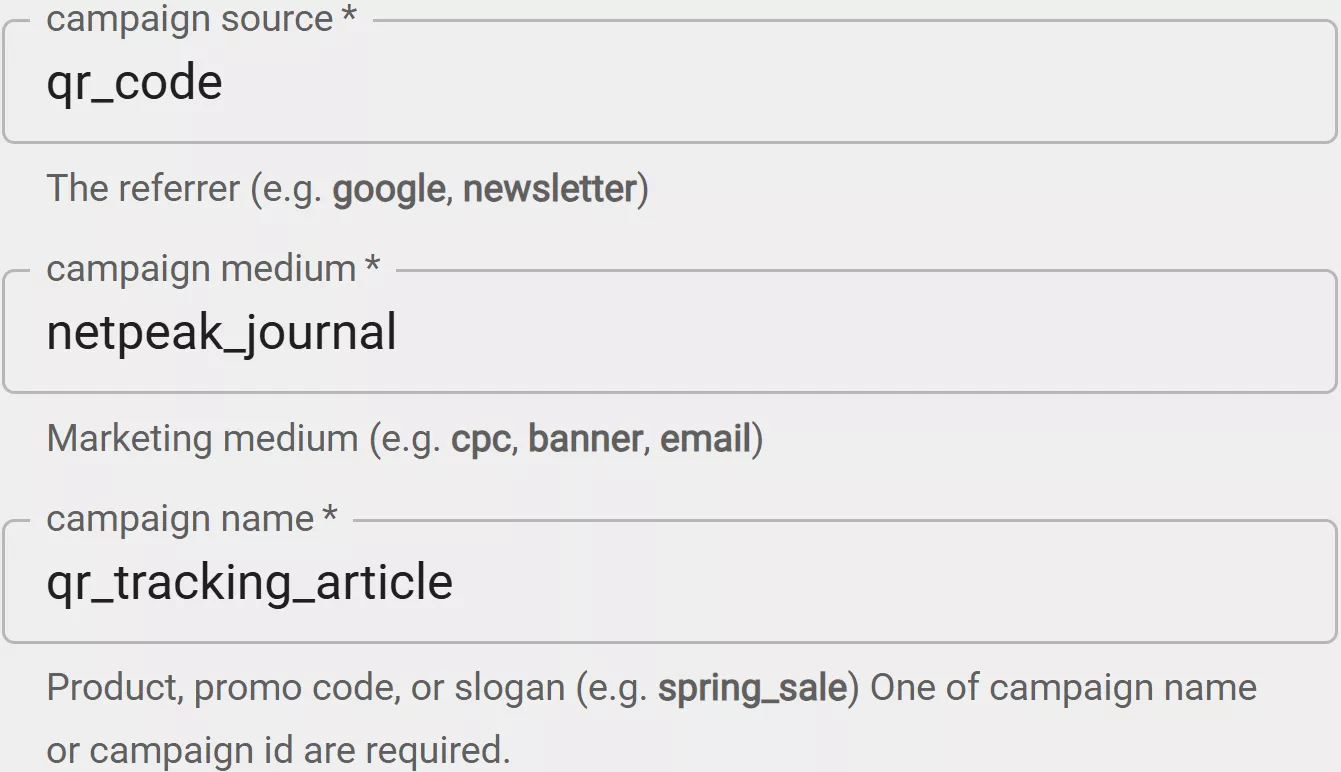
3. Fill out each UTM field. I typically use “qr_code” for utm_source to know it’s from a QR scan, then label utm_medium with the type of marketing (like “flyer” or “poster”), and name the campaign in utm_campaign for easy filtering.
Generated URL example
With this tagged URL, you’re all set to turn it into a QR code and start gathering data.
Step Three: Generate the QR Code
I love this part because it’s where everything you’ve set up so far comes together.
- Paste the UTM-tagged URL into a QR code generator like ME-QR.
- Customize it with brand colors or logos to match your aesthetic.
- Download the QR code in a high-res format so it’s crystal clear.
Generating the QR code is an essential step that turns your data-tagged URL into an interactive touchpoint for your audience.
Step Four: Implement the QR Code in Marketing Materials
Alright, the QR code is ready, but placement is everything. It needs to be somewhere visible and scannable. Think about where your audience is most likely to engage:
|
Placement Location |
Engagement Strategy |
|
Product Packaging |
“Scan to learn more about this product!” |
|
Storefront Posters |
“Exclusive in-store discount – scan now!” |
|
Event Flyers |
“Get event updates and offers instantly” |
|
Direct Mail |
“Redeem your loyalty discount with a quick scan” |
These are some ideas I’ve seen work well. Placement and context make all the difference in getting the engagement you want.
How to Track QR Codes With Google Analytics?
Now that you’ve got the QR code ready, let’s make sure you’re tracking it properly in Google Analytics.
Step One: Establish Clear Objectives
Every campaign needs a goal, right? So, what’s yours? Whether it’s driving traffic to a specific page, getting app downloads, or collecting leads, defining this upfront helps ensure your data is meaningful.
Step Two: Craft Compelling Content
Your QR code shouldn’t lead to just any page. Make it worthwhile. Think of special discounts, exclusive content, or even a sign-up bonus. The more valuable the landing page, the better your engagement will be.
Step Three: Monitor Real-Time Data
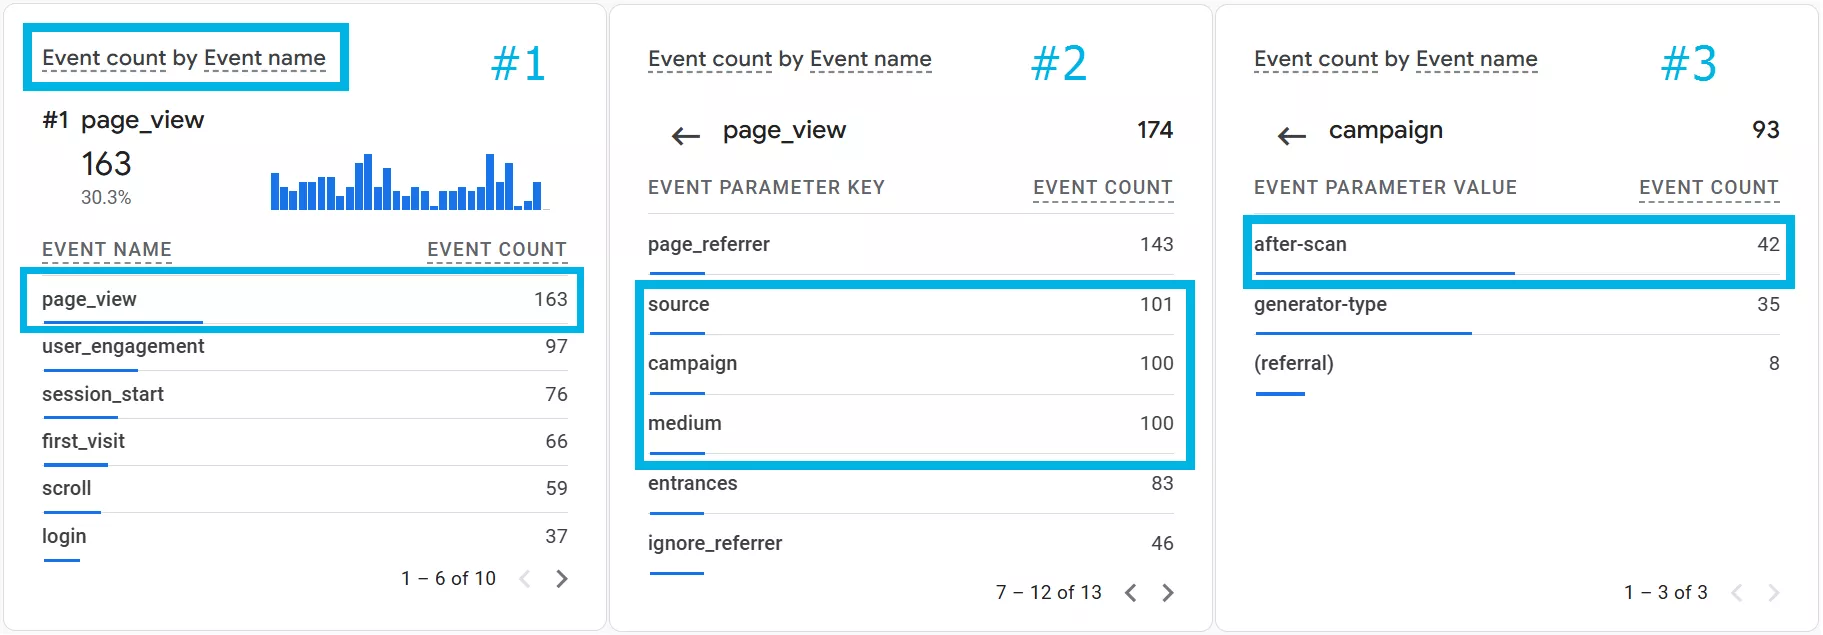
Once your QR codes are out there, you can track real-time data in Google Analytics. Go to Reports > Realtime Overview > Event count by Event name card. Then click on the page_view event (#1) and one-by-one check source, campaign, and medium event parameters (#2) to find appropriate values (#3) and watch the engagement roll in:
Following these steps will ensure that you’re not just putting QR codes out there, but tracking every interaction and making adjustments as needed based on real-time feedback.
Step Four: Track QR Code Scans With Google Analytics
Tracking in real-time is only half the battle – let’s talk about what you need to do to get the complete data. Note that GA4 typically requires a waiting period of about 24–48 hours for data to fully populate.
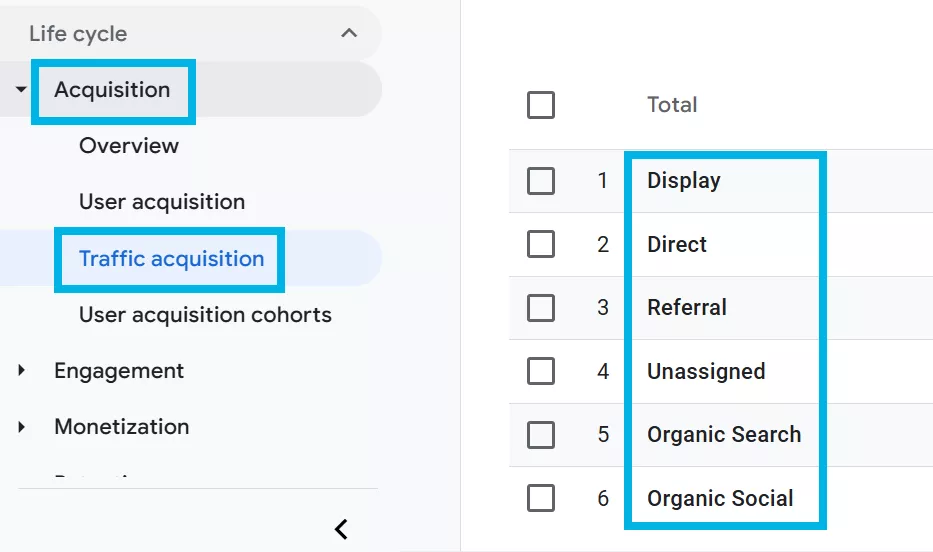
Start by navigating to Reports > Acquisition > Traffic Acquisition:
This report focuses on traffic sources for each session, making it ideal for tracking QR code performance.
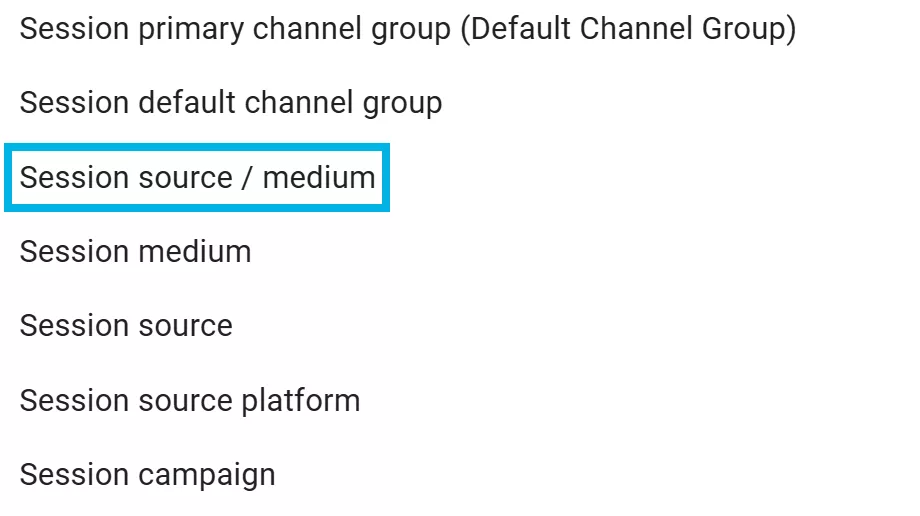
By default, GA4 displays the Session default channel group in this report. To focus specifically on traffic tied to your QR code, change the primary dimension to Session source / medium:
This allows you to view more data that reveals your QR code origin.
If you’d like more granular insights, add the Session campaign as a secondary dimension by clicking the plus icon next to the primary dimension:
Here is the data you can see after selecting the channels group:
When you’re analyzing tracking QR codes in Google Analytics data, it is essential to understand these top metrics:
|
Metric |
Description |
|
Sessions |
Represents the total number of sessions initiated by users who interacted with the QR code, capturing each unique visit. |
|
Engaged sessions |
Counts sessions where users interacted actively with the site, typically defined by staying on the page for over 10 seconds, triggering an event, or viewing multiple pages. |
|
Engagement rate |
Shows the percentage of engaged sessions out of the total sessions, indicating how effective the QR code was in driving user engagement. |
|
Average engagement time per session |
Measures the average time users actively engaged during a session after scanning the QR code, reflecting content interest and relevance. |
|
Events per session |
Calculates the average number of events triggered by users in each session, providing insights into interaction levels post-scan. |
|
Event count |
Total count of events generated from QR code-driven sessions, representing overall user interactions and engagement activities. |
Each of these metrics provides valuable insights into how well your QR code campaigns are performing and where you can make improvements.
For conversion metrics, scroll right in the report to view columns for key events (formerly labeled as conversions) and total revenue by the campaign, if applicable. This data is crucial for understanding user actions post-scan:
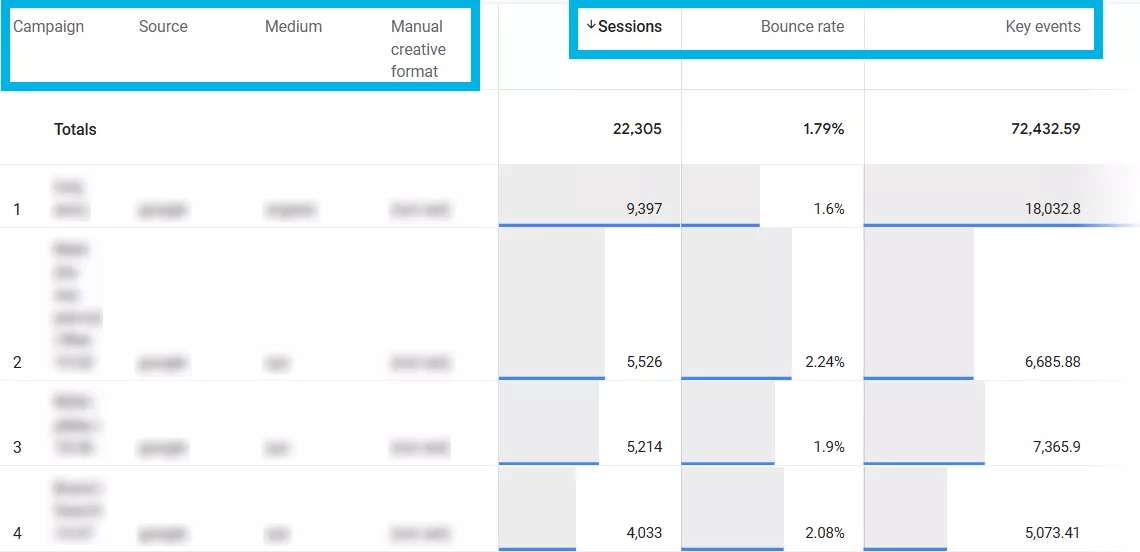
To analyze your QR code data more deeply, GA4’s Explore feature offers custom reports. Navigate to Explore > Create New Exploration, where you can select UTM dimensions used in your QR codes, such as Campaign, Source, Medium, and Manual creative format:
Using these GA4 reporting tools provides a comprehensive view of your QR code campaign’s performance – from sessions to bounce rate and key events – allowing you to make data-driven decisions for future strategies.
Best Practices for Tracking QR Codes with Google Analytics
Here are some tried-and-true tips for making the most of Google QR code tracker data.
- Ensure Scannability. Your QR code has to work in every condition, whether it’s in low light, on a screen, or printed on a flyer. Make sure it’s high contrast and is large enough to be easily scannable.
- Maintain Consistent UTM Parameters. Consistency is everything. Use the same terms for utm_source, utm_medium, and utm_campaign across identical campaigns, so your data stays clean and organized.
- Test Across Devices. Before launching, test your QR codes on different devices. Make sure they’re scannable and lead to the correct page every time.
- Regularly Review Analytics Data. Look at QR code tracking Google Analytics data regularly. Patterns in user behavior can help you make informed decisions.
- Comply with Privacy Regulations. If your QR code links to data-collection pages, make sure you comply with GDPR, CCPA, or other regulations. Transparency builds trust and keeps you out of legal trouble.
By following these best practices, you ensure your QR code tracking is as effective and reliable as possible, helping you gain meaningful insights that can guide your marketing efforts.
Advanced Tips to Track QR Code Google Analytics
As you get more comfortable with QR code tracking, there are a few advanced tactics that can take your insights to the next level.
- Dynamic QR Codes. If you want flexibility, dynamic QR codes are where it’s at. They let you change the URL without reprinting, which is perfect for long-term campaigns where you may want to tweak landing pages.
- Integrate with CRM Systems. Connecting Google Analytics to HubSpot or any other CRM gives you a complete view of the customer journey, from the initial scan to future interactions. You can even personalize follow-up actions based on this data.
- Leverage Event Tracking. Event tracking captures specific actions users take after scanning. Want to see if they watch a video or click a button? Set up event tracking to get those insights.
Using advanced tactics like these ensures you’re not just tracking QR codes but getting deep insights that can refine your marketing strategies.
Conclusion
- Understand the basics: QR codes offer a unique way to connect offline and online interactions. Understanding how to track a QR code in Google Analytics transforms each scan into actionable data.
- The Importance of Tracking QR Codes: By tracking QR codes, you can measure offline campaign effectiveness with precision, helping you identify which placements drive the most engagement.
- Setting Up Tracking for QR Codes: Setting up GA4 with UTM parameters (source, medium, and campaign) allows you to capture essential metrics, giving clarity on each campaign’s impact.
- Monitoring QR Code Engagement in GA4: GA4 helps you assess real-time data and user behavior post-scan, showing bounce rates, engagement, and conversion potential. Knowing how to track QR code traffic in Google Analytics is essential for understanding how users interact with your campaigns.
- Best Practices for Reliable QR Code Tracking: Consistent UTM parameters, device testing, and regular data review are key to meaningful results.
- Advanced QR Code Tracking Techniques: Use dynamic QR codes, CRM integration, and event tracking to capture deeper user actions.
Recommended theme posts
Related Articles
How to Set Up Consent Mode in GA4 on Your Website with Google Tag Manager
Let's explore how to properly integrate consent mode in GA4, configure it for effective data collection, and at the same time comply with GDPR and other legal regulations
Display Advertising Effectiveness Analysis: A Comprehensive Approach to Measuring Its Impact
In this article, I will explain why you shouldn’t underestimate display advertising and how to analyze its impact using Google Analytics 4
Generative Engine Optimization: What Businesses Get From Ranking in SearchGPT
Companies that master SearchGPT SEO and generative engine optimization will capture high-intent traffic from users seeking direct, authoritative answers

