The Key Metrics of User Engagement in Google Analytics 4
Measuring user engagement is an important aspect of
Google Analytics 4 has many metrics that allow you to measure user engagement. In this article, I'll cover the most important metrics, best practices, and common mistakes when using them.
The concepts of interaction sessions and active users
These indicate how users interact with a website and how long they stay on it. For a session to be considered an engagement session in GA4, the user must:
- view two or more pages or screens;
- stay on one page or screen for at least 10 seconds;
- complete a conversion.
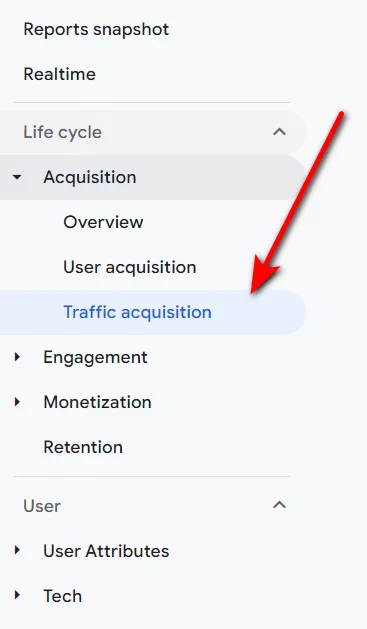
In GA4, you can see the different user engagement metrics under the Traffic Acquisition section.
Read more in “Sessions and Users: Key Differences Between Universal Analytics and Google Analytics 4 for PPC.”
A website user is considered active if they have an engaged session or if Google Analytics registers the first_visit event or the engagement_time_msec parameter.
The engagement_time_msec parameter is a characteristic of the user_engagement event, and it measures the amount of time a user actively interacts with a website or mobile application in milliseconds.
Google Analytics may not consider the user_engagement metric if there has been no interaction in the session since the previous event. This is particularly true when tracking first_visit and session_start events, as there is no interaction before them. It is also impossible to include the interaction time for the first event on a page, such as page_view.
So, the user activity condition considers either the first_visit event, the session with interaction, or the engagement_time_msec parameter. This is because there may be a first_visit event but no session with interaction and no engagement_time_msec, or there may be an event but no registered session with interaction.
Active Users is one of the metrics found in the User section.
In regular reports, the default metric is called Users, which only shows active users. You need to add the Active Users metric to your custom report to display both active and all users.
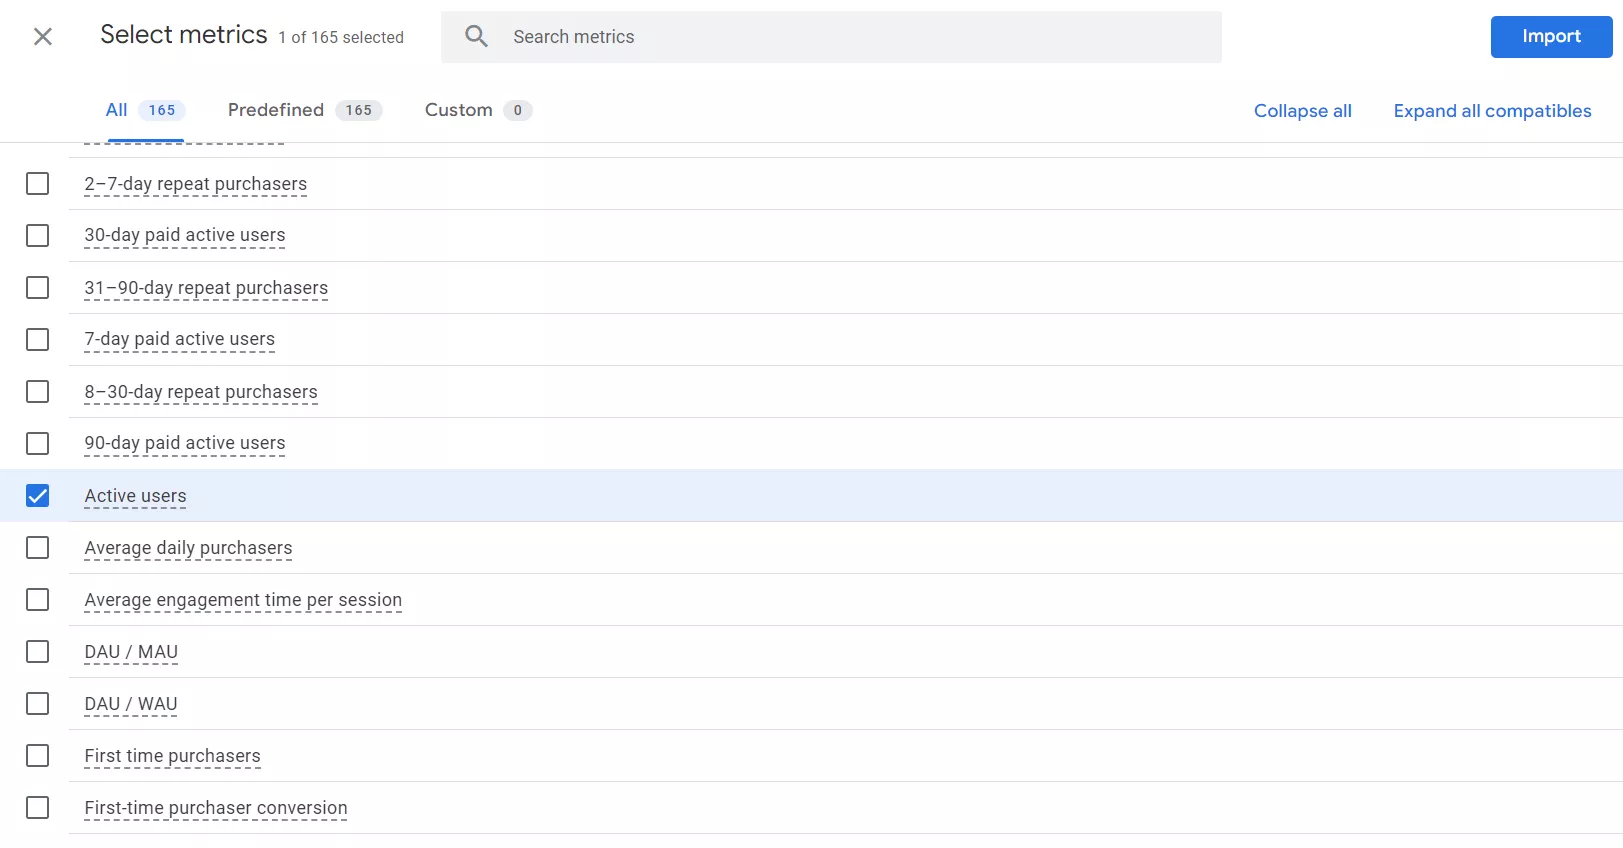
Once this is done, you must add the value to the custom report form.
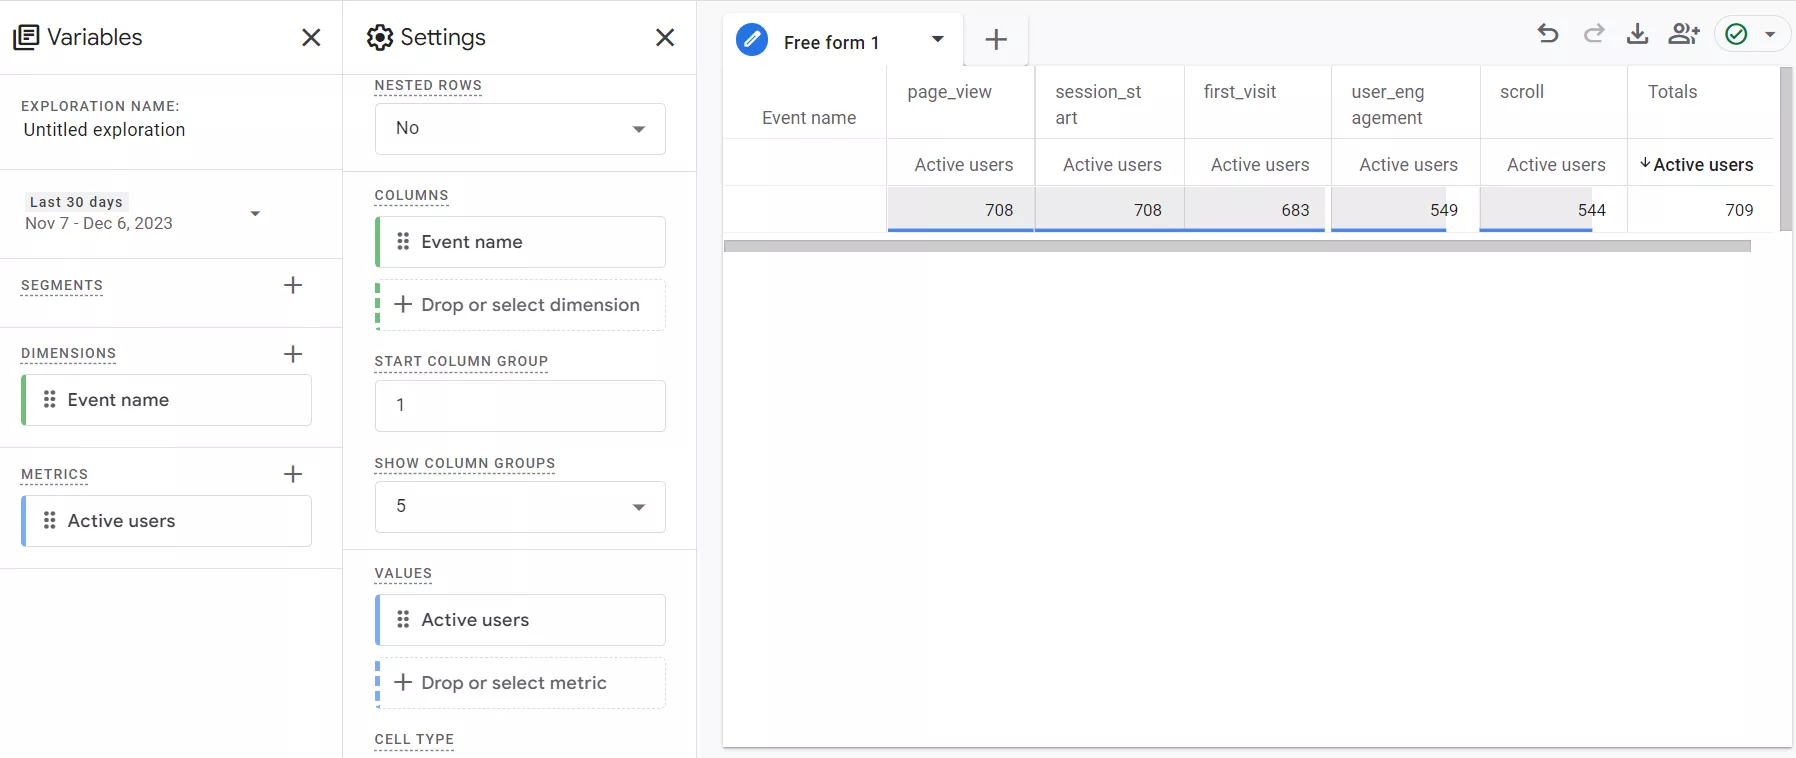
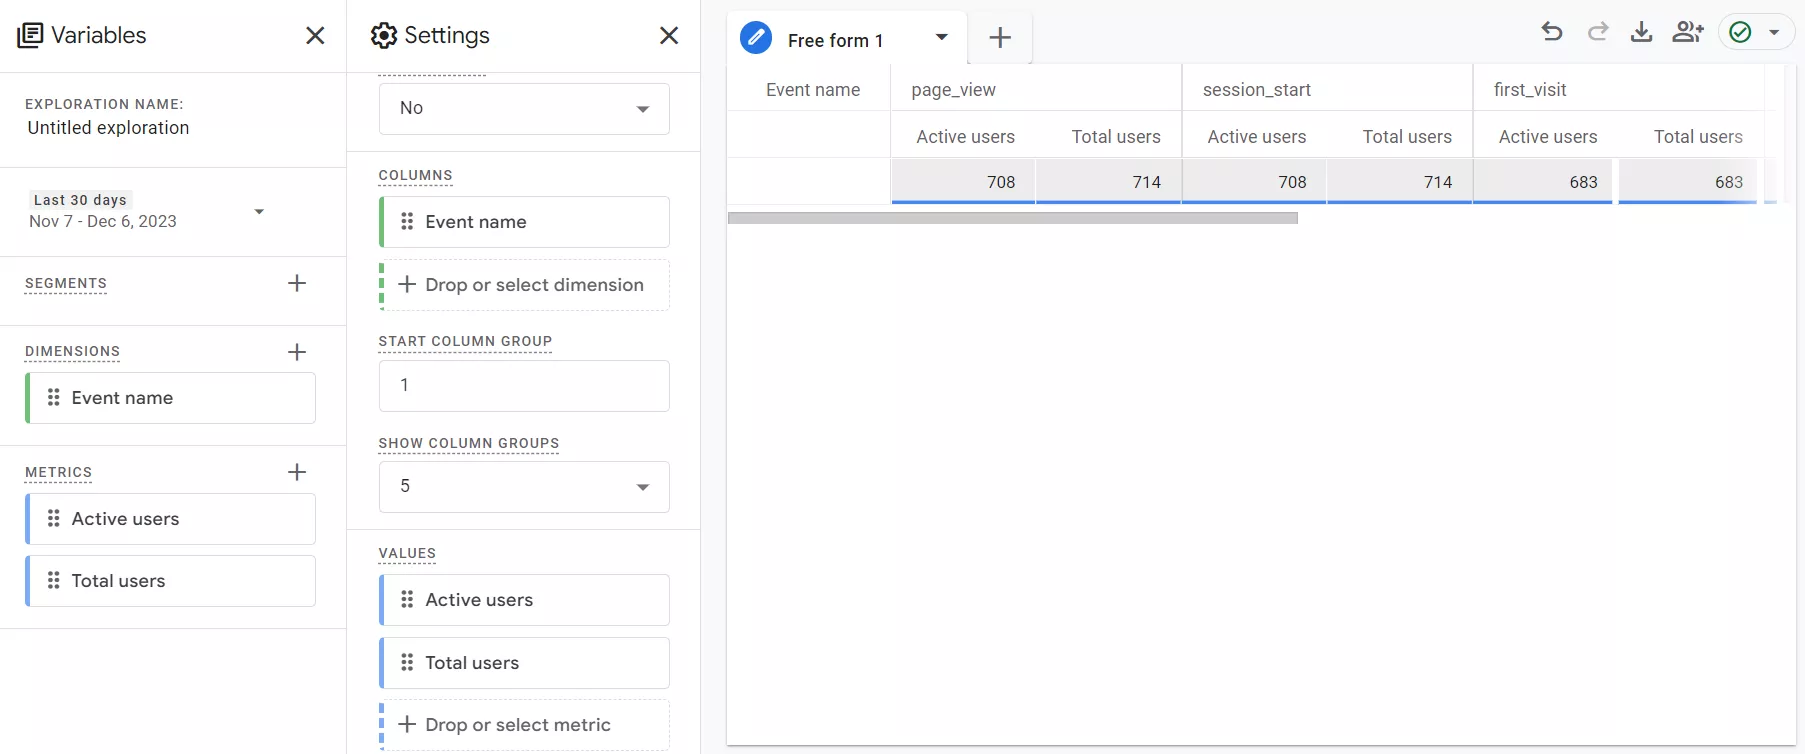
If you add the Total users metric to this custom report and compare it to Active Users, you'll see that the numbers are different because they're counted differently:
- “Active Users” are only users who have interactive sessions;
- “Total users” are all users who have visited the website and have been identified by the system by Client ID (unique user identifier).
Key metrics for user engagement
Let’s take a look at five engagement metrics that you can use to evaluate the relevance and quality of the traffic you receive. By analyzing these metrics for traffic from different channels, you can determine the success of an ad campaign or the quality of page content.
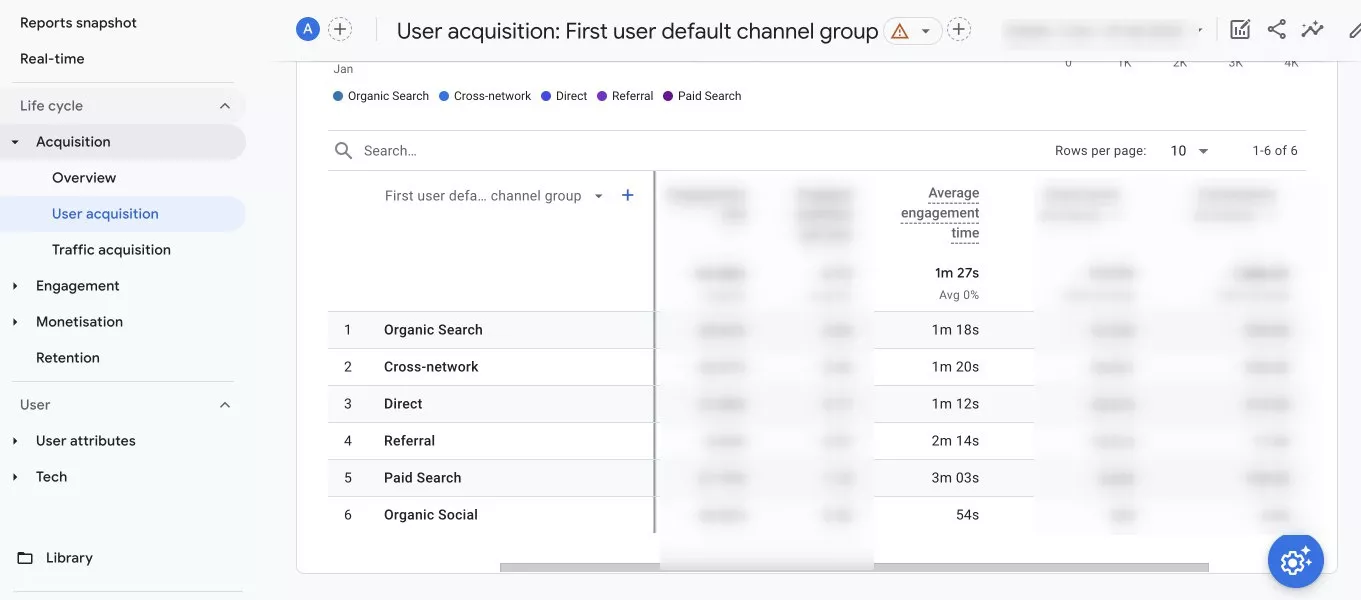
Average engagement time
The average engagement time shows how much time users spend on a website on average. To obtain this metric, the total amount of time users spend on the site is divided by the number of visits. This metric allows you to identify and evaluate user activity in relation to the functionality of your site.
For example, it helps you to:
- evaluate the page loading speed;
- evaluate the user-friendliness of the interface, including the navigation menu;
- correct possible errors.
By comparing the average engagement time at different time intervals, you will identify trends and changes in user behavior over time. You can then use this data to make your site more attractive and convenient for visitors, which will help to increase its popularity.
To find the metric in GA4, go to Reports snapshot > Acquisition > User acquisition.
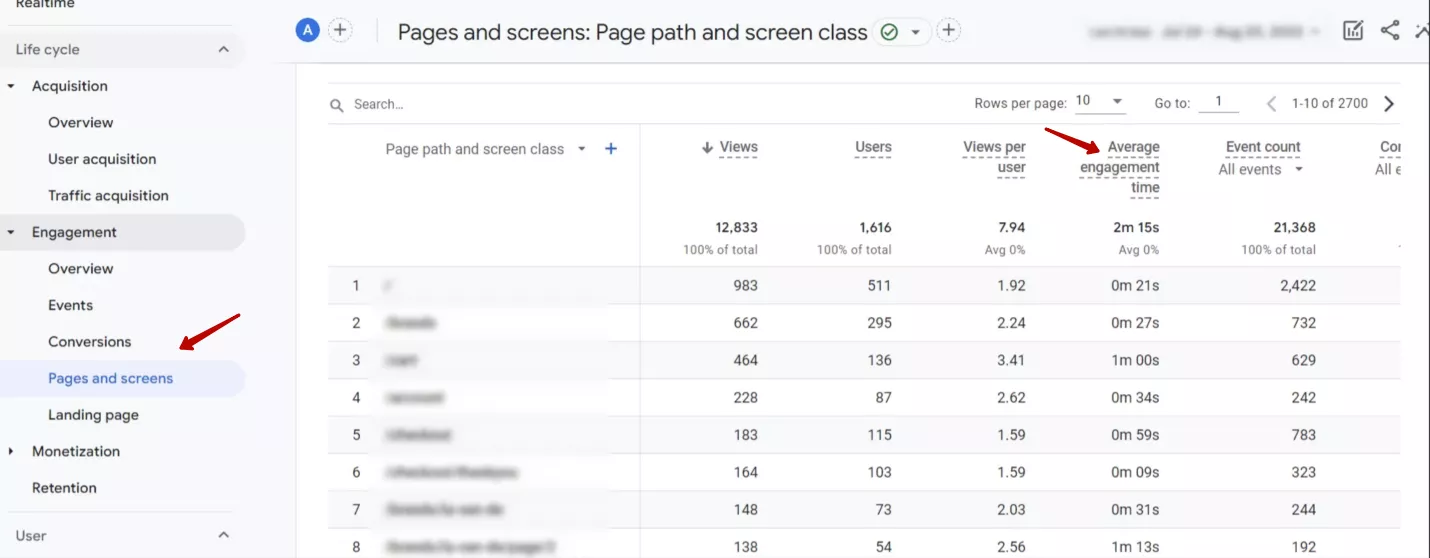
Engagement time per page
In GA4, the engagement time per session is similar to the average engagement time, but it is calculated by page.
Engagement time per session shows the average amount of time users spend on each website page. It is calculated as the total amount of time users spend on a page divided by the number of visits to that page.
It is used to identify problematic pages that have lower interaction times than other pages. These pages may have problems with content display, loading speed, user experience, etc.
Conversely, if certain pages have a higher engagement time than others, it signals the following:
- the most popular and engaging content;
- the effectiveness of marketing campaigns;
- priority pages for optimization.
To find this metric in GA4, go to Reports snapshot > Engagement > Pages and screens.
In GA4, the engagement time per page is the “Average engagement time,” but it is broken down by page.
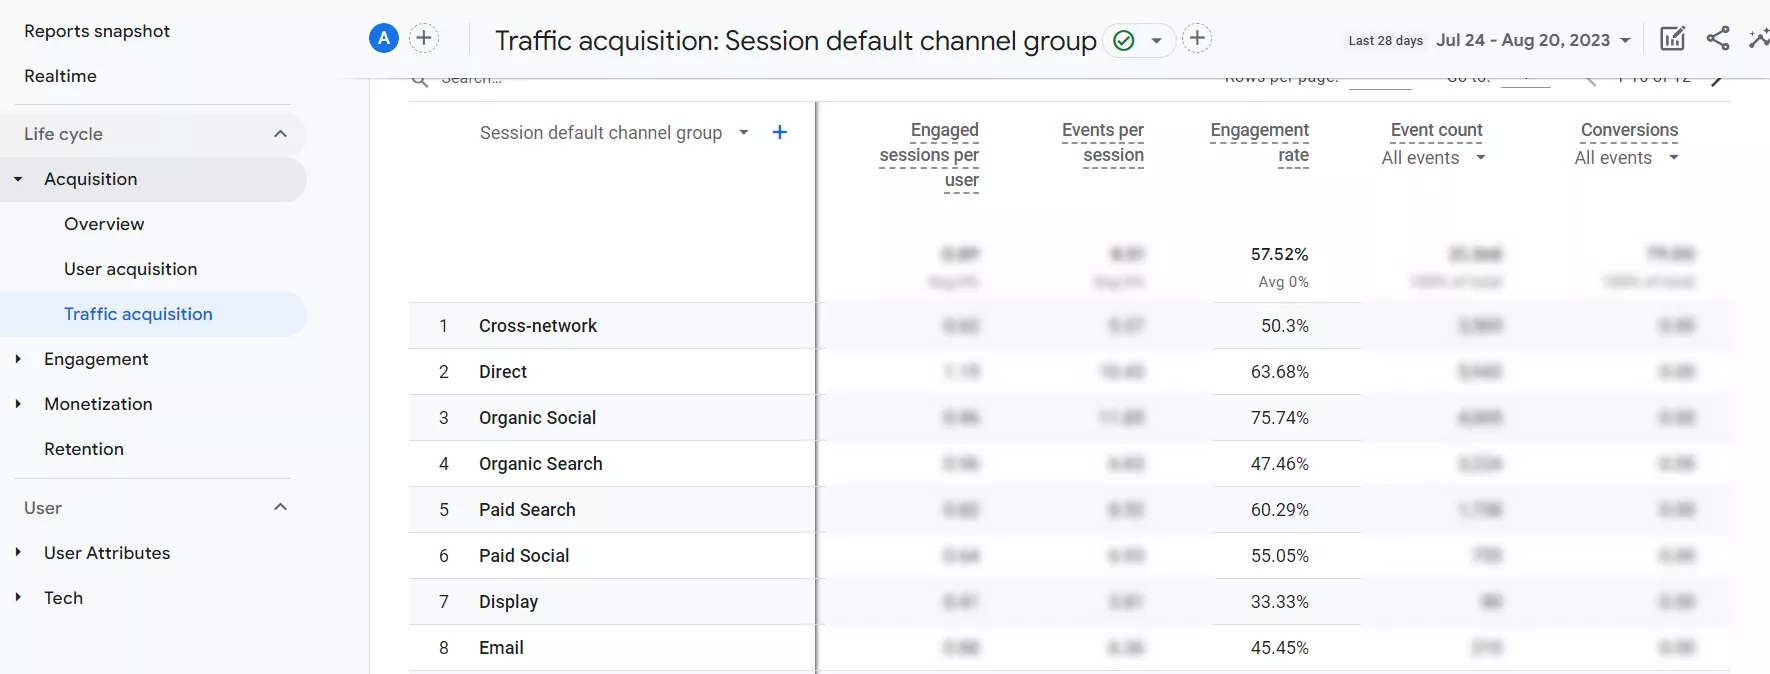
Engagement rate
The engagement rate is the percentage of sessions with interaction out of all sessions. The higher the rate, the better.
This metric is ideal for advertising campaigns aimed at introducing new products or services to users instead of conversions. For example, you might run display ads for three different audience segments. The interaction rate will tell you which audience responds better to the ad and is more interested in the product or service.
To find the engagement rate, go to Reports snapshot > Acquisition > Traffic acquisition.
Bounce rate
The bounce rate indicates how often users leave a website after viewing a single page and not interacting with it. It represents the percentage of visitors who enter the site and then leave rather than continuing to view other pages within the same site. In other words, it is the percentage of non-interactive sessions.
To find out more about the bounce rate in GA4, read “Bounce Rate and Its Alternatives in Google Analytics 4.”
For example, if a user opens your website, browses the content on the homepage for less than 10 seconds, and closes it without activating any events or going to any other pages or screens, the session will be recorded as abandoned. If the user spends more than 10 seconds on the site, even if they visit 1 page, this visit is considered an interaction.
GA4 has a default timeout of 10 seconds, but you can increase this to 60 seconds in the settings. For example, you should increase the time if your site’s content includes large articles.
In Google Analytics 4, the bounce rate is the inverse of the engagement rate. It is worth noting that the lower the bounce rate, the better.
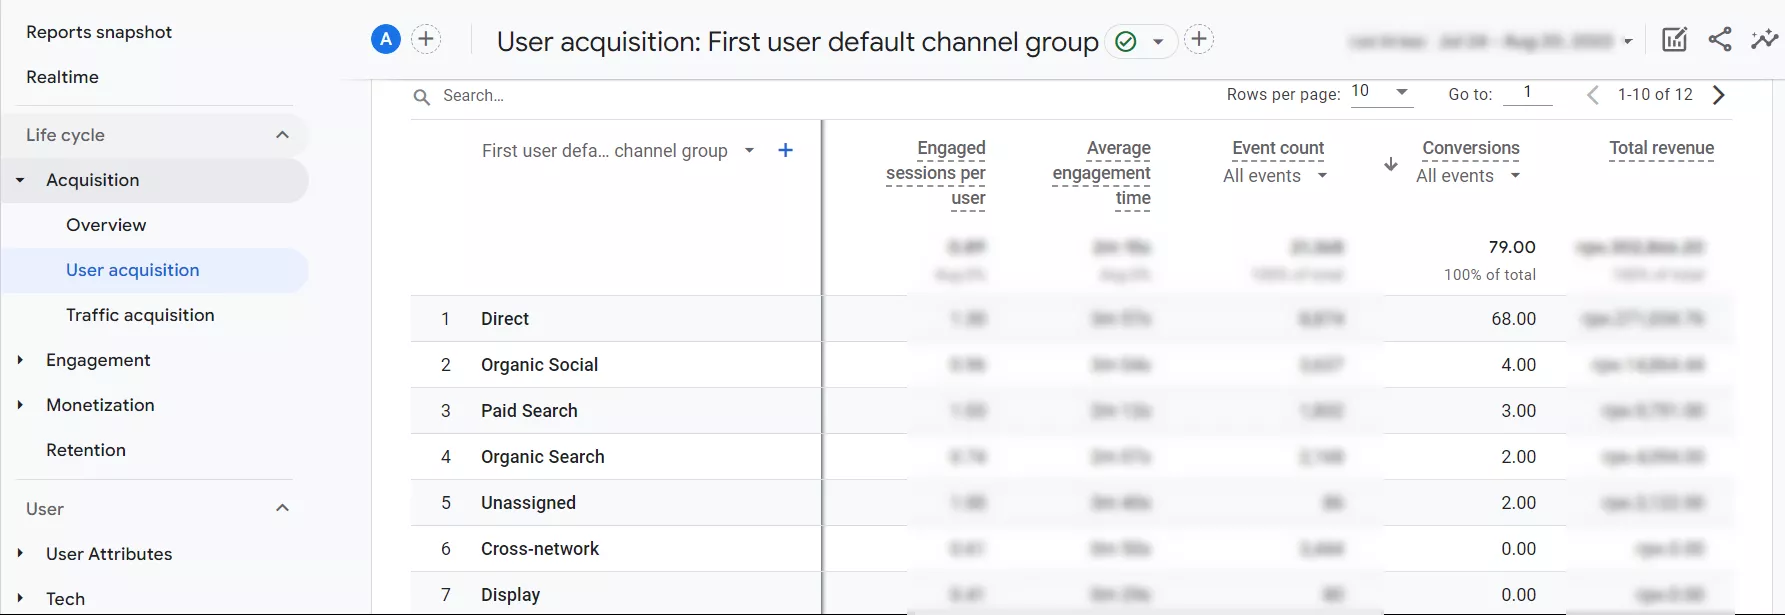
Conversions
Conversions are targeted user actions on the website, such as purchases and form submissions. They are essentially Events that we have defined as targeted.
Changes in the number of conversions are important. If conversions go up, it indicates the success of ad campaigns or page content, and the opposite indicates problems.
To find the number of conversions, go to Reports snapshot > Acquisition > User acquisition.
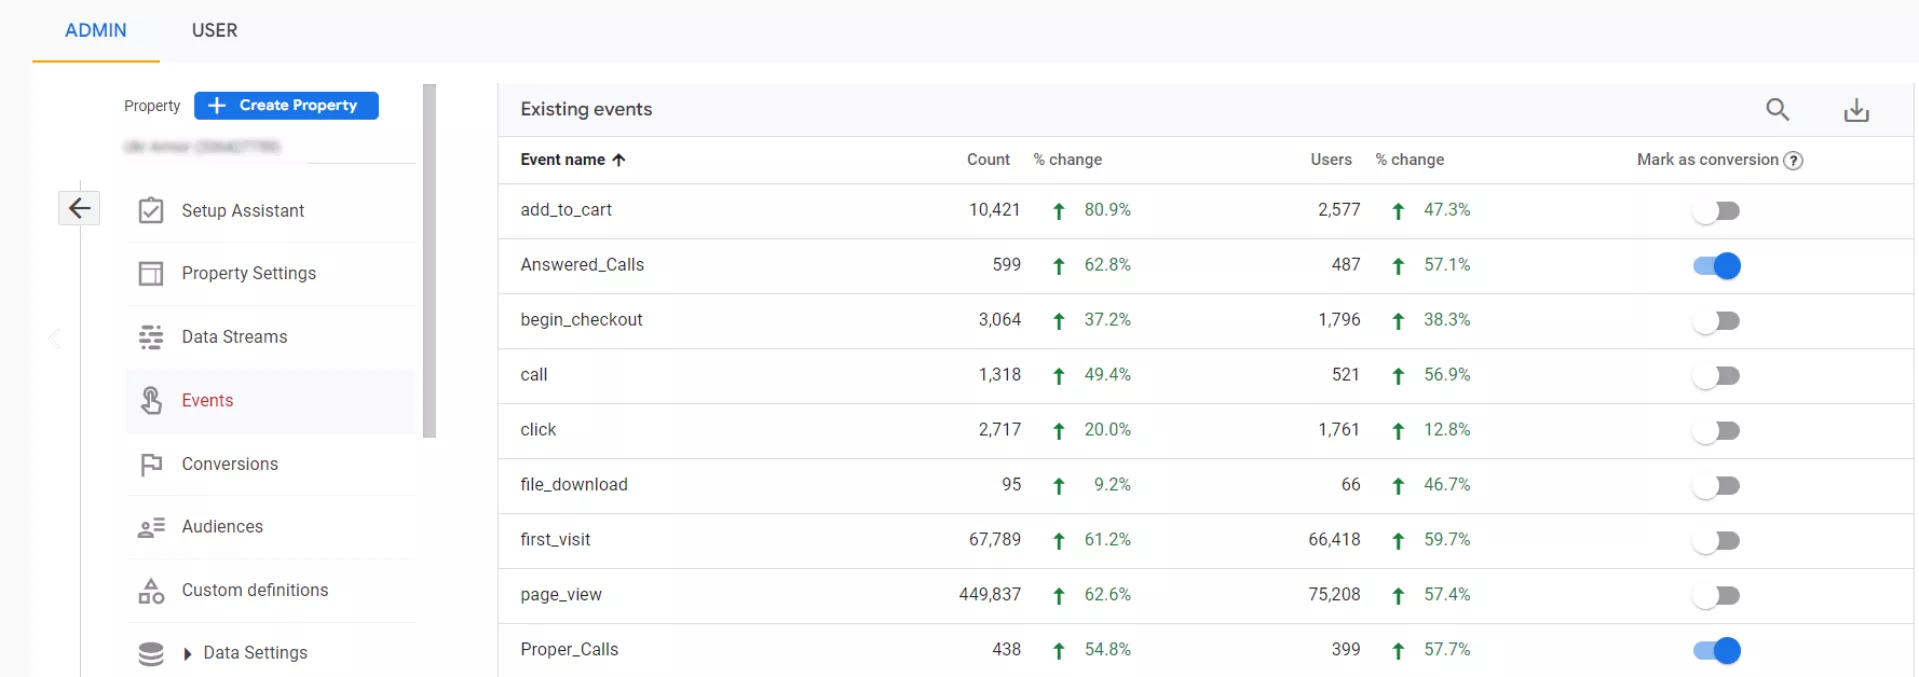
Please note that conversions will only be displayed once you have marked the corresponding events on your website as conversions. To do this, go to the Admin > Events.
How to use engagement metrics in GA4?
Engagement metrics provide valuable information about website users, and this data can be used to draw conclusions about the quality of content, advertising campaigns, and so on. There are different ways to use these metrics:
- Define specific goals for a website and measure the metrics related to achieving those goals.
- Use conversion rates in GA4 to track how users interact with the website content and then improve it accordingly.
- Study user behavior on the site and determine why they leave it.
By accurately measuring engagement metrics, you can analyze and track the results of SEO optimization or Google Ads campaigns. To increase the accuracy of the measurements, try the following:
- Segment website users by traffic channels, demographics, etc.
- Use data analysis tools such as Looker Studio or BigQuery.
If you have a low engagement rate, use traffic engagement reports to see if specific channels, source/channel pairs, pages, or screens cause it.
For example, if certain pages or screens have a low engagement rate, check that the ads that lead to them are consistent with the page content. Do they make it convenient for users to perform the targeted actions?
If a channel has a low percentage of engaged sessions, review your marketing activities for that channel. For example, if you are working with the Display Network channel, make sure your ads are relevant to the content on your site.
If the problem is worse (for instance, if the bounce rate is over 90% or there are no conversions at all), check that the tracking code has been correctly added to all the necessary pages. It may contain errors that cause user activity to be tracked incorrectly. Similarly, if you're collecting data from an application, make sure the Google Analytics SDK for Firebase is configured correctly.
I also recommend analyzing the quality of the website itself: text, graphics, color scheme, calls to action, and ease of navigation. Use the Google Optimize tool to test different versions of your website and identify the most attractive version to users.
Common mistakes
There are a few common mistakes when measuring user engagement.
- Misinterpretation of metrics. For example, a high bounce rate is not always a bad thing if a user completes a target conversion on that page.
- Incorrect measurements. This includes tracking only the total time spent on the site without considering the time spent on each page. The total time will not flag problems that occur on particular pages.
- Not segmenting users properly. User segmentation is key, as different groups of users may have different behaviors on the site.
Such errors in measuring engagement metrics will lead to false statistics that do not help you improve the website. Without accurate analysis, it will not be possible to identify site errors in time, and this could cause drops in traffic. So, be careful when measuring all engagement metrics.
Read our blog to learn more about marketing analytics and GA4:
- Core Web Vitals Report in GA4 and Looker Studio: A Guide to Monitoring Your Website's Page Speed Metrics
- Cross Domain Tracking in Google Analytics 4
- How to Set Up Google Analytics 4 on Shopify: A Step-by-Step Guide with Three Different Methods
Conclusions
1. Measuring user engagement is an important aspect of website performance analysis. It allows you to determine how effective a website is in acquiring and engaging users.
2. GA4 provides a variety of metrics for measuring user engagement, and these are useful for website optimization and improving the user experience. Here are the five main metrics:
- Average engagement time
- Engagement time per session
- Engagement rate
- Bounce rate
- Conversions
3. To properly interpret engagement metrics, you need to have a clear understanding of your site's goals and the user actions that you are aiming for. When measuring metrics, it is important to use user segmentation to achieve accurate data analysis.
4. It is worth properly measuring user engagement. The resulting data will show you the weaknesses of your website. You can then improve the user experience, ultimately leading to increased traffic, more conversions, and a happier customer base.

 2
2
 2
2
 0
0
Recommended theme posts
Related Articles
Display Advertising Effectiveness Analysis: A Comprehensive Approach to Measuring Its Impact
In this article, I will explain why you shouldn’t underestimate display advertising and how to analyze its impact using Google Analytics 4
Generative Engine Optimization: What Businesses Get From Ranking in SearchGPT
Companies that master SearchGPT SEO and generative engine optimization will capture high-intent traffic from users seeking direct, authoritative answers
From Generic to Iconic: 100 Statistics on Amazon Marketing for Fashion Brands
While traditional fashion retailers were still figuring out e-commerce, one company quietly revolutionized how U.S. consumers shop for everything from workout gear to wedding dresses