Mergescapes App Store Optimization Case Study – Impressions +166% and Installs +60%
Results: App impressions increased by 166% and installs went up by 60%.
The Client
Mergescapes is an interactive mobile game. With its bright and intuitive gameplay, Mergescapes is designed as a leisure activity. Players can enjoy an exciting adventure full of unexpected twists and interesting design tasks.
The Challenge
The goal was to increase app impressions and installs for the selected regions.
The Solution
To achieve our targets, here is what we did:
- To begin, we compiled the competitors of the app.
- We then analyzed the market.
- Based on our analysis, the main countries for promotion were selected.
- Finally, we prepared the semantic core and metadata for these countries in the App Store.
Using our tool, we found new relevant search terms and updated the metadata to cover the maximum amount of search terms.
In total, we released 21 updated localizations:
Dutch, English (Australia), English (Canada), English (U.K.), English (U.S.), French, French (Canada), German, Italian, Japanese, Korean, Portuguese (Brazil), Portuguese (Portugal), Russian, Spanish (Mexico), Spanish (Spain), Turkish, Vietnamese, Catalan, Ukrainian, Arabic.
The Results
After release, we ranked highly for relevant search terms and got to the top. We increased app impressions by 166% (65,699 impressions) and app installs grew by 60% (1919 installs) for the countries with updated localizations.
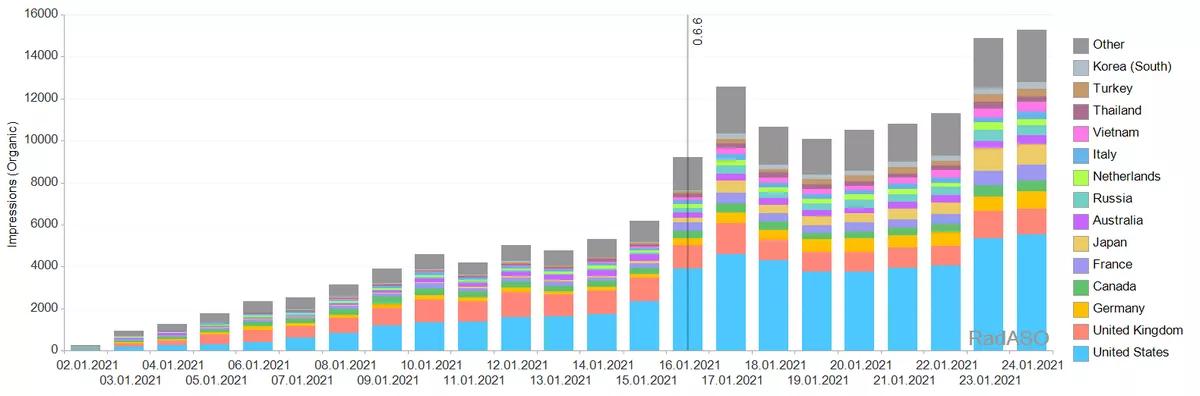
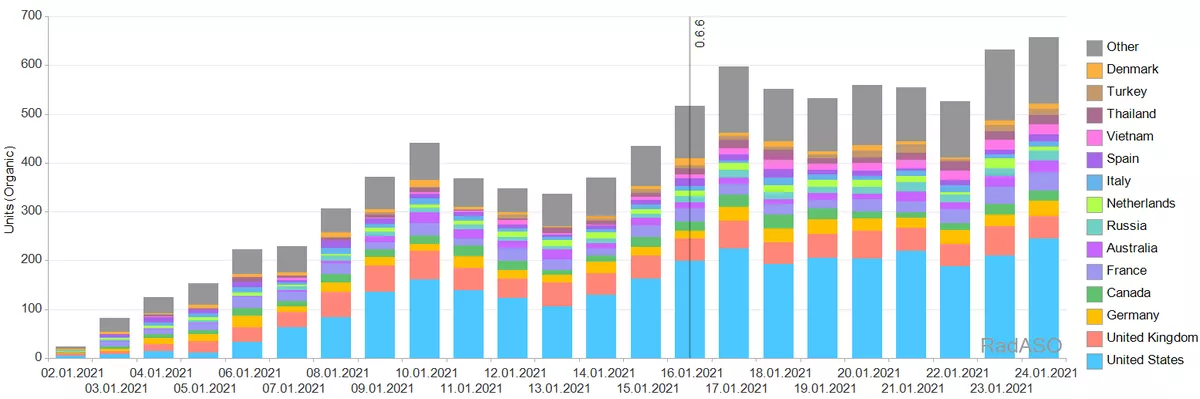
In the following graphs, we can see an increase in app impressions and installs after the release.
Impressions by Search source by day:
Units by Search source by day:
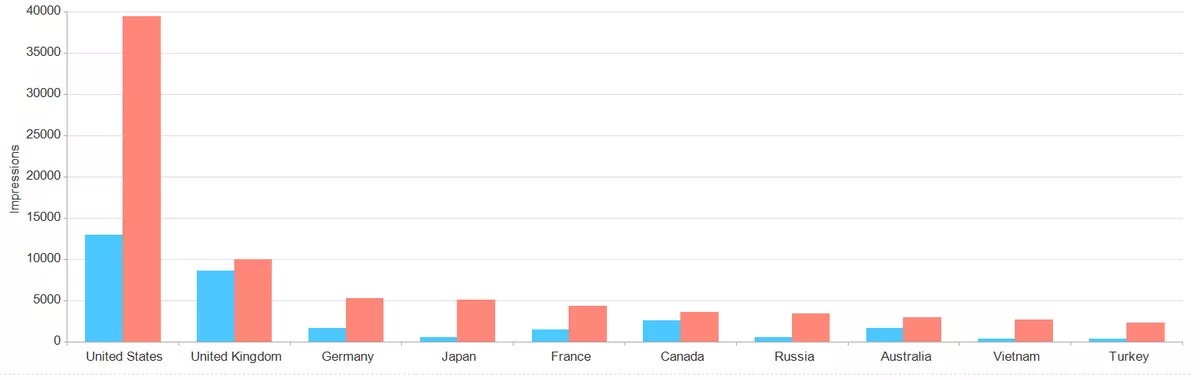
Comparative dynamics of the project's organic traffic.
Impressions by Search for January 7th to 15th and January 16th to 24th in the top 10 countries:
Units by Search for January 7th to 15th and January 16th to 24th in the top 10 countries:
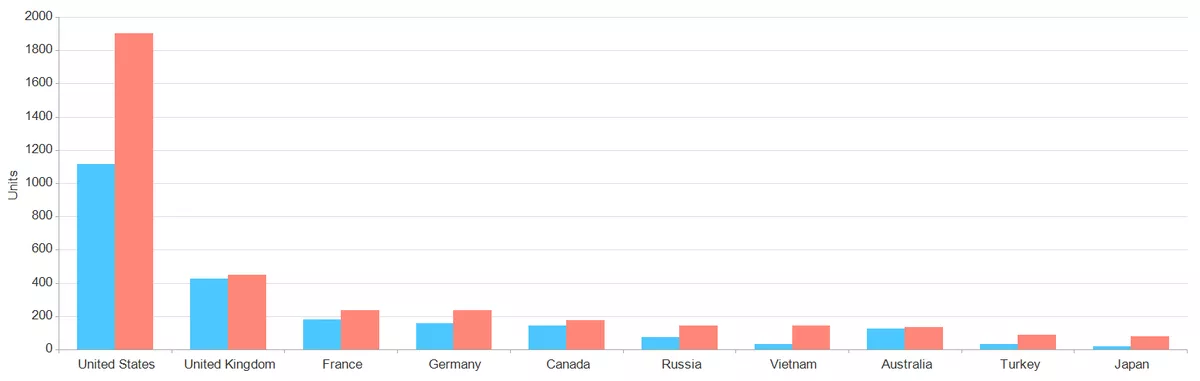
Comparison of installations in the top 10 countries.
Installs by Search for January 7th to 15th and January 16th to 24th by region:
|
Custom region |
Impressions |
Units |
||||||||
|
1/7/2021 - 1/15/2021 |
1/16/2021 - 1/24/2021 |
Change |
% |
MoM |
1/7/2021 - 1/15/2021 |
1/16/2021 - 1/24/2021 |
Change |
% |
MoM |
|
|
United States |
12 970 |
39 436 |
26 466 |
204 % |
88 220 |
1 116 |
1 904 |
788 |
71 % |
2 627 |
|
UK + Ireland |
8 731 |
10 197 |
1 466 |
17 % |
4 887 |
438 |
462 |
24 |
5 % |
80 |
|
Germany + AT + CH + LU |
1 974 |
6 235 |
4 261 |
216 % |
14 203 |
203 |
291 |
88 |
43 % |
293 |
|
France |
1 500 |
4 390 |
2 890 |
193 % |
9 633 |
182 |
237 |
55 |
30 % |
183 |
|
Netherlands / Belgium |
1 593 |
3 599 |
2 006 |
126 % |
6 687 |
159 |
201 |
42 |
26 % |
140 |
|
Russia / Ukraine |
697 |
4 010 |
3 313 |
475 % |
11 043 |
85 |
189 |
104 |
122 % |
347 |
|
Canada |
2 569 |
3 614 |
1 045 |
41 % |
3 483 |
145 |
178 |
33 |
23 % |
110 |
|
Northern Europe |
1 273 |
2 024 |
751 |
59 % |
2 503 |
117 |
175 |
58 |
50 % |
193 |
|
Australia + NZ |
1 754 |
3 324 |
1 570 |
90 % |
5 233 |
137 |
160 |
23 |
17 % |
77 |
|
Vietnam |
352 |
2 712 |
2 360 |
670 % |
7 867 |
32 |
144 |
112 |
350 % |
373 |
|
Thailand |
679 |
2 016 |
1 337 |
197 % |
4 457 |
57 |
142 |
85 |
149 % |
283 |
|
Arabic World |
268 |
1 745 |
1 477 |
551 % |
4 923 |
40 |
119 |
79 |
198 % |
263 |
|
Spain |
844 |
2 058 |
1 214 |
144 % |
4 047 |
78 |
108 |
30 |
38 % |
100 |
|
Eastern Europe |
458 |
1 070 |
612 |
134 % |
2 040 |
63 |
95 |
32 |
51 % |
107 |
|
Italy |
826 |
2 145 |
1 319 |
160 % |
4 397 |
77 |
94 |
17 |
22 % |
57 |
|
Turkey |
338 |
2 309 |
1 971 |
583 % |
6 570 |
34 |
87 |
53 |
156 % |
177 |
|
Rest of World |
426 |
1 457 |
1 031 |
242 % |
3 437 |
48 |
81 |
33 |
69 % |
110 |
|
Japan |
553 |
5 113 |
4 560 |
825 % |
15 200 |
18 |
80 |
62 |
344 % |
207 |
|
India |
234 |
1 169 |
935 |
400 % |
3 117 |
15 |
75 |
60 |
400 % |
200 |
|
Brazil |
294 |
1 332 |
1 038 |
353 % |
3 460 |
34 |
67 |
33 |
97 % |
110 |
|
Hispanic America |
318 |
784 |
466 |
147 % |
1 553 |
42 |
51 |
9 |
21 % |
30 |
|
Indonesia |
206 |
525 |
319 |
155 % |
1 063 |
20 |
41 |
21 |
105 % |
70 |
|
Korea (South) |
308 |
2 055 |
1 747 |
567 % |
5 823 |
22 |
36 |
14 |
64 % |
47 |
|
Malaysia |
119 |
663 |
544 |
457 % |
1 813 |
11 |
27 |
16 |
145 % |
53 |
|
Taiwan + HK + Macau |
145 |
532 |
387 |
267 % |
1 290 |
9 |
24 |
15 |
167 % |
50 |
|
Rest of Europe |
82 |
287 |
205 |
250 % |
683 |
12 |
22 |
10 |
83 % |
33 |
|
Portugal |
17 |
273 |
256 |
1 506 % |
853 |
2 |
18 |
16 |
800 % |
53 |
|
Israel |
23 |
120 |
97 |
422 % |
323 |
3 |
9 |
6 |
200 % |
20 |
|
China / Singapore |
78 |
134 |
56 |
72 % |
187 |
6 |
7 |
1 |
17 % |
3 |
|
Total |
39 629 |
105 328 |
65 699 |
166 % |
218 997 |
3 205 |
5 124 |
1 919 |
60 % |
6 397 |
After release, the app was included in the "New games" category on the Games tab, so the installs by "Browse" increased as well.
Units by source Browse by day:
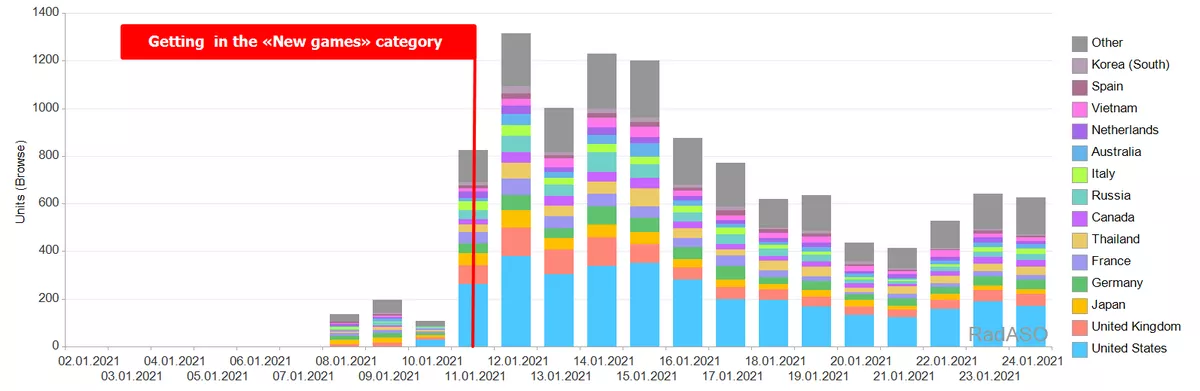
"Browse" includes installs from featuring such as game selections, articles in the App Store for Games and Today tabs, "You may also like" collections on the page of other apps, as well as Category Tops and Overall (Top Free/Paid games).
It is important to note that over time, the number of installs from "Browse" decreased as the app was no longer classified as a new game.
Learn more about App Store Optimization in UK and read:

 6
6
 2
2
 4
4
Recommended theme posts
Related Articles
All About Interaction to Next Paint (INP)
How to calculate, verify, and improve the INP value, and what will it do? Let's find out
What Does a Brand Manager Do? And How to Become One
What employers want to see in a resume and what are the directions of development of a brand manager by specialization — read in the article. Plus a list of useful tools for everyday work
What Is Cost Per Lead, and How to Calculate It
Cost Per Lead (CPL) helps us understand how much it costs to attract potential customers.